Iran's foreign minister, Abbas Araghchi, offered to reopen the Strait of Hormuz within seven days and restart nuclear talks, and oil fell roughly 2.5% to about $92 a barrel. The S&P 500 rose about 0.6% on the relief, with chipmakers and Japanese stocks rising alongside it, while oil producers such as APA and Norway's Equinor gave back about 2%. Cheaper oil helped short-term Treasuries, with the two-year yield slipping to 4.85%, but long bonds didn't get the memo: the 30-year yield edged up to 5.49%.
The rally didn't reach the market's more speculative corners. Bitcoin itself barely moved, dipping less than 1% to around $84,000, but the stocks tied to it fell far harder: crypto miners Riot Platforms and MARA and stablecoin issuer Circle lost about 2.5% as a group, and a fund tracking crypto miners dropped 3%. Last week's high-flyers reversed, too, with cybersecurity firm Zscaler and communications software maker Twilio each down roughly 8% to 10% after leading the prior week's gains, in a software sector Goldman Sachs says hedge funds had just been buying at the fastest pace in five weeks. The pattern of the quarter held: the index is calm, with the VIX near 15, but individual stocks keep swinging hard.
Away from the geopolitics, warehouse retailer Costco closed up about 3%, adding roughly $12 billion in market value, after quarterly profit and revenue beat estimates with some help from one-time tariff refunds. Web-infrastructure company Akamai jumped about 19% after AI developer Anthropic agreed to pay it $11.6 billion over seven years for cloud services. Consumer sentiment came in at 48.1, a touch better than the 47.6 economists expected but well below August's 51.7, and households' one-year inflation expectations climbed to 4.6% from 4%. The clock to watch is Araghchi's seven-day window: if it passes without the strait reopening, the oil relief behind today's gains goes with it.
Iranian Foreign Minister Abbas Araghchi proposed reopening the Strait of Hormuz within seven days and restarting nuclear talks Bloomberg. WTI crude was at $92.26 at 4:02 PM ET, down -2.48% on the day CNBC. The decline hit the Energy Select Sector SPDR and the United States Oil Fund WSJ. The Oil factor fell -0.47% at z=-1.0. The most oil-exposed producers, led by APA (APA), Equinor (EQNR), SM Energy (SM) and Kosmos Energy (KOS), fell -2.00% on a weighted basis.
Lower oil helped short-dated Treasuries but not long bonds. The two-year yield fell 4.1 basis points to 4.85% CNBC. The 30-year yield rose 2.6 basis points to 5.49% CNBC.
| ETF | Theme | Today (close) | 1d Ago | 5d Ago | 20d Ago | 63d Ago |
|---|---|---|---|---|---|---|
| WGMI | crypto miners | -3.13% | +0.06% | +7.84% | +10.32% | -23.27% |
| USO | oil | -3.07% | +2.86% | -1.43% | +20.21% | +40.05% |
| VXX | volatility | -1.51% | +0.46% | -0.90% | -5.23% | -24.43% |
| XOP | oil & gas E&P | -1.37% | +0.77% | -4.04% | +0.19% | +19.43% |
| IGV | software | -1.07% | -0.88% | +1.30% | +4.65% | +26.42% |
| ARKK | innovation growth | -1.00% | +2.15% | +5.50% | +6.90% | +19.81% |
| BITO | crypto | -0.66% | -0.09% | +10.31% | +7.30% | +41.25% |
| SPY | large cap | +0.57% | -0.08% | +0.85% | +0.39% | +4.74% |
| SMH | semiconductors | +1.13% | -0.15% | +7.12% | +8.05% | -5.71% |
| EWJ | japan | +2.23% | -1.28% | -2.14% | +0.40% | +2.59% |
The losers were funds coming off strong runs: oil over the past month, crypto miners and ARK over the past week. Semiconductors and Japan rose alongside the index.
| Factor | Return | Z-Score | 5d Z | 20d Z | 63d Z | Category | Direction |
|---|---|---|---|---|---|---|---|
| Bitcoin / Crypto | -0.70% | -2.33 | -0.88 | 0.43 | 0.78 | Thematic | Crypto-exposed names lagged |
| Residual Volatility | -0.76% | -1.52 | -0.08 | 0.18 | 1.09 | Style-Risk | Most volatile names lagged |
| Profitability | +0.25% | +1.34 | 0.57 | -0.15 | -1.31 | Style | Profitable names led |
| Short-Term Momentum | -0.35% | -1.14 | 0.94 | -0.75 | -3.72 | Style-Momentum | 5-day reversion |
| Oil | -0.47% | -1.00 | -0.4 | +0.7 | +1.6 | Thematic | Oil-exposed names lagged |
| Beta | +0.42% | 0.44 | 1.18 | 0.81 | -0.32 | Style-Risk | Market-sensitive names led |
| Hedge-Fund Ownership | -0.03% | -0.23 | 0.19 | -1.10 | 0.15 | Style-Positioning | Flat |
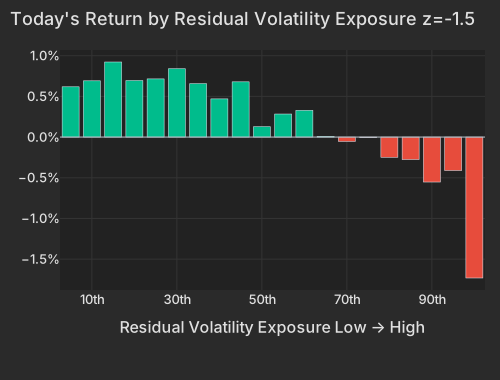
Residual Volatility fell -0.76% at z=-1.5, meaning the most volatile stocks trailed the steadiest ones. It was the day's most important factor. Its 9.5% share of cross-sectional variance ranks in the top tenth of its own past year. Beta rose +0.42% at the same time, even though stocks' exposures to the two factors correlate at 0.63. When those two split, the market is paying for index sensitivity and selling risk that belongs to individual companies.
The high-beta end was led by AI hardware names such as Wolfspeed (WOLF) and POET Technologies (POET), which rose +1.88% on a weighted basis. The lowest-beta bucket fell -0.96% because oil producers dominate it, so Iran helped both ends of Beta. Netskope (NTSK) fell -4.87%, and factor exposures account for almost all of that. Rapid7 (RPD) lost -9.11%, with about four points of it from the same exposures. Profitable companies also outperformed: Profitability gained +0.25% at z=+1.3.
| Bucket | Avg Ret Pct |
|---|---|
| 1 | 0.62 |
| 2 | 0.69 |
| 3 | 0.92 |
| 4 | 0.69 |
| 5 | 0.71 |
| 6 | 0.84 |
| 7 | 0.66 |
| 8 | 0.47 |
| 9 | 0.68 |
| 10 | 0.13 |
| 11 | 0.28 |
| 12 | 0.33 |
| 13 | 0.01 |
| 14 | -0.05 |
| 15 | -0.01 |
| 16 | -0.25 |
| 17 | -0.28 |
| 18 | -0.55 |
| 19 | -0.41 |
| 20 | -1.73 |
Cybersecurity and communications software had the largest single-stock losses. Zscaler (ZS) closed down -9.91%, with nearly three points coming from its volatile, recent-winner profile. Twilio (TWLO) closed down -7.88%, most of it specific to the stock. We don't yet have a confirmed catalyst for either. Software is where clients had been buying: Goldman Sachs prime brokerage reported the largest US equity net buying in five weeks, led by software, in the week through September 18 Bloomberg. Today's selling did not target hedge-fund-owned stocks. Hedge-Fund Ownership was flat, at -0.03% in the model and -0.05% on a raw basis.
Bitcoin was at $83,949 at 4:12 PM ET, down -0.63% CNBC. The most crypto-exposed stocks, including Circle (CRCL), Riot Platforms (RIOT), Galaxy Digital (GLXY) and MARA Holdings (MARA), fell -2.49% on a weighted basis. The Bitcoin / Crypto factor lost -0.70% at z=-2.3, a return in the bottom 1.2% of sessions since 2020. MicroStrategy (MSTR) fell -1.99% even though its company-specific move was positive. Factor exposures took about 4.2 points off the stock.
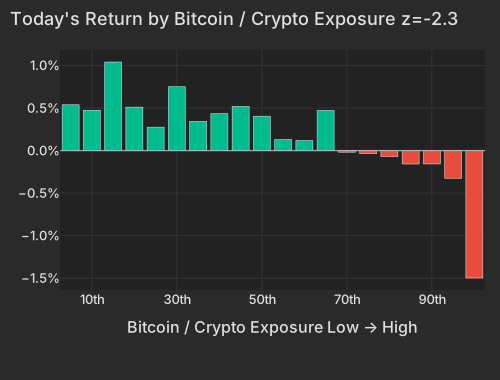
| Bucket | Avg Ret Pct |
|---|---|
| 1 | 0.54 |
| 2 | 0.48 |
| 3 | 1.04 |
| 4 | 0.51 |
| 5 | 0.28 |
| 6 | 0.75 |
| 7 | 0.34 |
| 8 | 0.43 |
| 9 | 0.52 |
| 10 | 0.40 |
| 11 | 0.13 |
| 12 | 0.12 |
| 13 | 0.47 |
| 14 | -0.02 |
| 15 | -0.04 |
| 16 | -0.07 |
| 17 | -0.16 |
| 18 | -0.16 |
| 19 | -0.32 |
| 20 | -1.50 |
The 5-day reversion pattern (Short-Term Momentum in the table) paid again, with the factor down -0.35% at z=-1.1. The losses came from the top of the ranking: the 5% of stocks with the biggest gains last week fell -0.67%. MARA, Viking Therapeutics (VKTX) and Grab (GRAB) led, and Zscaler and Twilio were both among last week's leaders. Over the past five sessions recent gainers had kept rising. Over the quarter they have mostly reversed: the factor is down -8.87% over 60 sessions, a 63-day z of -3.7.
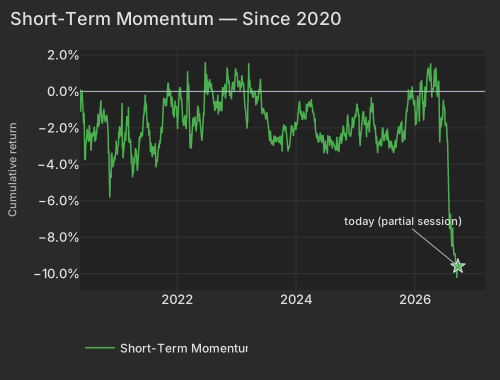
| Date | Cumret Pct |
|---|---|
| 2020-05-13 | 0.12 |
| 2020-06-05 | -1.49 |
| 2020-06-29 | -2.30 |
| 2020-07-22 | -2.86 |
| 2020-08-13 | -2.75 |
| 2020-09-04 | -1.95 |
| 2020-09-29 | -1.64 |
| 2020-10-21 | -1.51 |
| 2020-11-12 | -5.83 |
| 2020-12-07 | -3.76 |
| 2020-12-30 | -3.36 |
| 2021-01-25 | -1.84 |
| 2021-02-17 | -2.60 |
| 2021-03-11 | -2.83 |
| 2021-04-05 | -4.38 |
| 2021-04-27 | -3.44 |
| 2021-05-19 | -2.44 |
| 2021-06-11 | -1.26 |
| 2021-07-06 | -1.94 |
| 2021-07-28 | -3.35 |
| 2021-08-19 | -2.84 |
| 2021-09-13 | -3.13 |
| 2021-10-05 | -1.05 |
| 2021-10-27 | -0.82 |
| 2021-11-18 | -0.26 |
| 2021-12-13 | -1.06 |
| 2022-01-05 | -1.62 |
| 2022-01-28 | -0.44 |
| 2022-02-22 | -1.81 |
| 2022-03-16 | -1.85 |
| 2022-04-07 | -1.59 |
| 2022-05-02 | -1.89 |
| 2022-05-24 | -1.33 |
| 2022-06-16 | -0.64 |
| 2022-07-12 | -0.06 |
| 2022-08-03 | 0.02 |
| 2022-08-25 | -0.95 |
| 2022-09-19 | -1.09 |
| 2022-10-11 | -0.26 |
| 2022-11-02 | 0.36 |
| 2022-11-25 | -0.05 |
| 2022-12-19 | -0.04 |
| 2023-01-12 | 0.43 |
| 2023-02-06 | 0.81 |
| 2023-03-01 | -1.18 |
| 2023-03-23 | 0.67 |
| 2023-04-17 | -0.35 |
| 2023-05-09 | -0.52 |
| 2023-06-01 | -0.02 |
| 2023-06-26 | -1.29 |
| 2023-07-19 | -2.15 |
| 2023-08-10 | -2.91 |
| 2023-09-01 | -2.77 |
| 2023-09-26 | -2.59 |
| 2023-10-18 | -1.97 |
| 2023-11-09 | -2.77 |
| 2023-12-04 | -2.23 |
| 2023-12-27 | -1.67 |
| 2024-01-22 | -0.81 |
| 2024-02-13 | -1.56 |
| 2024-03-07 | -0.67 |
| 2024-04-01 | -0.82 |
| 2024-04-23 | -1.25 |
| 2024-05-15 | -2.58 |
| 2024-06-07 | -2.59 |
| 2024-07-02 | -2.69 |
| 2024-07-25 | -2.48 |
| 2024-08-16 | -2.74 |
| 2024-09-10 | -2.49 |
| 2024-10-02 | -2.47 |
| 2024-10-24 | -2.16 |
| 2024-11-15 | -1.26 |
| 2024-12-10 | -2.22 |
| 2025-01-03 | -1.44 |
| 2025-01-29 | -2.48 |
| 2025-02-21 | -1.09 |
| 2025-03-17 | -2.04 |
| 2025-04-08 | -0.85 |
| 2025-05-01 | -1.87 |
| 2025-05-23 | -2.90 |
| 2025-06-17 | -2.24 |
| 2025-07-11 | -2.34 |
| 2025-08-04 | -2.76 |
| 2025-08-26 | -3.38 |
| 2025-09-18 | -2.41 |
| 2025-10-10 | -1.92 |
| 2025-11-03 | -2.40 |
| 2025-11-25 | 0.11 |
| 2025-12-18 | 0.29 |
| 2026-01-13 | -1.79 |
| 2026-02-05 | 0.49 |
| 2026-03-02 | -1.11 |
| 2026-03-24 | 1.22 |
| 2026-04-16 | 0.10 |
| 2026-05-08 | 0.83 |
| 2026-06-02 | -0.44 |
| 2026-06-25 | -0.77 |
| 2026-07-20 | -1.99 |
| 2026-08-11 | -6.71 |
| 2026-09-02 | -8.99 |
| 2026-09-25 | -9.59 |
Individual stocks are volatile while the index is calm, which is the setting this pattern has been running in. Implied single-stock volatility (Cboe VIXEQ) is 38.57, at the top of its 20-session range. Implied index volatility (Cboe VIX) is 14.7, 18% below its September 10 high of 17.84. Company-specific moves made up 74% of cross-sectional variance today, compared with a one-year average of 66%. Realized 20-day correlation between stocks is 10.15%, the 9.2nd percentile since 2020. Implied one-month correlation (Cboe COR1M) is 7.58, still close to the lows it set August 14.
One session doesn't undo the quarter for volatile stocks: Residual Volatility is still up +2.81% over 60 sessions. Appetite for market-sensitive winners also held. The top 50 high-beta momentum names rose +2.12%, against +0.22% for the rest of the market. The next date to watch is the end of the seven-day window Araghchi set Bloomberg. If it passes without a reopening, the oil relief behind today's rally loses its support.
Costco (COST) closed up +2.96%, adding about $11.6B of market value. Fourth-quarter profit and revenue beat estimates, helped partly by one-time tariff refunds WSJ. BlackBerry (BB) closed down -6.09% and Concentrix (CNXC) down -7.90% after their reports. Akamai rose about +19% after Anthropic agreed to pay it $11.6 billion over seven years for cloud services WSJ.
The final Michigan Consumer Survey, released at 10:00 AM ET, showed sentiment at 48.1 data.sca.isr.umich.edu. That was above the 47.6 consensus but down from 51.7 in August, and one-year inflation expectations rose to 4.6% from 4.0% WSJ. The New York Fed Staff Nowcast, updated at 12:45 PM ET, kept third-quarter GDP growth at 2.3% bea.gov.
Variance decomposition: live intraday — 20260925 session, bracketed against its trailing-year range. Factor returns are trailing through last close. Total cross-sectional dispersion: 4.8%ile of the past year.
Variance mix — % of total, today vs 1d ago vs 1-yr avg
market 34%ile style 60%ile thematic 75%ile idiosyncratic 54%ile
Variance explained — today vs. factor's trailing-year range
Marker = the factor's share of today's total variance, placed in its own trailing-year range (box 25–75%ile, ticks 90%ile and max). Amber marker = unusually load-bearing today (≥90%ile of its own year). Factor name green = up today / red = down.
Correlation & dispersion — realized vs implied
Pairwise realized correlation (20d): 10.15% 9.2%ile since 2020 · 90.5%ile 3m
Top-500 pairwise: 11.55% 12%ile since 2020 · 86%ile 3m · implied (Cboe COR1M): 7.58 1.2%ile of its own history (gap +4.0pp)
Realized 20d vol (ann. pts): all stocks 38 vs VIXEQ 39 · index 11 vs VIX 15 · style factors 19 66%ile
20-day window (19 completed days + today); percentiles vs model history since 2020; '3m' tokens rank vs the trailing 63 trading days; definitions in Terms below. Implied prints (Cboe) are delayed ~15 min. as of 15:58 ET
Top 50 high-beta momentum names (eq-wt, since-2020 rank): +2.1% 78%ile · rest of market +0.2%
| Factor | Today | 1d | 5d | 20d | 60d |
|---|---|---|---|---|---|
| Style-Risk | |||||
| Residual Volatility | -0.76% z-1.5 | +0.10% | -0.09% | +0.41% | +2.81% |
| Beta | +0.42% z+0.4 | -0.02% | +2.53% | +3.50% | -3.19% |
| International | +0.03% z+0.1 | -0.16% | -0.24% | +0.60% | +1.86% |
| Style | |||||
| Profitability | +0.25% z+1.3 | -0.27% | +0.24% | -0.13% | -1.70% |
| Value | +0.16% z+0.7 | -0.28% | -0.05% | +0.36% | +0.41% |
| Leverage | +0.06% z+0.3 | -0.18% | -0.36% | -0.88% | -3.68% |
| Size | +0.10% z+0.3 | +0.27% | +0.81% | +3.16% | +2.79% |
| Liquidity | +0.04% z+0.1 | +0.10% | -0.04% | +1.46% | +3.00% |
| Dividend Yield | -0.02% z-0.1 | -0.10% | -0.35% | +0.03% | +0.23% |
| Growth | -0.00% z-0.0 | +0.22% | +0.31% | -0.17% | +1.42% |
| Style-Momentum | |||||
| Short-Term Momentum | -0.35% z-1.1 | +0.25% | +0.64% | -1.03% | -8.87% |
| Medium-Term Momentum | -0.31% z-1.1 | +0.09% | -0.21% | -0.98% | -0.98% |
| One-Day Momentum | -0.27% z-1.0 | -0.03% | -0.30% | -2.38% | -3.05% |
| Long-Term Momentum | -0.08% z-0.1 | +0.38% | +0.41% | +2.88% | -2.69% |
| Style-Positioning | |||||
| Short Interest | -0.11% z-0.7 | +0.01% | -0.11% | -1.20% | -1.52% |
| Hedge-Fund Ownership | -0.02% z-0.2 | +0.03% | +0.05% | -0.54% | +0.04% |
| Style-Flow | |||||
| Morning Activity | -0.18% z-1.4 | +0.11% | -0.47% | -0.29% | +1.79% |
| Short-Sale Activity | +0.05% z+0.4 | -0.24% | -0.10% | +0.73% | +1.05% |
| Thematic | |||||
| Bitcoin / Crypto | -0.70% z-2.3 | +0.04% | -0.59% | +0.58% | +2.26% |
| Oil | -0.47% z-1.0 | +0.24% | -0.41% | +1.56% | +5.27% |
| Treasury (Duration) | -0.19% z-0.6 | -0.05% | -0.28% | -1.57% | -1.23% |
| Semiconductors | +0.09% z+0.1 | -0.01% | +0.01% | +2.30% | -3.47% |
| China | +0.02% z+0.1 | +0.08% | +0.05% | -0.00% | +1.94% |
| Gold | -0.01% z-0.0 | +0.08% | -0.71% | -1.04% | +4.87% |
5/20/60d windows include today's session; 1d is the previous session.
Market variance share. The fraction of cross-sectional variance explained by the market factor — the attribution companion to pairwise correlation, not a substitute for it.
Factor z-score. Today's factor return divided by its daily-return standard deviation over ~1,600 trading days.
High-beta momentum cohort. US names above $2B market cap in the top quintile of both raw beta and 12-month momentum; membership frozen at each month's first business day. “Top 50” = the 50 strongest by combined rank.
Stock-specific (idiosyncratic) return. The part of a stock's move not explained by market, style, or thematic factors in our decomposition.
VIXEQ / DSPX / COR1M. Cboe implied indices: single-stock volatility, dispersion, and 1-month implied correlation (top-50 S&P names). Quotes delayed ~15 minutes.
Data compiled by FactorPulse AI; edited and verified by Jeff Klein. For informational purposes only. Does not constitute financial advice, an investment recommendation, or an offer to buy or sell any securities. Always consult a qualified financial professional before making investment decisions.
For more on factor construction methodology, see www.factorpulse.com/glossary.