Investors spent Thursday morning selling the very chip stocks they chased last week, dragging the fastest-moving corners of the market lower while the broad index slipped less than half a percent. Semiconductor funds that had gained roughly 10% over the prior week were down about 1.5%, with memory-chip names hit hardest after Bloomberg reported Micron was leading technology lower on worries about a glut of memory chips. Chip-equipment makers took some of the biggest hits, giving back part of a rally that had followed Meta's launch of its Muse assistant. On the other side of the ledger, the quieter parts of the market — consumer staples, healthcare and communications stocks — all rose. It is the latest turn in a pattern that has held for about three months: whatever led the market one week has tended to get sold the next. Options traders are positioned for more of the same, pricing in big swings for individual stocks even as the broad index looks calm.
The bond market offered a small reprieve. The 10-year Treasury yield eased to just under 5.1%, and the two-year fell more, after a selloff that CNBC said had pushed the 30-year yield to its highest since 2004. Weekly jobless claims came in at 197,000, a touch below forecasts, and yields still drifted lower after the release rather than higher. Oil climbed 2% to about $94 a barrel, while gold was little changed near $4,270. Heavily indebted companies, which have suffered their worst three-month stretch in years alongside the rise in yields, were flat on the day. Citadel's Scott Rubner warned that systematic funds could become sellers of stocks into quarter-end, just as companies pause their own share buybacks ahead of earnings season.
Oracle fell about 5%, wiping roughly $22 billion off its value, after CNBC reported that it had invoked "force majeure" on a giant AI data center it is building in New Mexico as part of the Stargate venture. The legal notice would let Oracle delay payments if the site misses its 2028 opening, though the company says the project is on schedule. Casino operator MGM Resorts fell about 10% after IAC Chairman Barry Diller withdrew his bid for the company, and drugmaker Viking Therapeutics dropped 14% after pricing a $500 million stock and convertible-note offering. Meta was one of the day's few big winners, up about 1% and adding roughly $24 billion in value; in Tokyo, enthusiasm for its new Charm handheld and Muse assistant helped the Nikkei rise 1.3%. Costco reports results after the close.
Beta is -0.90% at z=-0.94. On direction and size alone that is an ordinary day. Its importance comes from the other measure: Beta's 29% share of today's cross-sectional variance sits above the 90th percentile of its own past year. The factor had gained +2.20% over the prior five sessions, the high-beta bid that followed Meta's Muse launch, so today gives back less than half of one week's gain.
| Factor | Return | Z-Score | 5d Z | 20d Z | 63d Z | Category | Direction |
|---|---|---|---|---|---|---|---|
| Beta | -0.90% | -0.94 | +1.02 | +0.70 | -0.72 | Style-Risk | High-beta lagging |
| Semiconductors | -0.37% | -0.61 | +0.25 | +0.58 | -1.50 | Thematic | Chip exposure lagging |
| One-Day Momentum | -0.17% | -0.61 | -0.7 | -1.7 | -1.4 | Style-Momentum | Yesterday's winners reverting |
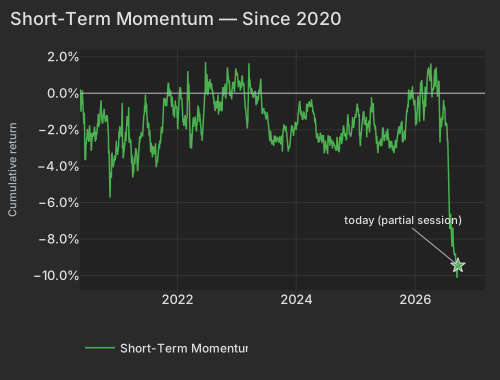
| Short-Term Momentum | -0.05% | -0.17 | +0.26 | -0.94 | -3.63 | Style-Momentum | 5-day reversion, persistent |
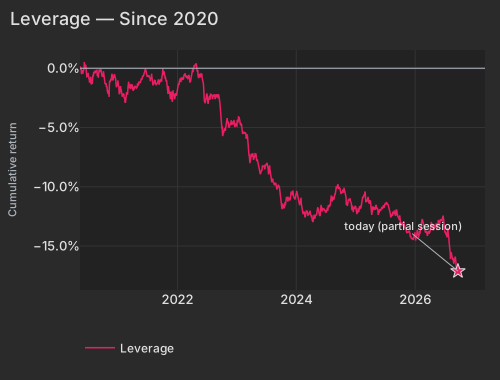
| Leverage | -0.03% | -0.19 | -1.08 | -1.41 | -3.52 | Style | Indebted names lagging, persistent |
| Liquidity | +0.13% | +0.47 | +0.53 | +1.27 | +1.39 | Style | High-turnover names ahead |
| Oil | -0.07% | -0.14 | -0.29 | +1.02 | +1.65 | Thematic | Flat despite crude's rise |
The biggest factor-driven losers are chip-equipment makers. FormFactor (FORM) is down -4.25% with almost none of it company-specific, and MaxLinear (MXL) and Ultra Clean (UCTT) look the same. Bloomberg reported that Micron was leading tech lower on DRAM oversupply risks Bloomberg. In the residualized model, though, the Semiconductors factor is only -0.37%. Most of the chip damage is booked on Beta. The top 50 high-beta momentum names are down -2.21%, while the rest of the market is flat at +0.01%.
| ETF | Theme | Today | 1d Ago | 5d Ago | 20d Ago | 63d Ago |
|---|---|---|---|---|---|---|
| DRAM | memory chips & storage | -2.33% | -2.70% | +11.87% | +10.06% | -11.48% |
| SMH | semiconductors | -1.48% | -1.00% | +10.24% | +8.20% | -2.83% |
| AIPO | AI power infrastructure | -1.35% | -1.60% | +4.40% | +0.35% | -12.43% |
| XLK | technology | -1.16% | -0.47% | +6.32% | +7.60% | +6.83% |
| SPY | large cap | -0.43% | -0.72% | +2.08% | +0.50% | +4.97% |
| XLP | consumer staples | +0.48% | -0.36% | -0.43% | -4.10% | -1.74% |
| XLV | healthcare | +0.78% | -0.64% | +1.00% | -3.34% | +10.49% |
| XLC | communication services | +0.80% | -0.85% | -0.07% | -0.23% | +5.99% |
| USO | oil | +2.02% | +3.30% | -4.70% | +17.98% | +40.02% |
The ETF pattern is the same trade. The two funds with the biggest five-day gains, DRAM and SMH, are the heaviest decliners today, while the low-beta staples and healthcare sectors are up. The 63-day column matters here: DRAM and SMH are still below where they were three months ago, so last week's rally came off a low base.
Oracle (ORCL) is down -5.18%, erasing $22.0B, and -4.48% of that is stock-specific. CNBC reported that Oracle sent a force majeure notice to a Blue Owl Capital unit on Project Jupiter, its Stargate data center in New Mexico. The notice would let Oracle delay payments if the site is not online by its 2028 target. About $18 billion of debt tied to the project trades at stressed levels, and the project has faced regulatory hurdles and local opposition CNBC. Oracle says Project Jupiter remains on schedule, and Blue Owl shares also fell.
The notice puts the financing risk of the AI buildout into a single $22.0B move, on a morning when last week's chip winners are giving back and the most indebted companies are extending their worst 63 days since 2020.
Short-Term Momentum, the factor that tracks how last week's winners do this week, has lost -8.55% over 60 sessions. Its z-score on the 63-day window is z=-3.6. The factor is nearly flat today, at -0.05%, because last week's winners and the high-beta names are largely the same stocks. The model assigns the overlap to Beta first. So today's chip selloff is that pattern in its latest form, landing on the Beta factor.
| Date | Cumret Pct |
|---|---|
| 2020-05-12 | 0.10 |
| 2020-06-04 | -1.69 |
| 2020-06-26 | -1.96 |
| 2020-07-21 | -3.15 |
| 2020-08-12 | -2.43 |
| 2020-09-03 | -1.52 |
| 2020-09-28 | -1.68 |
| 2020-10-20 | -1.53 |
| 2020-11-11 | -5.23 |
| 2020-12-04 | -3.94 |
| 2020-12-29 | -3.39 |
| 2021-01-22 | -2.14 |
| 2021-02-16 | -2.12 |
| 2021-03-10 | -2.06 |
| 2021-04-01 | -4.62 |
| 2021-04-26 | -3.31 |
| 2021-05-18 | -2.39 |
| 2021-06-10 | -1.15 |
| 2021-07-02 | -1.87 |
| 2021-07-27 | -2.75 |
| 2021-08-18 | -3.26 |
| 2021-09-10 | -2.76 |
| 2021-10-04 | -0.92 |
| 2021-10-26 | -0.51 |
| 2021-11-17 | -0.10 |
| 2021-12-10 | -0.83 |
| 2022-01-04 | -1.97 |
| 2022-01-27 | -0.26 |
| 2022-02-18 | -1.31 |
| 2022-03-15 | -0.03 |
| 2022-04-06 | -1.51 |
| 2022-04-29 | -1.71 |
| 2022-05-23 | -1.39 |
| 2022-06-15 | -1.22 |
| 2022-07-11 | 0.04 |
| 2022-08-02 | 0.15 |
| 2022-08-24 | -0.86 |
| 2022-09-16 | -0.94 |
| 2022-10-10 | 0.04 |
| 2022-11-01 | 0.15 |
| 2022-11-23 | -0.12 |
| 2022-12-16 | 0.38 |
| 2023-01-11 | 0.33 |
| 2023-02-03 | 0.98 |
| 2023-02-28 | -1.09 |
| 2023-03-22 | 0.67 |
| 2023-04-14 | 0.05 |
| 2023-05-08 | -0.51 |
| 2023-05-31 | 0.30 |
| 2023-06-23 | -0.98 |
| 2023-07-18 | -1.87 |
| 2023-08-09 | -2.78 |
| 2023-08-31 | -2.51 |
| 2023-09-25 | -2.39 |
| 2023-10-17 | -2.09 |
| 2023-11-08 | -2.49 |
| 2023-12-01 | -2.18 |
| 2023-12-26 | -1.95 |
| 2024-01-19 | -0.68 |
| 2024-02-12 | -1.40 |
| 2024-03-06 | -0.85 |
| 2024-03-28 | -0.73 |
| 2024-04-22 | -1.09 |
| 2024-05-14 | -2.21 |
| 2024-06-06 | -2.55 |
| 2024-07-01 | -2.80 |
| 2024-07-24 | -2.66 |
| 2024-08-15 | -2.70 |
| 2024-09-09 | -2.73 |
| 2024-10-01 | -2.48 |
| 2024-10-23 | -1.98 |
| 2024-11-14 | -1.58 |
| 2024-12-09 | -2.03 |
| 2025-01-02 | -1.13 |
| 2025-01-28 | -2.12 |
| 2025-02-20 | -1.04 |
| 2025-03-14 | -1.92 |
| 2025-04-07 | -1.03 |
| 2025-04-30 | -1.72 |
| 2025-05-22 | -2.90 |
| 2025-06-16 | -2.45 |
| 2025-07-10 | -2.09 |
| 2025-08-01 | -2.79 |
| 2025-08-25 | -3.20 |
| 2025-09-17 | -2.62 |
| 2025-10-09 | -1.61 |
| 2025-10-31 | -2.45 |
| 2025-11-24 | -0.37 |
| 2025-12-17 | 0.11 |
| 2026-01-12 | -1.53 |
| 2026-02-04 | -0.16 |
| 2026-02-27 | -1.19 |
| 2026-03-23 | 0.95 |
| 2026-04-15 | 0.33 |
| 2026-05-07 | 0.35 |
| 2026-06-01 | 0.56 |
| 2026-06-24 | -0.95 |
| 2026-07-17 | -1.75 |
| 2026-08-10 | -6.79 |
| 2026-09-01 | -8.49 |
| 2026-09-24 | -9.45 |
Options pricing supports that picture. Implied single-stock volatility (Cboe VIXEQ) is 39.08, at the top of its 20-session range. Implied index volatility (Cboe VIX) is 14.21, 20% below its September 10 high of 17.84. Individual stocks are priced for large moves on a calm index, and fading last week's leaders has been profitable in that setting.
The Leverage factor has lost -4.12% over 60 sessions. The completed 63-day run through Wednesday is the weakest since 2020. Today's -0.03% adds almost nothing, so the trend is intact but no new selling is showing up. The drawdown has run alongside a Treasury selloff that CNBC reported had pushed the 30-year yield to its highest since 2004.
| Date | Cumret Pct |
|---|---|
| 2020-05-12 | 0.06 |
| 2020-06-04 | -0.04 |
| 2020-06-26 | -0.68 |
| 2020-07-21 | -1.35 |
| 2020-08-12 | -0.22 |
| 2020-09-03 | -0.45 |
| 2020-09-28 | -0.54 |
| 2020-10-20 | -1.27 |
| 2020-11-11 | -1.14 |
| 2020-12-04 | -0.58 |
| 2020-12-29 | -1.32 |
| 2021-01-22 | -2.11 |
| 2021-02-16 | -2.87 |
| 2021-03-10 | -1.35 |
| 2021-04-01 | -1.73 |
| 2021-04-26 | -1.65 |
| 2021-05-18 | -1.15 |
| 2021-06-10 | -0.36 |
| 2021-07-02 | -0.62 |
| 2021-07-27 | -0.46 |
| 2021-08-18 | -1.04 |
| 2021-09-10 | -1.40 |
| 2021-10-04 | -0.00 |
| 2021-10-26 | -1.06 |
| 2021-11-17 | -2.24 |
| 2021-12-10 | -2.17 |
| 2022-01-04 | -1.79 |
| 2022-01-27 | -0.81 |
| 2022-02-18 | -0.53 |
| 2022-03-15 | -0.63 |
| 2022-04-06 | -0.03 |
| 2022-04-29 | 0.06 |
| 2022-05-23 | -0.77 |
| 2022-06-15 | -2.30 |
| 2022-07-11 | -2.91 |
| 2022-08-02 | -2.33 |
| 2022-08-24 | -2.42 |
| 2022-09-16 | -2.51 |
| 2022-10-10 | -5.60 |
| 2022-11-01 | -4.33 |
| 2022-11-23 | -4.80 |
| 2022-12-16 | -4.71 |
| 2023-01-11 | -4.33 |
| 2023-02-03 | -5.32 |
| 2023-02-28 | -5.80 |
| 2023-03-22 | -7.69 |
| 2023-04-14 | -7.74 |
| 2023-05-08 | -7.72 |
| 2023-05-31 | -8.67 |
| 2023-06-23 | -8.54 |
| 2023-07-18 | -8.91 |
| 2023-08-09 | -9.35 |
| 2023-08-31 | -9.79 |
| 2023-09-25 | -10.39 |
| 2023-10-17 | -11.67 |
| 2023-11-08 | -10.85 |
| 2023-12-01 | -10.57 |
| 2023-12-26 | -11.07 |
| 2024-01-19 | -11.27 |
| 2024-02-12 | -12.09 |
| 2024-03-06 | -12.04 |
| 2024-03-28 | -12.03 |
| 2024-04-22 | -12.41 |
| 2024-05-14 | -11.78 |
| 2024-06-06 | -11.90 |
| 2024-07-01 | -12.18 |
| 2024-07-24 | -11.55 |
| 2024-08-15 | -11.03 |
| 2024-09-09 | -10.10 |
| 2024-10-01 | -10.40 |
| 2024-10-23 | -10.09 |
| 2024-11-14 | -11.48 |
| 2024-12-09 | -11.61 |
| 2025-01-02 | -11.68 |
| 2025-01-28 | -11.76 |
| 2025-02-20 | -10.85 |
| 2025-03-14 | -11.16 |
| 2025-04-07 | -11.59 |
| 2025-04-30 | -11.77 |
| 2025-05-22 | -12.38 |
| 2025-06-16 | -11.84 |
| 2025-07-10 | -11.29 |
| 2025-08-01 | -12.10 |
| 2025-08-25 | -12.26 |
| 2025-09-17 | -12.34 |
| 2025-10-09 | -13.28 |
| 2025-10-31 | -13.43 |
| 2025-11-24 | -13.79 |
| 2025-12-17 | -14.36 |
| 2026-01-12 | -14.14 |
| 2026-02-04 | -13.62 |
| 2026-02-27 | -13.45 |
| 2026-03-23 | -14.01 |
| 2026-04-15 | -13.27 |
| 2026-05-07 | -13.32 |
| 2026-06-01 | -13.22 |
| 2026-06-24 | -12.60 |
| 2026-07-17 | -14.11 |
| 2026-08-10 | -16.10 |
| 2026-09-01 | -16.39 |
| 2026-09-24 | -17.12 |
Yields are easing slightly this morning. The 10-year Treasury is at 5.096%, down 1.8 bps CNBC. The 2-year is down more, 4.5 bps to 4.85% CNBC, so the front end is leading a modest rally. The Treasury (Duration) factor is +0.14% but lost -1.64% over 20 sessions. WTI crude is at $94.00 at 9:27 AM ET, up +2.00% CNBC, yet the Oil factor is flat. Citadel's Scott Rubner, in commentary covering the September 23 session, identified systematic funds as a potential source of equity supply into quarter-end as corporate buybacks enter blackout windows.
MGM Resorts (MGM) is down -10.52%, erasing about $1.0B, after IAC Chairman Barry Diller withdrew his bid for the company The Wall Street Journal. Viking Therapeutics (VKTX) is down -14.34%, two sessions after a 36% rally. Its PR Newswire release said it priced an upsized $500 million offering of common stock and convertible notes, with the shares at $35.00. TD SYNNEX (SNX) is down -10.35%, erasing $2.4B. Its BusinessWire results release showed adjusted EPS of $5.68 against $4.64 expected. Free cash flow swung to a $975.6 million deficit on inventory builds. Costco (COST) reports after the close and is up +0.19%.
Several large moves have no sourced driver yet. Acadia (ACAD) is down -10.32%, Gildan (GIL) -8.79% and Everpure (P) is up +10.56%, all stock-specific. Kinross Gold (KGC) is down -7.86%, much more than spot gold, which is -0.33% at $4,272.90 at 9:36 AM ET CNBC. Meta (META) is up +1.28%, adding $24.5B. In Tokyo, the Meta Charm handheld and Muse assistant lifted chip suppliers such as Ibiden and helped the Nikkei 225 rise 1.33%, even as the 10-year JGB yield reached its highest since 1996 Economic Times.
Initial Claims the BLS, released at 8:30 AM ET, fell to 197,000 against a 201,000 consensus, and the four-week average dropped to a six-week low of 202,250. Front-end Treasury yields are lower since the release, not higher. The next FOMC the Federal Reserve decision is October 28, eight days after the September 16 meeting's successor window opens for pricing.
Variance decomposition: live intraday — 20260924 session, bracketed against its trailing-year range. Factor returns are trailing through last close. Total cross-sectional dispersion: 1.6%ile of the past year.
Variance mix — % of total, today vs 1d ago vs 1-yr avg
market 34%ile style 89%ile thematic 72%ile idiosyncratic 26%ile
Variance explained — today vs. factor's trailing-year range
Marker = the factor's share of today's total variance, placed in its own trailing-year range (box 25–75%ile, ticks 90%ile and max). Amber marker = unusually load-bearing today (≥90%ile of its own year). Factor name green = up today / red = down.
Correlation & dispersion — realized vs implied
Pairwise realized correlation (20d): 10.08% 9.0%ile since 2020 · 89%ile 3m
Top-500 pairwise: 11.51% 12%ile since 2020 · 84%ile 3m · implied (Cboe COR1M): 7.59 1.2%ile of its own history (gap +3.9pp)
Realized 20d vol (ann. pts): all stocks 39 vs VIXEQ 39 · index 11 vs VIX 14 · style factors 19 67%ile
20-day window (19 completed days + today); percentiles vs model history since 2020; '3m' tokens rank vs the trailing 63 trading days; definitions in Terms below. Implied prints (Cboe) are delayed ~15 min. as of 09:21 ET
Top 50 high-beta momentum names (eq-wt, since-2020 rank): -2.2% 18%ile · rest of market +0.0%
| Factor | Today | 1d | 5d | 20d | 60d |
|---|---|---|---|---|---|
| Style-Risk | |||||
| Beta | -0.90% z-0.9 | -0.59% | +2.20% | +3.05% | -6.53% |
| Residual Volatility | +0.08% z+0.2 | +0.21% | +0.53% | +1.89% | +3.79% |
| International | -0.03% z-0.1 | -0.17% | -0.26% | +0.54% | +1.79% |
| Style | |||||
| Liquidity | +0.13% z+0.5 | -0.18% | +0.32% | +1.54% | +3.18% |
| Value | -0.08% z-0.3 | +0.28% | -0.02% | -0.04% | +0.16% |
| Growth | -0.08% z-0.3 | +0.09% | +0.08% | -0.14% | +1.56% |
| Size | -0.08% z-0.2 | +0.37% | +0.69% | +2.78% | +2.15% |
| Leverage | -0.03% z-0.2 | -0.18% | -0.40% | -1.06% | -4.12% |
| Profitability | -0.02% z-0.1 | +0.18% | +0.59% | -0.47% | -2.08% |
| Dividend Yield | +0.01% z+0.0 | +0.08% | -0.08% | +0.17% | +0.17% |
| Style-Momentum | |||||
| One-Day Momentum | -0.17% z-0.6 | +0.07% | -0.41% | -2.19% | -3.30% |
| Long-Term Momentum | -0.26% z-0.4 | +0.12% | +0.11% | +2.18% | -5.48% |
| Short-Term Momentum | -0.05% z-0.2 | +0.07% | +0.18% | -1.28% | -8.55% |
| Medium-Term Momentum | +0.01% z+0.0 | +0.48% | +0.01% | -0.39% | -1.29% |
| Style-Positioning | |||||
| Hedge-Fund Ownership | -0.04% z-0.3 | -0.17% | +0.16% | -0.71% | +0.17% |
| Short Interest | -0.02% z-0.1 | -0.30% | -0.42% | -1.11% | -1.23% |
| Style-Flow | |||||
| Morning Activity | +0.02% z+0.2 | -0.21% | -0.64% | -0.03% | +2.06% |
| Short-Sale Activity | +0.01% z+0.1 | +0.11% | +0.13% | +0.66% | +1.19% |
| Thematic | |||||
| Semiconductors | -0.37% z-0.6 | +0.32% | +0.34% | +1.57% | -6.32% |
| Bitcoin / Crypto | +0.14% z+0.5 | +0.09% | +0.57% | +2.14% | +2.92% |
| Treasury (Duration) | +0.14% z+0.4 | -0.39% | -0.13% | -1.64% | -1.19% |
| Gold | -0.13% z-0.4 | -0.70% | -0.74% | -0.93% | +5.07% |
| Oil | -0.07% z-0.1 | +0.36% | -0.30% | +2.17% | +5.45% |
| China | +0.03% z+0.1 | -0.30% | +0.38% | +0.46% | +2.25% |
5/20/60d windows include today's session; 1d is the previous session.
Pairwise realized correlation. Index variance net of the weighted idiosyncratic diagonal, over the cross terms — the estimator used for implied-correlation indices. 20-day window unless noted; history since 2020.
Market variance share. The fraction of cross-sectional variance explained by the market factor — the attribution companion to pairwise correlation, not a substitute for it.
Factor z-score. Today's factor return divided by its daily-return standard deviation over ~1,600 trading days.
Conditional importance. A factor's relative share of what a tree-based fit of today's stock returns explains; sums to 100% across factors.
High-beta momentum cohort. US names above $2B market cap in the top quintile of both raw beta and 12-month momentum; membership frozen at each month's first business day. “Top 50” = the 50 strongest by combined rank.
Dispersion (realized). Total cross-sectional volatility net of the market component; high dispersion is the flip side of low correlation.
Stock-specific (idiosyncratic) return. The part of a stock's move not explained by market, style, or thematic factors in our decomposition.
VIXEQ / DSPX / COR1M. Cboe implied indices: single-stock volatility, dispersion, and 1-month implied correlation (top-50 S&P names). Quotes delayed ~15 minutes.
Data compiled by FactorPulse AI; edited and verified by Jeff Klein. For informational purposes only. Does not constitute financial advice, an investment recommendation, or an offer to buy or sell any securities. Always consult a qualified financial professional before making investment decisions.
For more on factor construction methodology, see www.factorpulse.com/glossary.