A blowout reading on the U.S. economy and fresh hawkish talk from the Federal Reserve sent the 10-year Treasury yield to about 5.1%, its highest since 2007. S&P Global's September survey of business activity jumped to its strongest level in more than five years, and Fed Governor Michael Barr told an audience in Chicago that getting inflation back to 2% will take more tightening. Regional Fed presidents Alberto Musalem and Austan Goolsbee also left the door open to another hike. Futures markets now put the odds of a quarter-point increase at the Fed's late-October meeting at roughly 55%, up from under 10% a month ago. The dollar rose to an eight-week high.
The stronger dollar and higher yields landed hardest on gold, which slipped about 1.6% to around $4,290 an ounce, and on gold miners, which fell roughly 4% as a group, giving back most of last week's bounce. Silver, biotech, homebuilders, utilities and small caps all fell more than the S&P 500, which lost about 0.8%, and long-term Treasuries dropped more than 1.5%. Heavily indebted companies, which feel higher borrowing costs first, extended their worst three-month stretch since 2020. Energy was the lone bright spot: crude climbed more than 2% to about $93 a barrel after President Trump backed a ban on diesel exports, a move the oil industry warns would push fuel prices higher.
Away from rates, the selloff tied to Meta's new Muse AI agent entered its third day and shifted from finance to travel. Online booking sites Expedia and Airbnb each fell close to 8% on worries that the agent could cut them out of the reservation process, the same threat to businesses that rely on customers not switching that hit Charles Schwab and Allstate on Tuesday. Financial stocks steadied as Meta's Connect conference got under way. Payroll processor Paychex dropped nearly 9% after reporting slower sales growth and softer demand from small and midsize businesses, a note of caution that cuts against the day's upbeat economic survey. With the next Fed decision five weeks out, the question is whether the rest of the small-business data looks more like Paychex or more like that survey.
S&P Global's flash U.S. composite PMI rose to 58.4 in September from 56.0, its fastest output growth in more than five years. Governor Michael Barr said in Chicago that getting inflation back to 2% will take more tightening. Federal Reserve St. Louis Fed President Alberto Musalem and Chicago Fed President Austan Goolsbee also left the door open to another hike. NYT CME FedWatch put the odds of a quarter-point hike at the October 27–28 meeting at 55%, up from 9% a month ago. Federal Reserve
The 10-year yield rose 13.3 bps to 5.10%, the highest since 2007. CNBC WSJ Mid-curve maturities moved most: the 5-year rose 14.4 bps to 4.986%, against 8.9 bps on the 30-year. CNBC That is the part of the curve where one or two extra hikes get priced. The dollar index rose +0.50% to 101.10 at 4:11 PM ET, an eight-week high but still below June's 101.8 peak. CNBC
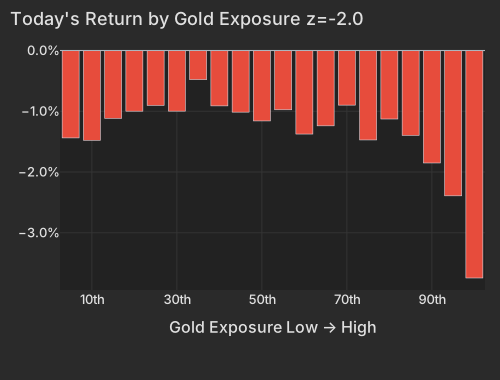
Spot gold was $4,285.79 at 4:11 PM ET, down -1.58%. CNBC A firmer dollar and higher yields raised the cost of holding a metal that pays no income. NYT Stocks with the most gold exposure took the losses, and the top exposure bucket fell -3.74%. NovaGold (NG) fell -6.63%, Silvercorp Metals (SVM) -6.65% and Hycroft Mining (HYMC) -6.45%. For all three, the gold move explains almost the whole drop; very little was company-specific.
| Bucket | Avg Ret Pct |
|---|---|
| 1 | -1.44 |
| 2 | -1.48 |
| 3 | -1.12 |
| 4 | -1.00 |
| 5 | -0.90 |
| 6 | -1.00 |
| 7 | -0.48 |
| 8 | -0.91 |
| 9 | -1.01 |
| 10 | -1.16 |
| 11 | -0.98 |
| 12 | -1.38 |
| 13 | -1.24 |
| 14 | -0.90 |
| 15 | -1.47 |
| 16 | -1.13 |
| 17 | -1.40 |
| 18 | -1.85 |
| 19 | -2.39 |
| 20 | -3.74 |
The miners also show up in a second factor. 20-day momentum (Medium-Term Momentum in the table) rose +0.45% at z=+1.58. That gain came from the past month's worst performers falling further, and gold miners were among them. The loss took back GDX's bounce from the past week and deepened its -5.51% slide over 20 sessions. Over 63 sessions, the fund is still up +25.97%.
The Treasury (Duration) factor fell -0.39% at z=-1.20, taking its 20-session loss to -2.12%. Value gained +0.29% at z=+1.22 as cheap stocks beat expensive ones, which is the direction a higher discount rate favors. That runs against the factor's multi-year record of cheap stocks lagging. Size rose +0.36% at z=+1.01 as large companies held up better than small ones. Oil went the other way: WTI crude was $92.63 at 4:01 PM ET, up +2.33%. CNBC President Trump backs a ban on diesel exports, which the oil industry warns would raise fuel prices. NYT
| ETF | Theme | Today | 1d Ago | 5d Ago | 20d Ago | 63d Ago |
|---|---|---|---|---|---|---|
| GDX | gold miners | -4.33% | +3.60% | +3.93% | -5.51% | +25.97% |
| SLV | silver | -4.26% | +1.84% | +5.56% | -2.36% | +8.97% |
| XBI | biotech | -3.98% | +2.30% | +5.09% | -1.40% | +10.09% |
| ITB | homebuilders | -2.38% | +3.21% | +2.14% | -6.14% | -5.68% |
| XLU | utilities | -1.90% | -0.32% | -1.19% | -5.53% | -9.41% |
| IWM | small cap | -1.81% | +0.57% | +0.73% | -3.36% | -2.49% |
| TLT | long-term Treasuries | -1.62% | -0.06% | +1.29% | -0.60% | -4.06% |
| SPY | large cap | -0.76% | -0.02% | +2.36% | +1.55% | +5.69% |
| XLE | energy | +0.92% | -1.09% | -5.72% | -1.51% | +14.13% |
| USO | oil | +3.30% | -2.75% | -10.98% | +8.98% | +29.50% |
Every rate- and dollar-sensitive fund in this table did worse than the S&P 500, and the two energy funds were the only gainers. Stocks also moved together more than usual: the broad market explained 20.9% of the variation across individual stocks today, against 7.6% over the past 20 sessions.
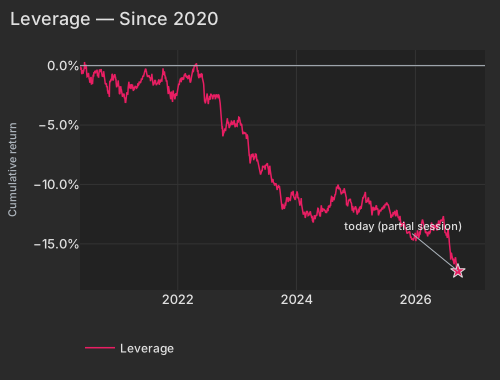
Leverage lost another -0.16% (z=-0.94), which is small for a single day. The factor is down -4.33% over the past 60 sessions. Its 63-day stretch through Tuesday's close was the weakest since 2020. Wednesday's jump in yields landed directly on that exposure, since highly indebted companies are the ones that feel higher borrowing costs first.
| Date | Cumret Pct |
|---|---|
| 2020-05-11 | -0.22 |
| 2020-06-03 | -0.34 |
| 2020-06-25 | -0.89 |
| 2020-07-20 | -1.60 |
| 2020-08-11 | -0.51 |
| 2020-09-02 | -0.96 |
| 2020-09-25 | -0.76 |
| 2020-10-19 | -1.51 |
| 2020-11-10 | -1.33 |
| 2020-12-03 | -0.96 |
| 2020-12-28 | -1.74 |
| 2021-01-21 | -2.16 |
| 2021-02-12 | -3.09 |
| 2021-03-09 | -1.66 |
| 2021-03-31 | -1.88 |
| 2021-04-23 | -1.90 |
| 2021-05-17 | -1.47 |
| 2021-06-09 | -0.64 |
| 2021-07-01 | -0.89 |
| 2021-07-26 | -0.87 |
| 2021-08-17 | -1.25 |
| 2021-09-09 | -1.39 |
| 2021-10-01 | -0.65 |
| 2021-10-25 | -1.35 |
| 2021-11-16 | -2.54 |
| 2021-12-09 | -2.44 |
| 2022-01-03 | -2.19 |
| 2022-01-26 | -1.08 |
| 2022-02-17 | -0.64 |
| 2022-03-14 | -0.83 |
| 2022-04-05 | -0.41 |
| 2022-04-28 | 0.05 |
| 2022-05-20 | -0.87 |
| 2022-06-14 | -2.56 |
| 2022-07-08 | -3.24 |
| 2022-08-01 | -2.50 |
| 2022-08-23 | -2.77 |
| 2022-09-15 | -2.68 |
| 2022-10-07 | -5.67 |
| 2022-10-31 | -4.53 |
| 2022-11-22 | -5.05 |
| 2022-12-15 | -4.59 |
| 2023-01-10 | -4.80 |
| 2023-02-02 | -5.38 |
| 2023-02-27 | -5.77 |
| 2023-03-21 | -7.70 |
| 2023-04-13 | -7.83 |
| 2023-05-05 | -7.94 |
| 2023-05-30 | -9.05 |
| 2023-06-22 | -8.61 |
| 2023-07-17 | -9.17 |
| 2023-08-08 | -9.56 |
| 2023-08-30 | -9.95 |
| 2023-09-22 | -10.43 |
| 2023-10-16 | -11.77 |
| 2023-11-07 | -11.26 |
| 2023-11-30 | -11.04 |
| 2023-12-22 | -11.23 |
| 2024-01-18 | -11.44 |
| 2024-02-09 | -12.46 |
| 2024-03-05 | -12.24 |
| 2024-03-27 | -12.26 |
| 2024-04-19 | -12.75 |
| 2024-05-13 | -12.12 |
| 2024-06-05 | -11.90 |
| 2024-06-28 | -12.18 |
| 2024-07-23 | -11.88 |
| 2024-08-14 | -11.06 |
| 2024-09-06 | -10.22 |
| 2024-09-30 | -10.50 |
| 2024-10-22 | -10.50 |
| 2024-11-13 | -11.81 |
| 2024-12-06 | -11.60 |
| 2024-12-31 | -11.84 |
| 2025-01-27 | -11.86 |
| 2025-02-19 | -11.11 |
| 2025-03-13 | -11.44 |
| 2025-04-04 | -11.60 |
| 2025-04-29 | -11.96 |
| 2025-05-21 | -12.52 |
| 2025-06-13 | -11.94 |
| 2025-07-09 | -11.75 |
| 2025-07-31 | -12.23 |
| 2025-08-22 | -12.50 |
| 2025-09-16 | -12.51 |
| 2025-10-08 | -13.51 |
| 2025-10-30 | -13.70 |
| 2025-11-21 | -14.03 |
| 2025-12-16 | -14.57 |
| 2026-01-09 | -14.32 |
| 2026-02-03 | -13.95 |
| 2026-02-26 | -13.63 |
| 2026-03-20 | -14.37 |
| 2026-04-14 | -13.20 |
| 2026-05-06 | -13.45 |
| 2026-05-29 | -13.24 |
| 2026-06-23 | -12.90 |
| 2026-07-16 | -14.21 |
| 2026-08-07 | -15.83 |
| 2026-08-31 | -16.72 |
| 2026-09-23 | -17.29 |
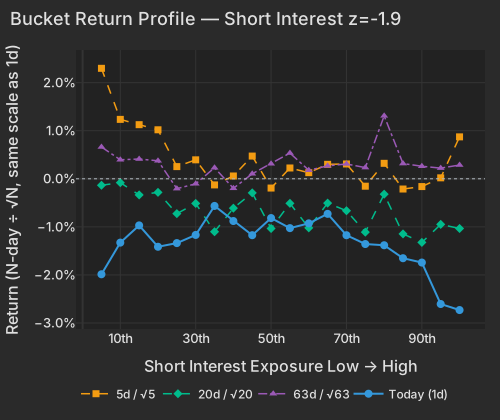
Short Interest fell -0.32% at z=-1.91, meaning the most heavily shorted stocks lagged those with little short interest. Biotech and Chinese ADRs were heavily represented among those most-shorted names. This is the factor's usual direction, and it is now down -1.24% over 20 sessions. The 5-day reversion pattern, where last week's movers snap back, has run for three months (Short-Term Momentum 63-day z=-3.5). It was flat today at +0.03%.
| Bucket | Ret 1D Pct | Ret 5D Norm Pct | Ret 20D Norm Pct | Ret 63D Norm Pct |
|---|---|---|---|---|
| 1 | -1.99 | 2.30 | -0.13 | 0.66 |
| 2 | -1.33 | 1.24 | -0.08 | 0.40 |
| 3 | -0.97 | 1.13 | -0.34 | 0.41 |
| 4 | -1.41 | 1.02 | -0.28 | 0.37 |
| 5 | -1.34 | 0.25 | -0.73 | -0.21 |
| 6 | -1.17 | 0.39 | -0.51 | -0.10 |
| 7 | -0.56 | -0.13 | -1.10 | 0.23 |
| 8 | -0.88 | 0.06 | -0.61 | -0.20 |
| 9 | -1.17 | 0.47 | -0.29 | 0.10 |
| 10 | -0.82 | -0.19 | -1.03 | 0.31 |
| 11 | -1.03 | 0.22 | -0.51 | 0.53 |
| 12 | -0.93 | 0.13 | -1.02 | 0.18 |
| 13 | -0.73 | 0.30 | -0.51 | 0.27 |
| 14 | -1.17 | 0.31 | -0.66 | 0.31 |
| 15 | -1.36 | -0.15 | -1.11 | 0.23 |
| 16 | -1.38 | 0.32 | -0.32 | 1.31 |
| 17 | -1.65 | -0.21 | -1.15 | 0.32 |
| 18 | -1.74 | -0.16 | -1.32 | 0.26 |
| 19 | -2.61 | 0.02 | -0.95 | 0.22 |
| 20 | -2.73 | 0.87 | -1.03 | 0.29 |
| Factor | Return | Z-Score | 5d Z | 20d Z | 63d Z | Category | Direction |
|---|---|---|---|---|---|---|---|
| Gold | -0.66% | -2.04 | -0.18 | -0.86 | +1.72 | Thematic | Gold-exposed names lagged |
| Short Interest | -0.32% | -1.91 | -1.12 | -1.67 | -0.75 | Positioning | Most-shorted lagged |
| Medium-Term Momentum | +0.45% | +1.58 | +0.40 | -0.42 | -0.18 | Momentum | Month's laggards fell further |
| Hedge-Fund Ownership | -0.16% | -1.48 | +0.44 | -1.31 | +0.51 | Positioning | Hedge-fund-heavy names lagged |
| Value | +0.29% | +1.22 | -0.13 | +0.21 | -0.33 | Style | Cheap beat expensive |
| Treasury (Duration) | -0.39% | -1.20 | -0.1 | -1.5 | -0.5 | Thematic | Duration exposure lagged |
| Leverage | -0.16% | -0.94 | -0.91 | -1.38 | -3.36 | Style | Indebted names lagged |
| Short-Term Momentum | +0.03% | +0.11 | +0.20 | -1.52 | -3.50 | Momentum | Flat |
Expedia closed -7.72% and Airbnb -7.60%. About three-quarters of each move was company-specific rather than market or factor-driven. The fear is that Meta's Muse AI agent will cut the online travel sites out of bookings. WSJ Bloomberg reported Wednesday that Muse is weighing on stocks that depend on "consumer inertia," the common thread between Tuesday's losers, Schwab and Allstate, and today's travel sites. Financials held steady, with XLF down -0.49% after Tuesday's -1.97%, as Meta Connect got under way. WSJ
Paychex (PAYX) closed -8.80% after reporting slower fiscal first-quarter sales growth and softer demand from small and mid-sized businesses. WSJ Alkami Technology (ALKT) lost -19.16% after ending its strategic review and deciding to stay independent. WSJ McDonald's (MCD) fell -4.81%, erasing $8.66B of market value. Almost all of that move was specific to McDonald's, and none of today's coverage explains it. The Paychex report cuts against a 58.4 PMI. With the next Fed decision five weeks away, what matters is whether more small-business data looks like Paychex or like the PMI.
Variance decomposition: live intraday — 20260923 session, bracketed against its trailing-year range. Factor returns are trailing through last close. Total cross-sectional dispersion: 22%ile of the past year.
Variance mix — % of total, today vs 1d ago vs 1-yr avg
market 88%ile style 34%ile thematic 84%ile idiosyncratic 29%ile
Variance explained — today vs. factor's trailing-year range
Marker = the factor's share of today's total variance, placed in its own trailing-year range (box 25–75%ile, ticks 90%ile and max). Amber marker = unusually load-bearing today (≥90%ile of its own year). Factor name green = up today / red = down.
Correlation & dispersion — realized vs implied
Pairwise realized correlation (20d): 9.78% 8.1%ile since 2020 · 87%ile 3m
Top-500 pairwise: 10.95% 11%ile since 2020 · 79%ile 3m · implied (Cboe COR1M): 7.59 1.2%ile of its own history (gap +3.4pp)
Realized 20d vol (ann. pts): all stocks 39 vs VIXEQ 39 · index 11 vs VIX 14 · style factors 19 67%ile
20-day window (19 completed days + today); percentiles vs model history since 2020; '3m' tokens rank vs the trailing 63 trading days; definitions in Terms below. Implied prints (Cboe) are delayed ~15 min. as of 15:58 ET
Top 50 high-beta momentum names (eq-wt, since-2020 rank): -2.4% 17%ile · rest of market -0.9%
| Factor | Today | 1d | 5d | 20d | 60d |
|---|---|---|---|---|---|
| Style-Risk | |||||
| Beta | -0.61% z-0.6 | +0.99% | +4.60% | +3.97% | -4.21% |
| International | -0.14% z-0.5 | +0.06% | +0.02% | +0.34% | +1.91% |
| Residual Volatility | +0.19% z+0.4 | +0.05% | +0.75% | +1.61% | +4.15% |
| Style | |||||
| Value | +0.29% z+1.2 | +0.04% | -0.07% | +0.22% | +0.15% |
| Size | +0.36% z+1.0 | -0.25% | +0.88% | +2.84% | +2.43% |
| Leverage | -0.16% z-0.9 | -0.10% | -0.34% | -1.04% | -4.33% |
| Profitability | +0.16% z+0.8 | +0.21% | +0.42% | -0.31% | -1.90% |
| Liquidity | -0.18% z-0.7 | -0.01% | +0.25% | +1.27% | +2.61% |
| Dividend Yield | +0.09% z+0.5 | -0.11% | +0.21% | +0.20% | -0.07% |
| Growth | +0.09% z+0.4 | -0.12% | -0.03% | +0.05% | +1.94% |
| Style-Momentum | |||||
| Medium-Term Momentum | +0.45% z+1.6 | -0.53% | +0.26% | -0.54% | -1.20% |
| Long-Term Momentum | +0.11% z+0.2 | +0.17% | +0.93% | +2.69% | -4.75% |
| Short-Term Momentum | +0.03% z+0.1 | +0.22% | +0.14% | -2.07% | -9.07% |
| One-Day Momentum | +0.03% z+0.1 | +0.12% | -0.21% | -2.39% | -2.77% |
| Style-Positioning | |||||
| Short Interest | -0.32% z-1.9 | +0.22% | -0.42% | -1.24% | -1.28% |
| Hedge-Fund Ownership | -0.16% z-1.5 | +0.07% | +0.11% | -0.64% | +0.17% |
| Style-Flow | |||||
| Morning Activity | -0.18% z-1.5 | +0.02% | -0.41% | -0.20% | +1.96% |
| Short-Sale Activity | +0.11% z+1.0 | +0.09% | +0.13% | +0.64% | +1.22% |
| Thematic | |||||
| Gold | -0.66% z-2.0 | +0.28% | -0.13% | -1.25% | +4.76% |
| Treasury (Duration) | -0.39% z-1.2 | +0.59% | -0.10% | -2.12% | -1.36% |
| Oil | +0.39% z+0.8 | -0.09% | +0.17% | +2.21% | +5.90% |
| China | -0.30% z-0.7 | +0.06% | +0.21% | +0.33% | +2.01% |
| Semiconductors | +0.31% z+0.5 | +0.00% | +0.90% | +2.63% | -5.17% |
| Bitcoin / Crypto | +0.08% z+0.3 | -0.03% | +0.35% | +1.64% | +2.58% |
5/20/60d windows include today's session; 1d is the previous session.
Factor z-score. Today's factor return divided by its daily-return standard deviation over ~1,600 trading days.
Data compiled by FactorPulse AI; edited and verified by Jeff Klein. For informational purposes only. Does not constitute financial advice, an investment recommendation, or an offer to buy or sell any securities. Always consult a qualified financial professional before making investment decisions.
For more on factor construction methodology, see www.factorpulse.com/glossary.