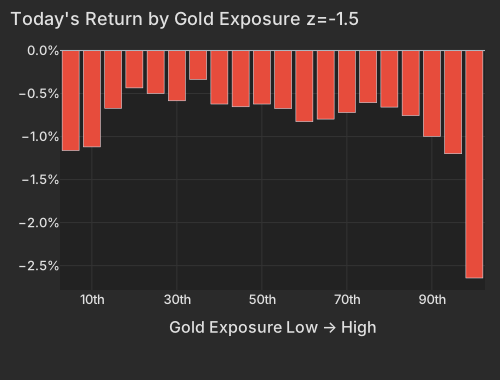
The ten-year Treasury yield pushed above 5% Wednesday morning, and gold miners paid for it. The benchmark yield rose about 8 hundredths of a point to just over 5%, the two-year climbed a bit more to nearly 4.9%, and the dollar firmed roughly half a percent to within a point of its June high. Higher rates and a stronger dollar are the classic squeeze on bullion: spot gold fell about 1.5% to roughly $4,290, silver slipped nearly 4%, and the gold-mining group dropped more than 4%, with Newmont, the largest gold producer, down about 4%. Trading in the miners was running at close to twice its normal pace. The drop erased a week-long bounce, though the group is still up around 26% over the past three months, so this is a second leg down in a month-old slide inside a larger rally.
The selling had a familiar pattern: the stocks that lost the most over the past month kept losing, while last month's winners simply sat still, an unusually lopsided day by the standards of the past six years. Utilities lost about 1.5%, small caps roughly 1%, and the S&P 500 about half a percent, while long-term Treasuries fell as well. Heavily indebted companies, which have had their worst three-month stretch since 2020, lagged again but did not get hit any harder despite the rate move, and other rate-sensitive stocks barely budged once the broad market's move is accounted for. So far, the jump in yields is landing on precious metals rather than on the wider market. Energy was the one bright spot, gaining more than 1% as U.S. crude rose about 1.7% to $92 a barrel.
Company news added its own casualties. Payroll processor Paychex fell about 8%, shedding roughly $3.4 billion of market value, after first-quarter sales growth slowed as small businesses hired less. McDonald's lost more than 4%, about $8 billion, on the day it laid out a new strategy for investors. Online travel agent Expedia dropped about 7.5%, extending a rout in travel stocks tied to Meta's new Muse assistant, which is designed to renegotiate bookings on users' behalf; Meta itself rose about 2.5%. In China, Alibaba fell more than 4% after Beijing opened a probe into artificial-intelligence data being routed to U.S. models, dragging down other Chinese shares listed in New York and hitting hedge-fund favorites in particular. The question for the afternoon is whether the miners keep falling: with the ten-year above 5%, every uptick in the dollar tests how much of their quarterly gain they hold on to.
The ten-year yield is at 5.042% as of 10:05 AM ET, up 7.5 bps, which puts it above 5% after yesterday's 4.97% CNBC. The front end is moving more: the two-year is up 8.1 bps to 4.858% and the 30-year only 4.5 bps, so the curve is flattening CNBC. The dollar index is up +0.41% to 101.01, within a point of its June 24 high of 101.80 CNBC. Spot gold is at $4,288.69, -1.52% at 10:05 AM ET CNBC.
Higher real rates and a stronger dollar are the classic pressure on bullion, and the equity damage is concentrated in the miners. The Gold factor is down -0.48% at z=-1.47. Almost all of that comes from the most gold-exposed names. Newmont (NEM) is down -4.29%, and Harmony (HMY) is down -5.06%, most of that move explained by its factor exposures. WTI crude is moving the other way, up +1.65% to $92.01 at 9:55 AM ET CNBC. Energy (XLE) is the only large sector fund in the green by more than a percent.
| ETF | Theme | Today | 1d Ago | 5d Ago | 20d Ago | 63d Ago |
|---|---|---|---|---|---|---|
| GDX | gold miners | -4.41% | +3.60% | +3.93% | -5.51% | +25.97% |
| SLV | silver | -3.82% | +1.84% | +5.56% | -2.36% | +8.97% |
| GLD | gold | -1.70% | +0.42% | +1.50% | -6.24% | +6.03% |
| XLU | utilities | -1.46% | -0.32% | -1.19% | -5.53% | -9.41% |
| IWM | small cap | -1.18% | +0.57% | +0.73% | -3.36% | -2.49% |
| TLT | long-term bonds | -0.86% | -0.06% | +1.29% | -0.60% | -4.06% |
| SPY | large cap | -0.47% | -0.02% | +2.36% | +1.55% | +5.69% |
| XLE | energy | +1.37% | -1.09% | -5.72% | -1.51% | +14.13% |
| USO | oil | +2.29% | -2.75% | -10.98% | +8.98% | +29.50% |
The table shows where the miners are in their cycle. GDX had bounced for a week, then gave it all back this morning. It is still down over 20 days and still up +25.97% over the quarter. GDX and SLV are trading at 1.7× and 1.9× their typical session pace, so this is heavier than a routine pullback.
| Bucket | Avg Ret Pct |
|---|---|
| 1 | -1.16 |
| 2 | -1.12 |
| 3 | -0.67 |
| 4 | -0.43 |
| 5 | -0.50 |
| 6 | -0.58 |
| 7 | -0.34 |
| 8 | -0.62 |
| 9 | -0.65 |
| 10 | -0.62 |
| 11 | -0.67 |
| 12 | -0.83 |
| 13 | -0.80 |
| 14 | -0.72 |
| 15 | -0.61 |
| 16 | -0.66 |
| 17 | -0.76 |
| 18 | -1.00 |
| 19 | -1.20 |
| 20 | -2.64 |
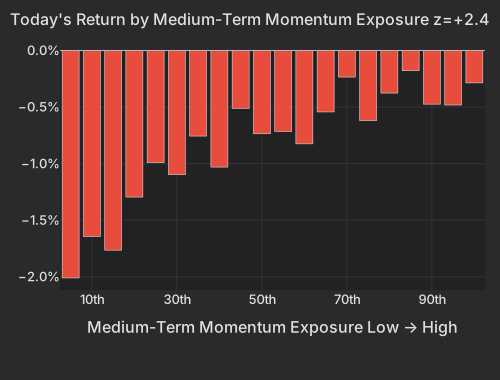
20-day momentum (Medium-Term Momentum in the table) is up +0.67% at z=+2.35. That puts it in the 98.6th percentile since 2020. The factor explains 8.2% of the day's stock-by-stock variance, more than on any day in its trailing year. Both numbers come from the bottom of the ranking. The bucket of past-month losers is down -2.0%, and the top bucket is not rallying.
Metal miners carry that bottom bucket. NovaGold (NG) is down -7.14% and Hycroft (HYMC) -6.81%, and both moves come mostly through their factor exposures, with this factor the biggest single contributor. Ero Copper (ERO) is down -3.60% with almost nothing company-specific in the move. Credo (CRDO), Burlington (BURL) and Dick's (DKS) are also in the losing bucket, so this is not only a mining story. AppLovin (APP) shows how little the winners contributed: it is down -7.03% even though its month-winner exposure added +1.28%.
| Bucket | Avg Ret Pct |
|---|---|
| 1 | -2.01 |
| 2 | -1.64 |
| 3 | -1.76 |
| 4 | -1.30 |
| 5 | -0.99 |
| 6 | -1.10 |
| 7 | -0.76 |
| 8 | -1.03 |
| 9 | -0.51 |
| 10 | -0.74 |
| 11 | -0.72 |
| 12 | -0.83 |
| 13 | -0.54 |
| 14 | -0.23 |
| 15 | -0.62 |
| 16 | -0.38 |
| 17 | -0.18 |
| 18 | -0.47 |
| 19 | -0.48 |
| 20 | -0.29 |
| Factor | Return | Z-Score | 5d Z | 20d Z | 63d Z | Category | Direction |
|---|---|---|---|---|---|---|---|
| Medium-Term Momentum | +0.67% | +2.35 | +0.74 | -0.25 | -0.08 | Style-Momentum | Month's losers fell further |
| Gold | -0.48% | -1.47 | +0.08 | -0.73 | +1.79 | Thematic | Gold-exposed names lagged |
| Short-Sale Activity | +0.14% | +1.33 | +0.69 | +1.40 | +1.25 | Style-Flow | Yesterday's heavily short-sold names outperformed |
| Hedge-Fund Ownership | -0.13% | -1.18 | +0.57 | -1.24 | +0.54 | Style-Positioning | Hedge-fund-owned names lagged |
| Size | +0.31% | +0.87 | +1.05 | +1.78 | +0.73 | Style | Large caps outperformed |
| Short-Term Momentum | +0.25% | +0.82 | +0.52 | -1.36 | -3.41 | Style-Momentum | Last week's movers extended |
| Leverage | -0.10% | -0.59 | -0.75 | -1.30 | -3.31 | Style | Levered names lagged |
| Treasury (Duration) | -0.12% | -0.36 | +0.2 | -1.3 | -0.4 | Thematic | Rate-sensitive names barely moved |
The 5-day horizon points the same way: the 5-day trend factor is up +0.25% at z=+0.82. That runs against the past quarter, when the same factor lost -8.85% over 60 sessions as each week's movers reverted. With both the one-week and one-month horizons extending this morning, today's session is continuing recent moves rather than churning them.
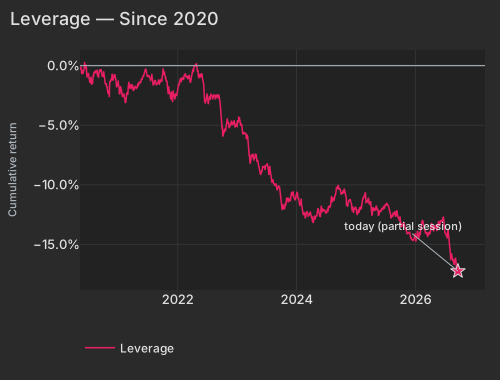
The yield move comes on top of an existing weakness. The Leverage factor has lost -4.28% over the past 60 sessions. Its 63-day z of -3.31 ranks as the worst such stretch since 2020. Today it is down only -0.10% at z=-0.59. Highly levered names are still underperforming but not accelerating, even with the ten-year above 5%.
| Date | Cumret Pct |
|---|---|
| 2020-05-11 | -0.22 |
| 2020-06-03 | -0.34 |
| 2020-06-25 | -0.89 |
| 2020-07-20 | -1.60 |
| 2020-08-11 | -0.51 |
| 2020-09-02 | -0.96 |
| 2020-09-25 | -0.76 |
| 2020-10-19 | -1.51 |
| 2020-11-10 | -1.33 |
| 2020-12-03 | -0.96 |
| 2020-12-28 | -1.74 |
| 2021-01-21 | -2.16 |
| 2021-02-12 | -3.09 |
| 2021-03-09 | -1.66 |
| 2021-03-31 | -1.88 |
| 2021-04-23 | -1.90 |
| 2021-05-17 | -1.47 |
| 2021-06-09 | -0.64 |
| 2021-07-01 | -0.89 |
| 2021-07-26 | -0.87 |
| 2021-08-17 | -1.25 |
| 2021-09-09 | -1.39 |
| 2021-10-01 | -0.65 |
| 2021-10-25 | -1.35 |
| 2021-11-16 | -2.54 |
| 2021-12-09 | -2.44 |
| 2022-01-03 | -2.19 |
| 2022-01-26 | -1.08 |
| 2022-02-17 | -0.64 |
| 2022-03-14 | -0.83 |
| 2022-04-05 | -0.41 |
| 2022-04-28 | 0.05 |
| 2022-05-20 | -0.87 |
| 2022-06-14 | -2.56 |
| 2022-07-08 | -3.24 |
| 2022-08-01 | -2.50 |
| 2022-08-23 | -2.77 |
| 2022-09-15 | -2.68 |
| 2022-10-07 | -5.67 |
| 2022-10-31 | -4.53 |
| 2022-11-22 | -5.05 |
| 2022-12-15 | -4.59 |
| 2023-01-10 | -4.80 |
| 2023-02-02 | -5.38 |
| 2023-02-27 | -5.77 |
| 2023-03-21 | -7.70 |
| 2023-04-13 | -7.83 |
| 2023-05-05 | -7.94 |
| 2023-05-30 | -9.05 |
| 2023-06-22 | -8.61 |
| 2023-07-17 | -9.17 |
| 2023-08-08 | -9.56 |
| 2023-08-30 | -9.95 |
| 2023-09-22 | -10.43 |
| 2023-10-16 | -11.77 |
| 2023-11-07 | -11.26 |
| 2023-11-30 | -11.04 |
| 2023-12-22 | -11.23 |
| 2024-01-18 | -11.44 |
| 2024-02-09 | -12.46 |
| 2024-03-05 | -12.24 |
| 2024-03-27 | -12.26 |
| 2024-04-19 | -12.75 |
| 2024-05-13 | -12.12 |
| 2024-06-05 | -11.90 |
| 2024-06-28 | -12.18 |
| 2024-07-23 | -11.88 |
| 2024-08-14 | -11.06 |
| 2024-09-06 | -10.22 |
| 2024-09-30 | -10.50 |
| 2024-10-22 | -10.50 |
| 2024-11-13 | -11.81 |
| 2024-12-06 | -11.60 |
| 2024-12-31 | -11.84 |
| 2025-01-27 | -11.86 |
| 2025-02-19 | -11.11 |
| 2025-03-13 | -11.44 |
| 2025-04-04 | -11.60 |
| 2025-04-29 | -11.96 |
| 2025-05-21 | -12.52 |
| 2025-06-13 | -11.94 |
| 2025-07-09 | -11.75 |
| 2025-07-31 | -12.23 |
| 2025-08-22 | -12.50 |
| 2025-09-16 | -12.51 |
| 2025-10-08 | -13.51 |
| 2025-10-30 | -13.70 |
| 2025-11-21 | -14.03 |
| 2025-12-16 | -14.57 |
| 2026-01-09 | -14.32 |
| 2026-02-03 | -13.95 |
| 2026-02-26 | -13.63 |
| 2026-03-20 | -14.37 |
| 2026-04-14 | -13.20 |
| 2026-05-06 | -13.45 |
| 2026-05-29 | -13.24 |
| 2026-06-23 | -12.90 |
| 2026-07-16 | -14.21 |
| 2026-08-07 | -15.83 |
| 2026-08-31 | -16.72 |
| 2026-09-23 | -17.24 |
The Treasury (Duration) factor limits how far the rates story goes. It is down just -0.12% at z=-0.36, and its variance share sits in the bottom quarter of its past year. Utilities (XLU) and long bonds (TLT) are lower. But once broad market and style effects are stripped out, rate-sensitive equities are barely moving. So far this morning, the rise in yields is showing up in precious metals and in 20-day momentum, not in equity duration.
Paychex fell after first-quarter sales growth slowed as small-business hiring cooled WSJ. Alkami (ALKT) is down -19.09% after the company said its board ended a strategic review and decided to stay independent. Vertex (VERX) fell -9.97% alongside it. McDonald's (MCD) is down -4.59%, erasing $8.21B, on the day it presented its "NEXT" strategy to investors.
Expedia (EXPE) is down -7.55%, and most of that is company-specific. It extends the selling in travel names tied to Meta's Muse agent, which is built to renegotiate bookings and policies on users' behalf WSJ. Meta (META) is up +2.46%. Alibaba (BABA) is down -4.22% after Beijing opened a probe into AI data being routed to U.S. models. KWEB traded at 2.1× its typical pace. The China slide explains most of Hedge-Fund Ownership's z=-1.18: the most hedge-fund-owned bucket is down -1.5%, weighed down by Chinese ADRs such as Kaspi (KSPI) and Full Truck Alliance (YMM).
The main open question is whether the miners keep falling. Gold-exposed stocks are still up for the quarter (the Gold factor's 63-day z is +1.79), so today's drop is a second leg down in a month-old decline inside a quarter-long advance. With the ten-year above 5%, every dollar gain now tests how much of that quarterly gain the miners keep.
Variance decomposition: live intraday — 20260923 session, bracketed against its trailing-year range. Factor returns are trailing through last close. Total cross-sectional dispersion: 2.8%ile of the past year.
Variance mix — % of total, today vs 1d ago vs 1-yr avg
market 75%ile style 60%ile thematic 70%ile idiosyncratic 32%ile
Variance explained — today vs. factor's trailing-year range
Marker = the factor's share of today's total variance, placed in its own trailing-year range (box 25–75%ile, ticks 90%ile and max). Amber marker = unusually load-bearing today (≥90%ile of its own year). Factor name green = up today / red = down.
Correlation & dispersion — realized vs implied
Pairwise realized correlation (20d): 9.28% 6.9%ile since 2020 · 84%ile 3m
Top-500 pairwise: 10.44% 9.5%ile since 2020 · 60%ile 3m · implied (Cboe COR1M): 7.59 1.2%ile of its own history (gap +2.9pp)
Realized 20d vol (ann. pts): all stocks 39 vs VIXEQ 39 · index 10 vs VIX 14 · style factors 19 67%ile
20-day window (19 completed days + today); percentiles vs model history since 2020; '3m' tokens rank vs the trailing 63 trading days; definitions in Terms below. Implied prints (Cboe) are delayed ~15 min. as of 09:58 ET
Top 50 high-beta momentum names (eq-wt, since-2020 rank): -2.7% 14%ile · rest of market -0.5%
| Factor | Today | 1d | 5d | 20d | 60d |
|---|---|---|---|---|---|
| Style-Risk | |||||
| Residual Volatility | +0.28% z+0.6 | +0.05% | +0.84% | +1.70% | +4.24% |
| Beta | -0.45% z-0.5 | +0.99% | +4.76% | +4.13% | -4.05% |
| International | -0.10% z-0.3 | +0.06% | +0.06% | +0.38% | +1.95% |
| Style | |||||
| Size | +0.31% z+0.9 | -0.25% | +0.83% | +2.79% | +2.38% |
| Profitability | -0.15% z-0.8 | +0.21% | +0.11% | -0.62% | -2.21% |
| Leverage | -0.10% z-0.6 | -0.10% | -0.28% | -0.98% | -4.28% |
| Dividend Yield | +0.07% z+0.4 | -0.11% | +0.20% | +0.19% | -0.08% |
| Value | -0.05% z-0.2 | +0.04% | -0.40% | -0.11% | -0.19% |
| Growth | -0.02% z-0.1 | -0.12% | -0.14% | -0.06% | +1.83% |
| Liquidity | +0.01% z+0.0 | -0.01% | +0.43% | +1.46% | +2.79% |
| Style-Momentum | |||||
| Medium-Term Momentum | +0.67% z+2.4 | -0.53% | +0.48% | -0.32% | -0.98% |
| Short-Term Momentum | +0.25% z+0.8 | +0.22% | +0.35% | -1.85% | -8.85% |
| Long-Term Momentum | +0.18% z+0.3 | +0.17% | +1.01% | +2.77% | -4.67% |
| One-Day Momentum | -0.02% z-0.1 | +0.12% | -0.25% | -2.43% | -2.82% |
| Style-Positioning | |||||
| Hedge-Fund Ownership | -0.13% z-1.2 | +0.07% | +0.14% | -0.61% | +0.20% |
| Short Interest | -0.14% z-0.9 | +0.22% | -0.24% | -1.06% | -1.10% |
| Style-Flow | |||||
| Short-Sale Activity | +0.14% z+1.3 | +0.09% | +0.17% | +0.68% | +1.26% |
| Morning Activity | -0.10% z-0.8 | +0.02% | -0.33% | -0.12% | +2.04% |
| Thematic | |||||
| Gold | -0.48% z-1.5 | +0.28% | +0.06% | -1.06% | +4.94% |
| Oil | +0.43% z+0.9 | -0.09% | +0.21% | +2.24% | +5.94% |
| Bitcoin / Crypto | +0.19% z+0.6 | -0.03% | +0.46% | +1.75% | +2.69% |
| China | -0.26% z-0.6 | +0.06% | +0.25% | +0.37% | +2.05% |
| Semiconductors | +0.22% z+0.4 | +0.00% | +0.81% | +2.53% | -5.26% |
| Treasury (Duration) | -0.12% z-0.4 | +0.59% | +0.17% | -1.85% | -1.09% |
5/20/60d windows include today's session; 1d is the previous session.
Market variance share. The fraction of cross-sectional variance explained by the market factor — the attribution companion to pairwise correlation, not a substitute for it.
Factor z-score. Today's factor return divided by its daily-return standard deviation over ~1,600 trading days.
Data compiled by FactorPulse AI; edited and verified by Jeff Klein. For informational purposes only. Does not constitute financial advice, an investment recommendation, or an offer to buy or sell any securities. Always consult a qualified financial professional before making investment decisions.
For more on factor construction methodology, see www.factorpulse.com/glossary.