Tuesday morning's money went to the market's little guys and its most-doubted names while the giants sat it out. Small-cap stocks rose about 1% and the shares that short-sellers had bet against most heavily climbed roughly 1.5%, an unusually sharp squeeze in a group whose bets against it normally pay off year after year. Notably, the names getting squeezed were sleepy household brands like Kimberly-Clark, Logitech and concert promoter Live Nation rather than speculative high-fliers. The broad market barely moved, up about a tenth of a percent, and the Dow slipped roughly 0.4%, dragged by banks: JPMorgan fell about 2%, shedding nearly $20 billion in value, and brokerage Charles Schwab lost more than 3%, with no obvious news behind either move. Big companies had beaten small ones for five straight sessions before Tuesday broke the streak.
The morning's biggest story was a single stock. Viking Therapeutics, a biotech developing a weight-loss drug, jumped about 32% after reporting that patients on its treatment kept losing weight through week 33 with no sign of leveling off, roughly 22% more than those on placebo. Auto-parts retailer AutoZone gained about 5% after posting results before the bell, adding more than $2 billion in value, and Chinese e-commerce giant Alibaba rose more than 2% after unveiling a homegrown AI chip and a plan to build out a massive amount of data-center capacity by 2032. Beneath the surface, the riskiest stocks have now climbed about 5.5% over five days, one of the biggest such stretches since 2020, and hedge funds, which came into the month with unusually light positions, only began buying in earnest last week, led by technology.
Two soft readings on the regional economy nudged interest rates lower and gave homebuilders a boost. The Philadelphia Fed's gauge of service-sector activity fell far more than expected, and a Richmond Fed manufacturing survey also slipped into negative territory, with both landing about five weeks before the Federal Reserve's October 28 decision. The 10-year Treasury yield eased to just under 4.95%, and rate-sensitive builders rallied, with Lennar's shares up more than 5% after a punishing month. Oil moved the other way: crude slid about 1% to around $95 a barrel, extending a five-session slide, and refiners Valero and Marathon Petroleum fell 3% to 4%. Defense contractors also lost ground.
The most heavily shorted names are outperforming the barely-shorted ones by enough to register at z=+1.2, with that decile up +1.45%. The direction is the interesting part: the most-shorted names underperform in this model more reliably than almost anything else, a drag of about 11% a year, and Short Interest is carrying a larger share of cross-sectional variance today than on ninety percent of days in its own past year. The decile's roster is dull, unlevered stock — Logitech, Kimberly-Clark, T. Rowe Price, Live Nation — so this is not the high-beta trade wearing another label.
| Factor | Return | Z-Score | 5d Z | 20d Z | 63d Z | Category | Direction |
|---|---|---|---|---|---|---|---|
| Short Interest | +0.20% | +1.18 | -0.63 | -1.06 | -0.07 | Style-Positioning | Most-shorted outperformed |
| Liquidity | +0.27% | +0.98 | +0.9 | +1.5 | +0.9 | Style | Easiest-to-trade names led |
| Medium-Term Momentum | -0.27% | -0.93 | -0.5 | -0.7 | +0.0 | Style-Momentum | 20-day winners lagged |
| Size | -0.28% | -0.81 | +0.75 | +1.51 | +0.50 | Style | Larger caps lagged |
| Hedge-Fund Ownership | +0.08% | +0.73 | +0.75 | -0.80 | +0.93 | Style-Positioning | Fund-owned names led |
| Treasury (Duration) | +0.19% | +0.60 | -0.27 | -1.54 | -0.42 | Thematic | Long-duration names bid |
| Beta | +0.50% | +0.52 | +2.54 | +1.21 | -0.54 | Style-Risk | High-beta names led |
| Oil | -0.26% | -0.55 | -1.1 | +0.7 | +1.1 | Thematic | Oil-sensitive names lagged |
Idiosyncratic variance is 81% of the cross-section this morning against a one-year average of 66%, and the leaderboard shows why. Viking Therapeutics is +32.3% on maintenance results for VK2735, which showed roughly 22% placebo-adjusted weight loss at week 33 with no plateau. On Holding is +13.1% and Capri +12.1%; AutoZone added +5.21% after reporting before the open, worth $2.39B of market value. Alibaba's unveiling of a domestic AI chip aimed at 20GW of data-center capacity by 2032 Bloomberg is moving shares +2.35%, with KWEB +0.82% on 2.6× its typical session pace — heavy interest for a small price move.
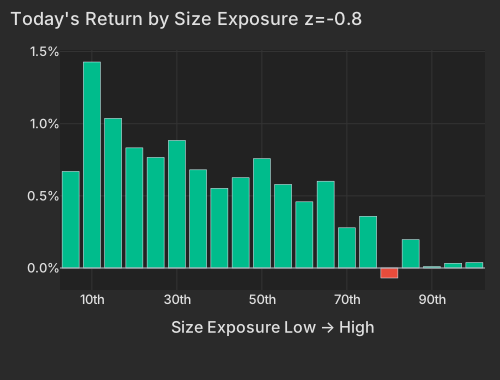
Size has not had a down session in the previous five and is +2.38% over 20 days at z=+1.5; today it is -0.28%. The split is clean at the index level — IWM +1.00% and IJR +0.91% against DIA -0.38%. Financials are the weight: XLF -1.55%, JPMorgan -2.07%, Charles Schwab -3.43% shedding $6.44B, and both bank moves are the stocks' own rather than anything the factor complex did to them. No driver for either sits in today's coverage.
Size is also where the cross-sectional weight actually is: it carries the highest conditional importance of any factor this morning at 11%, while the short-side spread that leads the session carries essentially none. The squeeze is a high-conviction move in a narrow slice of the market, and the reader who runs a large-cap book felt Size, not Short Interest.
| Bucket | Avg Ret Pct |
|---|---|
| 1 | 0.67 |
| 2 | 1.43 |
| 3 | 1.04 |
| 4 | 0.83 |
| 5 | 0.77 |
| 6 | 0.88 |
| 7 | 0.68 |
| 8 | 0.55 |
| 9 | 0.63 |
| 10 | 0.76 |
| 11 | 0.58 |
| 12 | 0.46 |
| 13 | 0.60 |
| 14 | 0.28 |
| 15 | 0.36 |
| 16 | -0.07 |
| 17 | 0.20 |
| 18 | 0.01 |
| 19 | 0.03 |
| 20 | 0.04 |
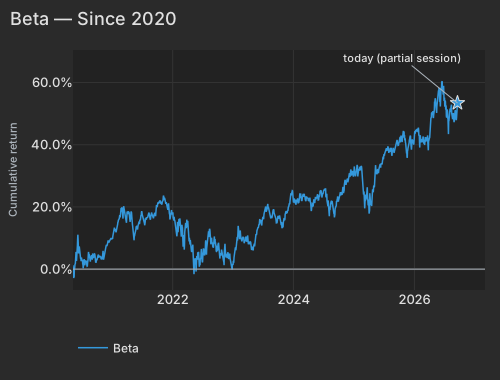
Today's +0.50% in Beta at z=+0.5 is a rounding error next to the week behind it: the completed five-day return through the prior close is +5.50%, the 99.2nd percentile of all five-day windows since 2020 and the most extreme stretch since August 5. The top 50 high-beta momentum names are +1.68% this morning against +0.39% for the rest of the universe, so the leg is extending rather than turning. That is the exposure to watch on a book that added risk last week — the axis has already done most of a year's worth of five-day work.
| Date | Cumret Pct |
|---|---|
| 2020-05-08 | 1.23 |
| 2020-06-02 | 4.20 |
| 2020-06-24 | 3.31 |
| 2020-07-17 | 2.22 |
| 2020-08-10 | 4.47 |
| 2020-09-01 | 3.35 |
| 2020-09-24 | 2.18 |
| 2020-10-16 | 3.96 |
| 2020-11-09 | 4.50 |
| 2020-12-02 | 7.77 |
| 2020-12-24 | 9.67 |
| 2021-01-20 | 12.55 |
| 2021-02-11 | 16.13 |
| 2021-03-08 | 16.24 |
| 2021-03-30 | 16.29 |
| 2021-04-22 | 16.15 |
| 2021-05-14 | 10.79 |
| 2021-06-08 | 14.30 |
| 2021-06-30 | 18.26 |
| 2021-07-23 | 16.01 |
| 2021-08-16 | 17.24 |
| 2021-09-08 | 16.33 |
| 2021-09-30 | 19.94 |
| 2021-10-22 | 21.01 |
| 2021-11-15 | 22.69 |
| 2021-12-08 | 21.15 |
| 2021-12-31 | 17.53 |
| 2022-01-25 | 12.11 |
| 2022-02-16 | 15.68 |
| 2022-03-11 | 8.21 |
| 2022-04-04 | 15.50 |
| 2022-04-27 | 5.50 |
| 2022-05-19 | 3.52 |
| 2022-06-13 | 0.76 |
| 2022-07-07 | 6.46 |
| 2022-07-29 | 7.58 |
| 2022-08-22 | 7.99 |
| 2022-09-14 | 9.57 |
| 2022-10-06 | 8.50 |
| 2022-10-28 | 5.32 |
| 2022-11-21 | 3.76 |
| 2022-12-14 | 4.78 |
| 2023-01-09 | 3.73 |
| 2023-02-01 | 11.57 |
| 2023-02-24 | 8.93 |
| 2023-03-20 | 9.15 |
| 2023-04-12 | 7.99 |
| 2023-05-04 | 6.02 |
| 2023-05-26 | 12.34 |
| 2023-06-21 | 14.80 |
| 2023-07-14 | 18.59 |
| 2023-08-07 | 19.50 |
| 2023-08-29 | 18.00 |
| 2023-09-21 | 14.87 |
| 2023-10-13 | 15.65 |
| 2023-11-06 | 15.54 |
| 2023-11-29 | 19.50 |
| 2023-12-21 | 24.53 |
| 2024-01-17 | 20.78 |
| 2024-02-08 | 22.96 |
| 2024-03-04 | 24.04 |
| 2024-03-26 | 22.87 |
| 2024-04-18 | 20.25 |
| 2024-05-10 | 21.25 |
| 2024-06-04 | 22.29 |
| 2024-06-27 | 24.25 |
| 2024-07-22 | 23.99 |
| 2024-08-13 | 20.20 |
| 2024-09-05 | 17.94 |
| 2024-09-27 | 23.08 |
| 2024-10-21 | 24.75 |
| 2024-11-12 | 28.45 |
| 2024-12-05 | 29.73 |
| 2024-12-30 | 30.46 |
| 2025-01-24 | 32.97 |
| 2025-02-18 | 33.00 |
| 2025-03-12 | 23.11 |
| 2025-04-03 | 18.50 |
| 2025-04-28 | 25.56 |
| 2025-05-20 | 31.23 |
| 2025-06-12 | 33.27 |
| 2025-07-08 | 37.04 |
| 2025-07-30 | 38.96 |
| 2025-08-21 | 36.44 |
| 2025-09-15 | 39.92 |
| 2025-10-07 | 41.34 |
| 2025-10-29 | 44.46 |
| 2025-11-20 | 35.82 |
| 2025-12-15 | 39.64 |
| 2026-01-08 | 43.10 |
| 2026-02-02 | 43.14 |
| 2026-02-25 | 42.65 |
| 2026-03-19 | 42.39 |
| 2026-04-13 | 47.06 |
| 2026-05-05 | 51.14 |
| 2026-05-28 | 57.05 |
| 2026-06-22 | 60.41 |
| 2026-07-15 | 52.22 |
| 2026-08-06 | 50.61 |
| 2026-08-28 | 48.42 |
| 2026-09-22 | 53.42 |
The positioning prints sequence the same way. Prime-brokerage data for the covered session ending September 18 put net leverage for US long/short equity funds at 51%, the 6th percentile of its annual range, with gross exposure still coming down; a separate prime-brokerage read covering the September 21 session described the largest net buying in five weeks, led by technology. Read in order, the re-risking is days old, not weeks.
The curve slipped after the Philadelphia Fed's service-sector miss, with the 10-year at 4.951%, down 1.2 bps, and the 2-year at 4.738%, down 1.5 bps CNBC. Treasury (Duration) paid +0.19% at z=+0.6 after bleeding -2.22% over the past month, and the longest-duration names took the whole of it. Homebuilders are the expression: ITB +2.50% on 2.9× its typical session pace, Lennar's B shares +5.40%, six sessions after the September 16 hike and against a 20-day drop of -8.76%.
Crude is the other side. WTI is $94.80 as of 9:50 AM ET, down -1.02% CNBC, and USO is -1.59%, extending a five-session slide of -5.43% that has barely dented a 63-day gain of +31.48%. Valero is -4.31% and Marathon Petroleum -3.41%, both marked down on their own rather than through the Oil factor, which is only -0.26% at z=-0.6. The defense names went with them — ITA -1.58%, XAR -1.37%.
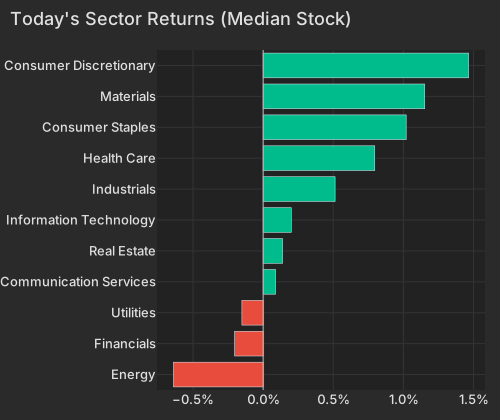
| Sector | Median Ret Pct |
|---|---|
| Energy | -0.64 |
| Financials | -0.20 |
| Utilities | -0.15 |
| Communication Services | 0.09 |
| Real Estate | 0.14 |
| Information Technology | 0.20 |
| Industrials | 0.51 |
| Health Care | 0.80 |
| Consumer Staples | 1.02 |
| Materials | 1.15 |
| Consumer Discretionary | 1.47 |
The Philadelphia Fed Non-Manufacturing Survey, released at 8:30 AM ET, showed the regional activity index at -22.0 against a consensus of -8.7 and August's -10.6 — the service-sector contraction deepening rather than stabilising, and the print behind this morning's modest bid for duration.
The Richmond Fed Survey of Manufacturing Activity, released at 10:00 AM ET, fell to -2 from 4, with shipments at -5 and new orders at -6 while employment rose to 7 and prices paid ticked up to 7.08. Two contracting regional surveys in one morning land 36 days before the FOMC federalreserve.gov's October 28 decision.
Variance decomposition: live intraday — 20260922 session, bracketed against its trailing-year range. Factor returns are trailing through last close. Total cross-sectional dispersion: 2.4%ile of the past year.
Variance mix — % of total, today vs 1d ago vs 1-yr avg
market 45%ile style 36%ile thematic 25%ile idiosyncratic 77%ile
Variance explained — today vs. factor's trailing-year range
Marker = the factor's share of today's total variance, placed in its own trailing-year range (box 25–75%ile, ticks 90%ile and max). Amber marker = unusually load-bearing today (≥90%ile of its own year). Factor name green = up today / red = down.
Correlation & dispersion — realized vs implied
Pairwise realized correlation (20d): 9.19% 6.7%ile since 2020 · 82%ile 3m
Top-500 pairwise: 10.72% 9.9%ile since 2020 · 65%ile 3m · implied (Cboe COR1M): 8.17 1.8%ile of its own history (gap +2.5pp)
Realized 20d vol (ann. pts): all stocks 38 vs VIXEQ 39 · index 10 vs VIX 15 · style factors 19 67%ile
20-day window (19 completed days + today); percentiles vs model history since 2020; '3m' tokens rank vs the trailing 63 trading days; definitions in Terms below. Implied prints (Cboe) are delayed ~15 min. as of 09:58 ET
Top 50 high-beta momentum names (eq-wt, since-2020 rank): +1.7% 72%ile · rest of market +0.4%
| Factor | Today | 1d | 5d | 20d | 60d |
|---|---|---|---|---|---|
| Style-Risk | |||||
| Beta | +0.50% z+0.5 | +1.74% | +5.50% | +5.23% | -2.72% |
| International | -0.12% z-0.4 | +0.01% | -0.18% | +0.55% | +1.90% |
| Residual Volatility | -0.04% z-0.1 | +0.31% | +0.61% | +1.49% | +4.67% |
| Style | |||||
| Liquidity | +0.27% z+1.0 | +0.01% | +0.57% | +1.79% | +2.91% |
| Dividend Yield | -0.16% z-0.9 | -0.19% | -0.13% | +0.07% | -0.19% |
| Size | -0.28% z-0.8 | +0.33% | +0.59% | +2.38% | +2.68% |
| Profitability | +0.10% z+0.5 | -0.13% | +0.32% | -0.78% | -2.23% |
| Value | +0.10% z+0.4 | -0.25% | -0.44% | -0.27% | -0.62% |
| Growth | -0.04% z-0.2 | +0.13% | +0.11% | -0.08% | +1.91% |
| Leverage | +0.01% z+0.0 | +0.03% | +0.17% | -0.65% | -4.12% |
| Style-Momentum | |||||
| Medium-Term Momentum | -0.27% z-0.9 | +0.07% | -0.33% | -0.88% | -1.33% |
| Long-Term Momentum | +0.14% z+0.2 | -0.19% | +1.04% | +2.58% | -3.94% |
| One-Day Momentum | -0.04% z-0.2 | -0.19% | -0.61% | -2.54% | -2.62% |
| Short-Term Momentum | -0.00% z-0.0 | +0.45% | -0.47% | -2.06% | -9.21% |
| Style-Positioning | |||||
| Short Interest | +0.20% z+1.2 | +0.07% | -0.23% | -0.79% | -0.81% |
| Hedge-Fund Ownership | +0.08% z+0.7 | +0.14% | +0.18% | -0.39% | +0.31% |
| Style-Flow | |||||
| Morning Activity | -0.04% z-0.3 | -0.21% | -0.30% | -0.07% | +2.18% |
| Short-Sale Activity | -0.01% z-0.1 | -0.10% | -0.20% | +0.36% | +1.17% |
| Thematic | |||||
| Treasury (Duration) | +0.19% z+0.6 | -0.24% | -0.19% | -2.22% | -1.70% |
| Oil | -0.26% z-0.6 | -0.46% | -1.17% | +1.50% | +5.90% |
| Bitcoin / Crypto | -0.12% z-0.4 | +0.01% | -0.13% | +1.52% | +2.36% |
| China | +0.16% z+0.4 | +0.20% | +0.62% | +0.62% | +2.16% |
| Gold | +0.07% z+0.2 | -0.36% | +0.19% | -0.17% | +4.93% |
| Semiconductors | -0.03% z-0.1 | -0.40% | +0.97% | +2.12% | -5.23% |
5/20/60d windows include today's session; 1d is the previous session.
Market variance share. The fraction of cross-sectional variance explained by the market factor — the attribution companion to pairwise correlation, not a substitute for it.
Factor z-score. Today's factor return divided by its daily-return standard deviation over ~1,600 trading days.
Conditional importance. A factor's relative share of what a tree-based fit of today's stock returns explains; sums to 100% across factors.
High-beta momentum cohort. US names above $2B market cap in the top quintile of both raw beta and 12-month momentum; membership frozen at each month's first business day. “Top 50” = the 50 strongest by combined rank.
Stock-specific (idiosyncratic) return. The part of a stock's move not explained by market, style, or thematic factors in our decomposition.
Data compiled by FactorPulse AI; edited and verified by Jeff Klein. For informational purposes only. Does not constitute financial advice, an investment recommendation, or an offer to buy or sell any securities. Always consult a qualified financial professional before making investment decisions.
For more on factor construction methodology, see www.factorpulse.com/glossary.