Meta's new personal AI agent, Muse, sorted Tuesday's market, and the losers were the companies that make money when customers don't bother to switch. The app has hit No. 1 on the U.S. App Store with more than 2.5 million downloads in two weeks, and it promises to move idle cash into higher-yielding accounts and shop around for cheaper insurance. Investors took that as a direct threat to the cheap deposits behind brokerage profits and to insurers' sticky policyholders: brokerage giant Charles Schwab fell nearly 6%, its worst day since April, and insurer Allstate dropped about 5.5%, with the hit landing on top of an estimated $1.4 billion in summer storm losses. JPMorgan and Bank of America each lost around 3%, Progressive, Expedia and Booking fell on the same worry, and Amazon has already blocked Muse from shopping on its site. Financial stocks as a group slid 2% on more than twice their normal volume while the S&P 500 finished flat. A Goldman Sachs desk note summed up the fear: businesses built on customer inertia face lasting pressure once software starts renegotiating fees on people's behalf.
The other big story was a rally in stocks that usually need falling interest rates, even though rates didn't fall. Homebuilders jumped 3%, gold miners about 3.5% and biotech roughly 2%, with drugmaker Merck among the leaders, yet the 10-year Treasury yield barely budged and stayed just under 5%. All three groups had been beaten down over the prior month, so part of this was simply last month's laggards catching a bid. One plausible trigger was a weak morning reading from the Philadelphia Fed's services survey, which plunged to -22 against expectations of about -9, a sign the regional economy is contracting faster than thought. Elsewhere, crude oil fell for a fifth straight day after Iran signaled it could reopen the Strait of Hormuz within a week, dragging refiner Valero down about 4%.
Monday's AI-hardware rally ran into a second day. Memory-chip maker Micron gained about 5%, and the riskiest, most market-sensitive names once again led while the safe, boring ones lagged; Allstate's defensive profile alone would have cost it about a point even without the Muse news. Goldman Sachs reported that hedge funds were the biggest net buyers of U.S. stocks in five weeks through last Friday, led by tech and media longs, though their overall leverage remains near the low end of the past year. The mood was calm at the index level but jumpy underneath: the VIX slipped to about 14, roughly 20% below its early-September high, even as expected swings in individual stocks sat at the top of their recent range. That combination, a quiet market with big moves in single names, is exactly what a disruption story like Muse looks like when it hits the tape.
Muse, Meta's personal AI agent, has reached No. 1 on the U.S. App Store with more than 2.5 million downloads in two weeks. FT The tool finds higher-yielding options and moves uninvested cash automatically. That goes straight at the cheap deposits behind brokerage interest income. Bloomberg Schwab closed the regular session down -6.09%. Dow Jones data had flagged it intraday as the stock's worst day since April, as Morningstar reported.
Allstate fell -5.56% as fears of automated insurance shopping landed on top of an estimated $1.43B in July–August catastrophe losses. Among the big banks, JPMorgan Chase (JPM) lost -3.37% and Bank of America (BAC) -2.90%. Progressive, Expedia and Booking Holdings fell on the same fear, and Amazon has already blocked Muse from shopping on Amazon.com. FT A Goldman Sachs desk note warned that businesses built on customer inertia and recurring billing face lasting pressure once software starts renegotiating fees on customers' behalf. FT
Investors were selling in size: XLF traded at 2.4× its typical session pace, the heaviest relative volume of any broad sector fund. Financials were already weak before Muse, with XLF down over both the prior week and the prior month. Monday's rally in Meta and AI hardware has now become a sell-off in the companies that earn money from customers standing still.
| Factor | Return | Z-Score | 5d Z | 20d Z | 63d Z | Category | Direction |
|---|---|---|---|---|---|---|---|
| Treasury (Duration) | +0.60% | +1.85 | +0.29 | -1.26 | -0.26 | Thematic | Rate-sensitive names outperformed |
| Medium-Term Momentum | -0.53% | -1.85 | -0.93 | -0.90 | -0.07 | Style-Momentum | Last month's losers beat its winners |
| Short Interest | +0.22% | +1.32 | -0.56 | -1.03 | -0.06 | Style-Positioning | Most-shorted names outperformed |
| Beta | +0.94% | +0.97 | +2.75 | +1.31 | -0.49 | Style-Risk | High-beta names outperformed |
| Gold | +0.28% | +0.87 | +0.56 | +0.03 | +1.68 | Thematic | Gold-exposed names outperformed |
| Short-Term Momentum | +0.17% | +0.57 | -0.42 | -1.38 | -3.32 | Style-Momentum | Last week's winners held on |
| Hedge-Fund Ownership | +0.06% | +0.53 | +0.66 | -0.84 | +0.90 | Style-Positioning | Flat |
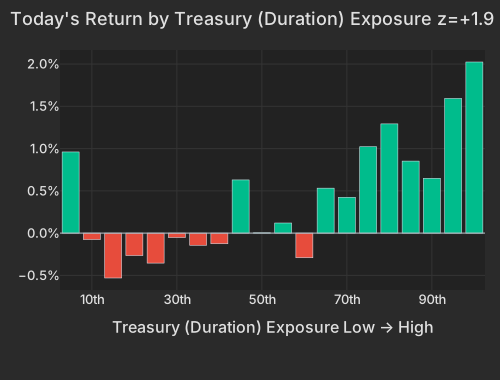
Treasury (Duration) returned +0.60% at z=+1.85, a return in the 99.4th percentile since 2020. It was the session's strongest factor signal. The gains came from the most rate-sensitive stocks, with biotech names such as Veracyte (VCYT) and Merck (MRK) among the leaders. The bond market barely moved: the 10-year yield eased 0.8 basis points to 4.955%. CNBC Stock investors bought rate-sensitive groups that the Treasury market did not back. One possible explanation is the Philadelphia Fed's services index, which plunged to -22.0, far below expectations (see Economic Context).
| Bucket | Avg Ret Pct |
|---|---|
| 1 | 0.96 |
| 2 | -0.08 |
| 3 | -0.53 |
| 4 | -0.27 |
| 5 | -0.35 |
| 6 | -0.05 |
| 7 | -0.14 |
| 8 | -0.13 |
| 9 | 0.63 |
| 10 | 0.00 |
| 11 | 0.12 |
| 12 | -0.29 |
| 13 | 0.53 |
| 14 | 0.42 |
| 15 | 1.02 |
| 16 | 1.29 |
| 17 | 0.85 |
| 18 | 0.65 |
| 19 | 1.59 |
| 20 | 2.02 |
The same groups were last month's losers. 20-day momentum (Medium-Term Momentum in the table) fell -0.53% at z=-1.85, a 3.9th-percentile day since 2020, as the past month's worst performers beat its best. Homebuilders, gold miners and biotech all came into the session down over the prior 20 days, and all rallied. Financials were the exception, falling further on Muse.
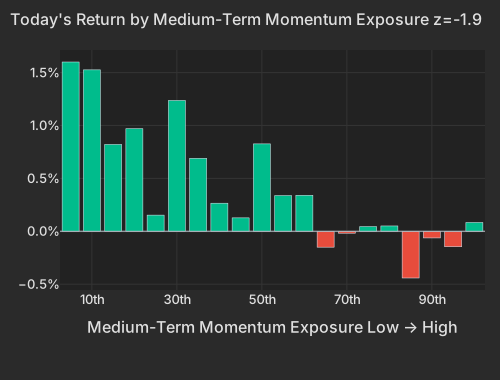
| Bucket | Avg Ret Pct |
|---|---|
| 1 | 1.60 |
| 2 | 1.53 |
| 3 | 0.82 |
| 4 | 0.97 |
| 5 | 0.15 |
| 6 | 1.24 |
| 7 | 0.69 |
| 8 | 0.27 |
| 9 | 0.13 |
| 10 | 0.83 |
| 11 | 0.34 |
| 12 | 0.34 |
| 13 | -0.15 |
| 14 | -0.02 |
| 15 | 0.04 |
| 16 | 0.05 |
| 17 | -0.44 |
| 18 | -0.06 |
| 19 | -0.15 |
| 20 | 0.08 |
| ETF | Theme | Today | 1d Ago | 5d Ago | 20d Ago | 63d Ago |
|---|---|---|---|---|---|---|
| GDX | gold miners | +3.65% | -1.10% | +0.31% | -8.17% | +15.95% |
| DRAM | memory chips | +3.36% | +3.30% | +12.37% | +6.76% | -23.71% |
| ITB | homebuilders | +3.17% | +0.90% | -1.23% | -8.76% | -8.62% |
| XBI | biotech | +2.30% | +0.96% | +0.40% | -4.53% | +8.48% |
| SMH | semiconductors | +1.93% | +4.02% | +10.07% | +6.35% | -10.90% |
| QQQ | large-cap growth | +0.79% | +2.88% | +4.66% | +4.03% | +0.58% |
| SPY | large cap | 0.00% | +1.55% | +1.91% | +1.27% | +4.17% |
| KRE | regional banks | -1.09% | -0.48% | -2.30% | -3.28% | +0.57% |
| XLF | financials | -1.98% | +0.42% | -1.64% | -2.41% | +4.46% |
| USO | oil | -2.71% | -3.68% | -5.43% | +10.04% | +31.48% |
Crude fell for a fifth straight session after Iran signaled it could reopen the Strait of Hormuz within seven days. Bloomberg The Oil factor was flat at -0.05%. Valero (VLO) closed -4.18%, leading the refiners lower.
Beta added +0.94% (z=+0.97), taking its 5-day gain to +5.95% as Monday's rally in AI hardware ran into a second session. Micron (MU) closed up +4.95%, and its style tilts, mostly beta, account for +1.94% of that. The most market-sensitive bucket gained +2.15%, led by AI and data-center names. Allstate was on the losing side of the same factor: its low beta alone cost it -1.12%. The high-beta momentum cohort rose +2.49%, while the rest of the universe gained +0.11%.
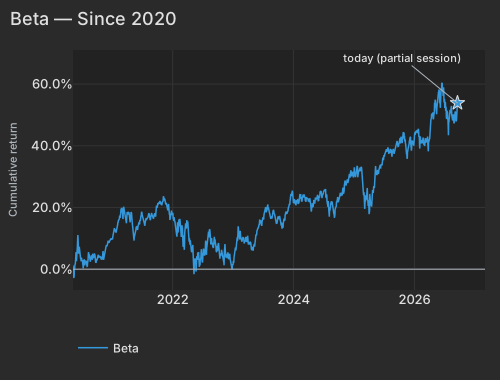
| Date | Cumret Pct |
|---|---|
| 2020-05-08 | 1.23 |
| 2020-06-02 | 4.20 |
| 2020-06-24 | 3.31 |
| 2020-07-17 | 2.22 |
| 2020-08-10 | 4.47 |
| 2020-09-01 | 3.35 |
| 2020-09-24 | 2.18 |
| 2020-10-16 | 3.96 |
| 2020-11-09 | 4.50 |
| 2020-12-02 | 7.77 |
| 2020-12-24 | 9.67 |
| 2021-01-20 | 12.55 |
| 2021-02-11 | 16.13 |
| 2021-03-08 | 16.24 |
| 2021-03-30 | 16.29 |
| 2021-04-22 | 16.15 |
| 2021-05-14 | 10.79 |
| 2021-06-08 | 14.30 |
| 2021-06-30 | 18.26 |
| 2021-07-23 | 16.01 |
| 2021-08-16 | 17.24 |
| 2021-09-08 | 16.33 |
| 2021-09-30 | 19.94 |
| 2021-10-22 | 21.01 |
| 2021-11-15 | 22.69 |
| 2021-12-08 | 21.15 |
| 2021-12-31 | 17.53 |
| 2022-01-25 | 12.11 |
| 2022-02-16 | 15.68 |
| 2022-03-11 | 8.21 |
| 2022-04-04 | 15.50 |
| 2022-04-27 | 5.50 |
| 2022-05-19 | 3.52 |
| 2022-06-13 | 0.76 |
| 2022-07-07 | 6.46 |
| 2022-07-29 | 7.58 |
| 2022-08-22 | 7.99 |
| 2022-09-14 | 9.57 |
| 2022-10-06 | 8.50 |
| 2022-10-28 | 5.32 |
| 2022-11-21 | 3.76 |
| 2022-12-14 | 4.78 |
| 2023-01-09 | 3.73 |
| 2023-02-01 | 11.57 |
| 2023-02-24 | 8.93 |
| 2023-03-20 | 9.15 |
| 2023-04-12 | 7.99 |
| 2023-05-04 | 6.02 |
| 2023-05-26 | 12.34 |
| 2023-06-21 | 14.80 |
| 2023-07-14 | 18.59 |
| 2023-08-07 | 19.50 |
| 2023-08-29 | 18.00 |
| 2023-09-21 | 14.87 |
| 2023-10-13 | 15.65 |
| 2023-11-06 | 15.54 |
| 2023-11-29 | 19.50 |
| 2023-12-21 | 24.53 |
| 2024-01-17 | 20.78 |
| 2024-02-08 | 22.96 |
| 2024-03-04 | 24.04 |
| 2024-03-26 | 22.87 |
| 2024-04-18 | 20.25 |
| 2024-05-10 | 21.25 |
| 2024-06-04 | 22.29 |
| 2024-06-27 | 24.25 |
| 2024-07-22 | 23.99 |
| 2024-08-13 | 20.20 |
| 2024-09-05 | 17.94 |
| 2024-09-27 | 23.08 |
| 2024-10-21 | 24.75 |
| 2024-11-12 | 28.45 |
| 2024-12-05 | 29.73 |
| 2024-12-30 | 30.46 |
| 2025-01-24 | 32.97 |
| 2025-02-18 | 33.00 |
| 2025-03-12 | 23.11 |
| 2025-04-03 | 18.50 |
| 2025-04-28 | 25.56 |
| 2025-05-20 | 31.23 |
| 2025-06-12 | 33.27 |
| 2025-07-08 | 37.04 |
| 2025-07-30 | 38.96 |
| 2025-08-21 | 36.44 |
| 2025-09-15 | 39.92 |
| 2025-10-07 | 41.34 |
| 2025-10-29 | 44.46 |
| 2025-11-20 | 35.82 |
| 2025-12-15 | 39.64 |
| 2026-01-08 | 43.10 |
| 2026-02-02 | 43.14 |
| 2026-02-25 | 42.65 |
| 2026-03-19 | 42.39 |
| 2026-04-13 | 47.06 |
| 2026-05-05 | 51.14 |
| 2026-05-28 | 57.05 |
| 2026-06-22 | 60.41 |
| 2026-07-15 | 52.22 |
| 2026-08-06 | 50.61 |
| 2026-08-28 | 48.42 |
| 2026-09-22 | 53.86 |
The quarter-long habit of last week's winners giving back took a day off. Short-Term Momentum, the 5-day reversion gauge, rose +0.17%. On the 63-day window it still sits at z=-3.3. One session does little to change a quarter-long pattern.
Goldman Sachs Prime Brokerage reported that in the week ending September 18, hedge funds were the biggest net buyers of U.S. stocks in five weeks, led by TMT longs. The same data put net leverage at 49.9%, the 7th percentile of its one-year range. Hedge-Fund Ownership was flat today, at +0.06% after adjusting for other factors and +0.03% on a raw basis. Hedge-fund-owned names neither led nor lagged during the Muse sell-off.
The Cboe VIX, which tracks implied index volatility, slipped to 14.23, 20% below its September 10 high of 17.84. Implied single-stock volatility (Cboe VIXEQ) was 39.01, the top of its 20-session range. The index is calm while individual stocks move on their own news, which is how a disruption story like Muse shows up in the options market.
Short Interest returned +0.22% at z=+1.32, so the most-shorted names beat the rest, the opposite of this factor's usual drag. The most-shorted bucket gained +1.49%, with Logitech (LOGI), Kimberly-Clark (KMB) and T. Rowe Price (TROW) among its leaders. Thor Industries (THO) is heavily shorted. It closed up +6.14% despite fiscal 2027 guidance well below consensus. WSJ It then added +1.88% in late trading.
Viking Therapeutics (VKTX) closed the session up +35.69%, and Vicor (VICR) rose +19.59%. Almost all of each move was stock-specific, and neither driver is yet in sourced coverage. Grab (GRAB) rose +8.76% after CEO Anthony Tan bought $29.9 million of stock. STRAITSTIMES
The Philadelphia Fed Non-Manufacturing Survey, released at 8:30 AM ET, fell to -22.0 from August's -10.6. Consensus was -8.7, so services activity in the region is contracting faster than expected, and Treasury yields softened slightly afterward.
The Richmond Fed Survey of Manufacturing Activity, released at 10:00 AM ET, slipped to -2 from 4. Shipments and new orders turned negative while the prices-paid index rose, and the market barely reacted.
Variance decomposition: live intraday — 20260922 session, bracketed against its trailing-year range. Factor returns are trailing through last close. Total cross-sectional dispersion: 24%ile of the past year.
Variance mix — % of total, today vs 1d ago vs 1-yr avg
market 24%ile style 47%ile thematic 70%ile idiosyncratic 74%ile
Variance explained — today vs. factor's trailing-year range
Marker = the factor's share of today's total variance, placed in its own trailing-year range (box 25–75%ile, ticks 90%ile and max). Amber marker = unusually load-bearing today (≥90%ile of its own year). Factor name green = up today / red = down.
Correlation & dispersion — realized vs implied
Pairwise realized correlation (20d): 8.83% 5.9%ile since 2020 · 76%ile 3m
Top-500 pairwise: 10.24% 8.9%ile since 2020 · 57%ile 3m · implied (Cboe COR1M): 7.60 1.2%ile of its own history (gap +2.6pp)
Realized 20d vol (ann. pts): all stocks 39 vs VIXEQ 39 · index 10 vs VIX 14 · style factors 19 68%ile
20-day window (19 completed days + today); percentiles vs model history since 2020; '3m' tokens rank vs the trailing 63 trading days; definitions in Terms below. Implied prints (Cboe) are delayed ~15 min. as of 15:58 ET
High-beta momentum cohort (eq-wt, since-2020 rank): +2.5% 87%ile · rest of market +0.1%
| Factor | Today | 1d | 5d | 20d | 60d |
|---|---|---|---|---|---|
| Style-Risk | |||||
| Beta | +0.94% z+1.0 | +1.74% | +5.95% | +5.67% | -2.27% |
| International | +0.06% z+0.2 | +0.01% | +0.00% | +0.73% | +2.09% |
| Residual Volatility | +0.03% z+0.1 | +0.31% | +0.69% | +1.57% | +4.75% |
| Style | |||||
| Profitability | +0.17% z+0.9 | -0.13% | +0.39% | -0.71% | -2.17% |
| Size | -0.28% z-0.8 | +0.33% | +0.60% | +2.38% | +2.69% |
| Dividend Yield | -0.09% z-0.5 | -0.19% | -0.06% | +0.14% | -0.12% |
| Growth | -0.12% z-0.5 | +0.13% | +0.04% | -0.16% | +1.83% |
| Leverage | -0.08% z-0.5 | +0.03% | +0.09% | -0.73% | -4.21% |
| Value | +0.05% z+0.2 | -0.25% | -0.49% | -0.32% | -0.67% |
| Liquidity | +0.01% z+0.0 | +0.01% | +0.31% | +1.53% | +2.65% |
| Style-Momentum | |||||
| Medium-Term Momentum | -0.53% z-1.9 | +0.07% | -0.60% | -1.14% | -1.59% |
| Short-Term Momentum | +0.17% z+0.6 | +0.45% | -0.29% | -1.88% | -9.03% |
| One-Day Momentum | +0.08% z+0.3 | -0.19% | -0.48% | -2.41% | -2.50% |
| Long-Term Momentum | +0.12% z+0.2 | -0.19% | +1.03% | +2.56% | -3.96% |
| Style-Positioning | |||||
| Short Interest | +0.22% z+1.3 | +0.07% | -0.21% | -0.77% | -0.78% |
| Hedge-Fund Ownership | +0.06% z+0.5 | +0.14% | +0.16% | -0.41% | +0.29% |
| Style-Flow | |||||
| Short-Sale Activity | +0.09% z+0.8 | -0.10% | -0.09% | +0.47% | +1.28% |
| Morning Activity | +0.04% z+0.3 | -0.21% | -0.22% | +0.01% | +2.25% |
| Thematic | |||||
| Treasury (Duration) | +0.60% z+1.9 | -0.24% | +0.21% | -1.82% | -1.30% |
| Gold | +0.28% z+0.9 | -0.36% | +0.41% | +0.05% | +5.15% |
| Bitcoin / Crypto | -0.06% z-0.2 | +0.01% | -0.07% | +1.58% | +2.42% |
| China | +0.06% z+0.1 | +0.20% | +0.52% | +0.52% | +2.06% |
| Oil | -0.05% z-0.1 | -0.46% | -0.96% | +1.71% | +6.11% |
| Semiconductors | -0.03% z-0.1 | -0.40% | +0.97% | +2.12% | -5.23% |
5/20/60d windows include today's session; 1d is the previous session.
Factor z-score. Today's factor return divided by its daily-return standard deviation over ~1,600 trading days.
High-beta momentum cohort. US names above $2B market cap in the top quintile of both raw beta and 12-month momentum; membership frozen at each month's first business day. “Top 50” = the 50 strongest by combined rank.
Stock-specific (idiosyncratic) return. The part of a stock's move not explained by market, style, or thematic factors in our decomposition.
VIXEQ / DSPX / COR1M. Cboe implied indices: single-stock volatility, dispersion, and 1-month implied correlation (top-50 S&P names). Quotes delayed ~15 minutes.
Data compiled by FactorPulse AI; edited and verified by Jeff Klein. For informational purposes only. Does not constitute financial advice, an investment recommendation, or an offer to buy or sell any securities. Always consult a qualified financial professional before making investment decisions.
For more on factor construction methodology, see www.factorpulse.com/glossary.