Meta's launch of an AI assistant called Muse, which shot to the top of the app-store charts, and a fourth straight drop in oil prices gave investors two reasons to buy risk on Monday, and they piled into the market's most volatile names. Meta surged about 12%, adding roughly $190 billion in market value, while the S&P 500 gained about 1.5% and the Nasdaq-heavy growth stocks rose closer to 3%. The clearest winners were stocks that tend to swing hardest in either direction: the most volatile slice of the market climbed nearly 5%, more than three times the broad index. Chipmakers rode the wave, with Intel up about 12%, AMD up roughly 10% and Arm up about 17%, though even the analysts who track these things noted the chip rally looked more like a general appetite for risk than a bet on semiconductors specifically. Accenture and Anthropic added to the AI drumbeat with a safety partnership announcement.
The other half of the story was relief on costs. U.S. crude fell nearly 5% to about $96 a barrel as tensions in the Middle East eased, dragging energy stocks down about 2% with Exxon off roughly 3%; oil is still up more than 20% over the past three months, so this is a pullback rather than a reversal. Longer-term Treasury yields eased a bit, with the 10-year at about 4.95%, taking some pressure off expensive growth stocks that had been held back for a month. Not everything joined in: the St. Louis Fed's Alberto Musalem said more rate increases are likely needed to get inflation back to 2%, and traders now see Wednesday's Fed meeting as a live one. Gold slipped, while Bitcoin jumped nearly 7% to about $87,000, its highest since January. Goldman Sachs' prime brokerage reported that hedge funds did their heaviest buying of U.S. stocks in five weeks last week, with borrowing levels still near the low end of the past year, a sign the buying may have room to run.
Among individual companies, cancer-screening firm GRAIL soared about 34% after the FDA approved its Galleri blood test, which also unlocks a $250 million payment from gene-sequencing company Illumina. Warner Bros. Discovery gained about 11% as Paramount discussed a $1.5 billion California production commitment to clear its Skydance merger. Diabetes and weight-loss drugmaker Novo Nordisk fell about 8% after its 2030 sales targets disappointed investors. Defense names such as AeroVironment also bounced after a rough month. The question hanging over a market that just bet heavily on its riskiest stocks is whether the Fed on Wednesday will leave long-term rates where falling oil just put them.
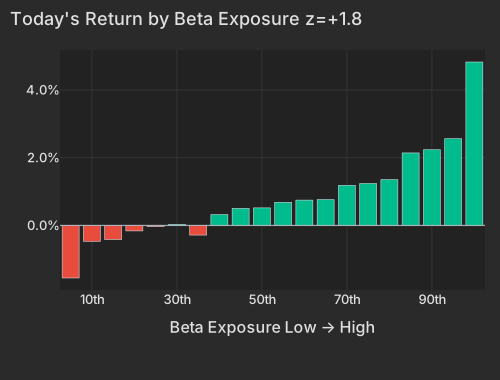
Meta closed the regular session up +11.65% after its Muse AI agent topped the app-store charts.Bloomberg The bid it set off sorted the market almost entirely by market sensitivity: the top Beta bucket ran +4.83% while SPY managed +1.49%. Behind it, WTI's slide to $95.55CNBC and a 4.5 bp drop in the ten-year Treasury yield removed two of the constraints that had been capping high-multiple names for a month. Beta carried 23.6% of cross-sectional variance today and the style block took 28.1% against a one-year average of 22.3% — the axis a long book loads on by default did most of the day's sorting.
| Factor | Return | Z-Score | 5d Z | 20d Z | 63d Z | Category | Direction |
|---|---|---|---|---|---|---|---|
| Beta | +1.73% | +1.8 | +2.2 | +0.8 | -1.0 | Style-Risk | High-beta names led |
| Short-Term Momentum | +0.42% | +1.4 | +0.2 | -1.4 | -3.5 | Style-Momentum | Prior week's leaders continued |
| Hedge-Fund Ownership | +0.14% | +1.3 | -0.2 | -0.8 | +0.9 | Style-Positioning | HF-owned names led |
| Morning Activity | -0.18% | -1.4 | -0.7 | -0.1 | +2.0 | Style-Flow | Morning-heavy names lagged |
| Gold | -0.37% | -1.1 | -0.1 | -0.1 | +1.5 | Thematic | Gold-exposed names lagged |
| Oil | -0.46% | -1.0 | -0.2 | +0.6 | +1.0 | Thematic | Oil-exposed names lagged |
| Semiconductors | -0.39% | -0.6 | +1.2 | +0.6 | -1.6 | Thematic | Semis-exposed names lagged |
| One-Day Momentum | -0.18% | -0.6 | -1.2 | -2.0 | -1.2 | Style-Momentum | Yesterday's movers gave back |
| Bucket | Avg Ret Pct |
|---|---|
| 1 | -1.55 |
| 2 | -0.47 |
| 3 | -0.42 |
| 4 | -0.16 |
| 5 | -0.03 |
| 6 | 0.03 |
| 7 | -0.29 |
| 8 | 0.32 |
| 9 | 0.50 |
| 10 | 0.52 |
| 11 | 0.68 |
| 12 | 0.75 |
| 13 | 0.76 |
| 14 | 1.18 |
| 15 | 1.24 |
| 16 | 1.35 |
| 17 | 2.14 |
| 18 | 2.23 |
| 19 | 2.56 |
| 20 | 4.83 |
Intel closed +12.09% and AMD +9.95%, taking AMD to $939B of market value.Bloomberg Arm finished +16.97% and Nvidia added +2.24%. But semiconductor exposure itself paid nothing once beta is accounted for: the Semiconductors factor was -0.39% at z=-0.64. The names that ran hardest without a story of their own make the mechanism plain — Super Micro +5.35%, Ouster +8.75% and IonQ +3.64%, each with essentially no company-specific contribution to the move. Accenture and Anthropic also announced an AI safety partnership today, so Meta was not the only AI headline on the screen.Bloomberg
| ETF | Theme | Today | 1d Ago | 5d Ago | 20d Ago | 63d Ago |
|---|---|---|---|---|---|---|
| BITO | crypto | +6.72% | +6.23% | +5.30% | +11.43% | +28.07% |
| EWY | south korea | +4.15% | -0.59% | -3.93% | +1.77% | -17.29% |
| SMH | semiconductors | +3.94% | +2.21% | +0.79% | +1.84% | -13.17% |
| XLC | communication services | +3.72% | -1.37% | -1.59% | +0.12% | +1.51% |
| QQQ | large cap growth | +2.80% | +0.63% | +0.92% | +1.48% | -2.48% |
| MTUM | momentum | +2.06% | +1.14% | +1.04% | +1.68% | -8.35% |
| SPY | large cap | +1.49% | +0.13% | -0.09% | +0.13% | +2.26% |
| XAR | defense | +1.59% | -0.60% | -2.48% | -11.74% | -15.61% |
| XLE | energy | -2.22% | -0.26% | -1.27% | +0.88% | +20.45% |
| USO | oil | -3.79% | -0.96% | -0.70% | +14.33% | +33.91% |
Goldman Sachs Prime Brokerage reported the strongest US equity net buying in five weeks for the week ending September 18, with TMT long-buying at its fastest two-week pace since June 2025 and hedge-fund net leverage at 49.9% — the 7th percentile of the past year. Today the names hedge funds already own led: Hedge-Fund Ownership paid +0.14% at z=+1.27, and +0.28% at z=+1.94 on a raw basis. The direction lines up with that flow print, and leverage at that level places the episode early rather than late. The top 50 high-beta momentum names ran +3.46% into the late afternoon against +0.28% for the rest of the universe.
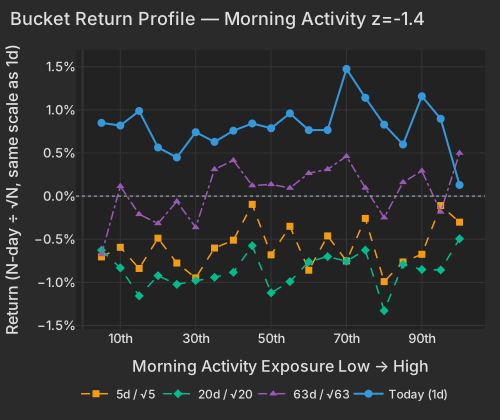
The retail-skewing end of the market sat it out. Morning Activity fell -0.18% at z=-1.45: the names that habitually run volume-heavy mornings — a group that skews retail and international — lagged those whose volume is spread evenly through the session. That same group has been the winner over the past three months, +2.30% across 60 sessions with a 63-day z of +2.0, which puts today's leadership with the institutionally traded side of the cross-section.
| Bucket | Ret 1D Pct | Ret 5D Norm Pct | Ret 20D Norm Pct | Ret 63D Norm Pct |
|---|---|---|---|---|
| 1 | 0.85 | -0.71 | -0.63 | -0.68 |
| 2 | 0.82 | -0.59 | -0.83 | 0.11 |
| 3 | 0.99 | -0.84 | -1.16 | -0.21 |
| 4 | 0.56 | -0.49 | -0.92 | -0.32 |
| 5 | 0.45 | -0.78 | -1.02 | -0.06 |
| 6 | 0.74 | -0.95 | -0.98 | -0.36 |
| 7 | 0.63 | -0.60 | -0.94 | 0.31 |
| 8 | 0.76 | -0.51 | -0.88 | 0.41 |
| 9 | 0.84 | -0.10 | -0.58 | 0.12 |
| 10 | 0.79 | -0.68 | -1.12 | 0.14 |
| 11 | 0.96 | -0.35 | -0.99 | 0.09 |
| 12 | 0.77 | -0.86 | -0.76 | 0.27 |
| 13 | 0.77 | -0.46 | -0.70 | 0.31 |
| 14 | 1.47 | -0.75 | -0.75 | 0.46 |
| 15 | 1.14 | -0.26 | -0.63 | 0.09 |
| 16 | 0.83 | -0.99 | -1.33 | -0.25 |
| 17 | 0.60 | -0.76 | -0.79 | 0.16 |
| 18 | 1.16 | -0.67 | -0.85 | 0.29 |
| 19 | 0.90 | -0.11 | -0.86 | -0.18 |
| 20 | 0.13 | -0.30 | -0.49 | 0.50 |
Crude marked $95.55, down -4.74% at 4:01 PM ET,CNBC a fourth consecutive decline as Middle East risk compressed.WSJ The Oil factor paid -0.46% and the complex gave back: XOP -2.69%, with Exxon -3.07% and Marathon Petroleum -5.10%. Both energy ETFs are still more than 20% higher across the past three months, so four down days is a pullback inside a large run.
The long end took the relief while the front end stayed pinned: the ten-year yield eased to 4.951% and the thirty-year to 5.285%, each about 4 bps lower, against a three-month bill at 4.087%.CNBC St. Louis Fed President Musalem said more hikes are likely needed to get inflation back to 2%, and futures now treat the September 23 meeting as live.Bloomberg Gold spot slipped to $4,343.42, -0.77%,CNBC with GDX -1.20% and the Gold factor -0.37% at z=-1.14. Bitcoin at $86,715 was +6.81%, its highest since January,CNBC and BITO rose +6.72% — none of which reached the equity cross-section, where the Bitcoin/Crypto factor was flat at z=-0.03.
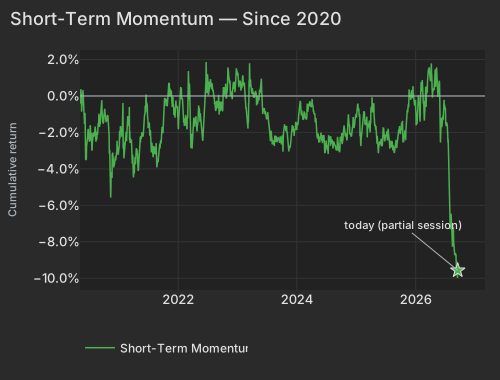
Short-Term Momentum — the one-week-less-one-day factor — paid +0.42% at z=+1.39: last week's leaders kept outperforming last week's laggards, with defense names including AeroVironment and Westinghouse Government Services in the leading bucket. That is the first material break in a run that has gone the other way for three months, -9.04% over the last 60 sessions with a 63-day z of -3.5. At the one-day lookback the churn continued, One-Day Momentum -0.18%.
| Date | Cumret Pct |
|---|---|
| 2020-05-07 | -0.04 |
| 2020-06-01 | -1.00 |
| 2020-06-23 | -2.36 |
| 2020-07-16 | -2.05 |
| 2020-08-07 | -1.99 |
| 2020-08-31 | -1.53 |
| 2020-09-23 | -1.04 |
| 2020-10-15 | -1.44 |
| 2020-11-06 | -3.02 |
| 2020-12-01 | -3.87 |
| 2020-12-23 | -2.94 |
| 2021-01-19 | -1.73 |
| 2021-02-10 | -2.72 |
| 2021-03-05 | -1.65 |
| 2021-03-29 | -3.26 |
| 2021-04-21 | -3.04 |
| 2021-05-13 | -2.26 |
| 2021-06-07 | -1.26 |
| 2021-06-29 | -1.15 |
| 2021-07-22 | -2.90 |
| 2021-08-13 | -2.84 |
| 2021-09-07 | -2.82 |
| 2021-09-29 | -1.68 |
| 2021-10-21 | -0.32 |
| 2021-11-12 | 0.41 |
| 2021-12-07 | -1.02 |
| 2021-12-30 | -1.17 |
| 2022-01-24 | -0.16 |
| 2022-02-15 | -1.28 |
| 2022-03-10 | 0.35 |
| 2022-04-01 | -1.77 |
| 2022-04-26 | -1.70 |
| 2022-05-18 | -0.94 |
| 2022-06-10 | -1.36 |
| 2022-07-06 | 0.80 |
| 2022-07-28 | 0.39 |
| 2022-08-19 | -0.77 |
| 2022-09-13 | -0.66 |
| 2022-10-05 | -0.24 |
| 2022-10-27 | 0.12 |
| 2022-11-18 | 0.35 |
| 2022-12-13 | 0.53 |
| 2023-01-06 | 1.09 |
| 2023-01-31 | 0.47 |
| 2023-02-23 | -0.71 |
| 2023-03-17 | 1.80 |
| 2023-04-11 | -0.02 |
| 2023-05-03 | -0.04 |
| 2023-05-25 | 0.58 |
| 2023-06-20 | -0.91 |
| 2023-07-13 | -1.28 |
| 2023-08-04 | -2.65 |
| 2023-08-28 | -2.27 |
| 2023-09-20 | -2.47 |
| 2023-10-12 | -2.06 |
| 2023-11-03 | -2.00 |
| 2023-11-28 | -2.55 |
| 2023-12-20 | -1.92 |
| 2024-01-16 | -0.90 |
| 2024-02-07 | -1.18 |
| 2024-03-01 | -1.30 |
| 2024-03-25 | -0.33 |
| 2024-04-17 | -0.95 |
| 2024-05-09 | -2.34 |
| 2024-06-03 | -2.16 |
| 2024-06-26 | -3.08 |
| 2024-07-19 | -2.27 |
| 2024-08-12 | -2.65 |
| 2024-09-04 | -2.83 |
| 2024-09-26 | -2.24 |
| 2024-10-18 | -1.66 |
| 2024-11-11 | -1.38 |
| 2024-12-04 | -2.18 |
| 2024-12-27 | -1.17 |
| 2025-01-23 | -0.97 |
| 2025-02-14 | -1.15 |
| 2025-03-11 | -1.74 |
| 2025-04-02 | -1.52 |
| 2025-04-25 | -1.64 |
| 2025-05-19 | -3.12 |
| 2025-06-11 | -2.71 |
| 2025-07-07 | -2.16 |
| 2025-07-29 | -2.89 |
| 2025-08-20 | -2.80 |
| 2025-09-12 | -2.50 |
| 2025-10-06 | -1.85 |
| 2025-10-28 | -2.31 |
| 2025-11-19 | -0.57 |
| 2025-12-12 | -0.09 |
| 2026-01-07 | -1.62 |
| 2026-01-30 | -1.42 |
| 2026-02-24 | -0.45 |
| 2026-03-18 | 0.80 |
| 2026-04-10 | 1.79 |
| 2026-05-04 | 1.08 |
| 2026-05-27 | 0.31 |
| 2026-06-18 | -1.09 |
| 2026-07-14 | -1.44 |
| 2026-08-05 | -7.31 |
| 2026-08-27 | -8.32 |
| 2026-09-21 | -9.57 |
This bounce is a week old. Beta has paid +4.79% over five sessions but is still -5.01% over 60, and the high-beta momentum names stood 17.5% below their peak at Friday's close. Defense has the same shape: XAR +1.59% today against -11.74% over 20 days. Implied single-stock volatility (Cboe VIXEQ) at 38.81 is at the top of its 20-session range with the VIX at 14.86 — single names are priced to swing, the index is not.
GRAIL closed the session +33.92% after the FDA approved its Galleri multi-cancer screening blood test, which also triggers a $250 million milestone payment from Illumina.Bloomberg Warner Bros. Discovery closed +10.77% on read-through from Paramount's discussed $1.5 billion California production commitment to clear its Skydance merger.WSJ Novo Nordisk fell -7.91% after 2030 sales targets came in below what the buy side wanted.Bloomberg Mohawk closed -6.81%, the sharpest stock-specific decline in the day's screen, with the driver not yet in today's coverage. The unresolved question for a book carrying today's beta is whether Wednesday's FOMC federalreserve.gov can leave the long end where oil just put it.
Variance decomposition: live intraday — 20260921 session, bracketed against its trailing-year range. Factor returns are trailing through last close. Total cross-sectional dispersion: 62%ile of the past year.
Variance mix — % of total, today vs 1d ago vs 1-yr avg
market 69%ile style 80%ile thematic 49%ile idiosyncratic 25%ile
Variance explained — today vs. factor's trailing-year range
Marker = the factor's share of today's total variance, placed in its own trailing-year range (box 25–75%ile, ticks 90%ile and max). Amber marker = unusually load-bearing today (≥90%ile of its own year). Factor name green = up today / red = down.
Correlation & dispersion — realized vs implied
Pairwise realized correlation (20d): 9.06% 6.4%ile since 2020 · 79%ile 3m
Top-500 pairwise: 10.20% 8.7%ile since 2020 · 54%ile 3m · implied (Cboe COR1M): 8.31 1.8%ile of its own history (gap +1.9pp)
Realized 20d vol (ann. pts): all stocks 39 vs VIXEQ 39 · index 10 vs VIX 15 · style factors 19 69%ile
20-day window (19 completed days + today); percentiles vs model history since 2020; '3m' tokens rank vs the trailing 63 trading days; definitions in Terms below. Implied prints (Cboe) are delayed ~15 min. as of 15:58 ET
Top 50 high-beta momentum names (eq-wt, since-2020 rank): +3.5% 90%ile · rest of market +0.3%
| Factor | Today | 1d | 5d | 20d | 60d |
|---|---|---|---|---|---|
| Style-Risk | |||||
| Beta | +1.73% z+1.8 | +0.96% | +4.79% | +3.31% | -5.01% |
| Residual Volatility | +0.30% z+0.6 | -0.12% | +0.45% | +1.09% | +5.42% |
| International | +0.00% z+0.0 | -0.12% | -0.00% | +0.62% | +1.91% |
| Style | |||||
| Value | -0.22% z-1.0 | -0.02% | -0.36% | -0.24% | -1.09% |
| Dividend Yield | -0.17% z-1.0 | +0.14% | +0.27% | +0.14% | -0.38% |
| Size | +0.31% z+0.9 | +0.33% | +1.03% | +2.90% | +2.18% |
| Profitability | -0.14% z-0.7 | +0.35% | +0.18% | -0.72% | -2.74% |
| Growth | +0.11% z+0.5 | +0.07% | +0.04% | -0.15% | +2.05% |
| Leverage | +0.04% z+0.2 | -0.13% | +0.01% | -0.66% | -4.38% |
| Liquidity | +0.04% z+0.1 | +0.37% | +0.13% | +1.31% | +3.07% |
| Style-Momentum | |||||
| Short-Term Momentum | +0.42% z+1.4 | -0.51% | +0.10% | -1.87% | -9.04% |
| One-Day Momentum | -0.18% z-0.6 | -0.24% | -0.73% | -2.53% | -3.17% |
| Long-Term Momentum | -0.19% z-0.3 | +0.26% | +1.65% | +2.00% | -5.75% |
| Medium-Term Momentum | +0.07% z+0.2 | -0.02% | -0.03% | -0.54% | -0.93% |
| Style-Positioning | |||||
| Hedge-Fund Ownership | +0.14% z+1.3 | +0.15% | -0.05% | -0.39% | +0.52% |
| Short Interest | +0.06% z+0.4 | -0.39% | -0.56% | -0.95% | -0.78% |
| Style-Flow | |||||
| Morning Activity | -0.18% z-1.4 | -0.26% | -0.19% | -0.07% | +2.30% |
| Short-Sale Activity | -0.07% z-0.6 | +0.02% | -0.08% | +0.39% | +1.13% |
| Thematic | |||||
| Gold | -0.37% z-1.1 | +0.17% | -0.05% | -0.19% | +5.07% |
| Oil | -0.46% z-1.0 | -0.05% | -0.19% | +1.25% | +6.01% |
| Treasury (Duration) | -0.23% z-0.7 | -0.24% | -0.40% | -2.52% | -1.74% |
| Semiconductors | -0.39% z-0.6 | +0.79% | +1.59% | +1.50% | -7.17% |
| China | +0.22% z+0.5 | +0.40% | +0.21% | +0.32% | +2.19% |
| Bitcoin / Crypto | -0.01% z-0.0 | +0.35% | -0.13% | +1.75% | +2.72% |
5/20/60d windows include today's session; 1d is the previous session.
Market variance share. The fraction of cross-sectional variance explained by the market factor — the attribution companion to pairwise correlation, not a substitute for it.
Factor z-score. Today's factor return divided by its daily-return standard deviation over ~1,600 trading days.
High-beta momentum cohort. US names above $2B market cap in the top quintile of both raw beta and 12-month momentum; membership frozen at each month's first business day. “Top 50” = the 50 strongest by combined rank.
Stock-specific (idiosyncratic) return. The part of a stock's move not explained by market, style, or thematic factors in our decomposition.
VIXEQ / DSPX / COR1M. Cboe implied indices: single-stock volatility, dispersion, and 1-month implied correlation (top-50 S&P names). Quotes delayed ~15 minutes.
Data compiled by FactorPulse AI; edited and verified by Jeff Klein. For informational purposes only. Does not constitute financial advice, an investment recommendation, or an offer to buy or sell any securities. Always consult a qualified financial professional before making investment decisions.
For more on factor construction methodology, see www.factorpulse.com/glossary.