Oil fell for a fourth straight day, to just under $98 a barrel, and the ten-year Treasury yield slipped back below 5%, and that pair of reprieves sent buyers straight to the riskiest stocks on the board. Chipmaker Intel jumped 5% before the open, semiconductor and speculative-growth funds led, and the Nasdaq-tracking fund was up about 1% versus roughly 0.7% for the S&P 500 fund. Energy shares were the morning's only real casualty, sliding with crude, though the oil fund is still up more than a third over three months. Gold eased to about $4,350 an ounce, and long-term bonds rallied as yields in the middle of the curve dropped the most.
Bitcoin climbed above $85,000, its highest since January, up about 4% after the Senate voted last week to block the Clarity Act. Crypto exchange Coinbase and bitcoin-hoarding software company MicroStrategy each gained around 5%, and the leveraged bitcoin fund rose 4% on top of a run that has it up more than a quarter over three months. Elsewhere, homebuilder Lennar surged 11% after laying out a new strategy at its investor day and bouncing off a 52-week low, even as the broader homebuilder group barely moved. Warner Bros. Discovery rose 7% after Paramount discussed a $1.5 billion California production pledge to clear its Skydance merger, with Paramount Skydance up a similar amount. Drugmaker Novo Nordisk dropped 5%, shedding roughly $9 billion in value, after its 2030 sales targets disappointed.
The relief comes against a bruising backdrop: the Fed raised rates last week, with Minneapolis Fed chief Neel Kashkari saying inflation remains too high, and the 20-year Treasury still yields about 5.3%, the highest point on the curve. Heavily indebted companies have just endured their worst three-month stretch since at least 2020, and the market's most volatile stocks are still down sharply over that window, so Monday's bounce is a rebound inside a decline, not a break from it. Goldman Sachs says hedge funds were net buyers into the end of last week but remain lightly positioned, with exposure near the bottom of the past year's range.
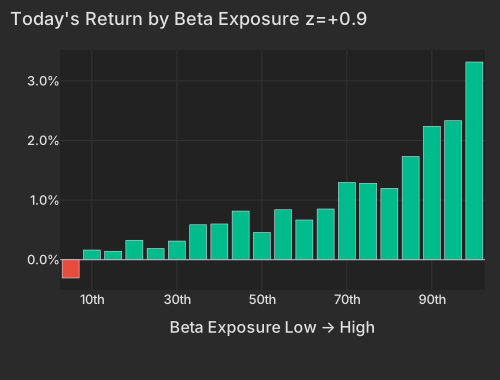
Beta's 13.5% conditional importance is the highest of any factor this refresh, and the shape is right-tail driven — the highest-exposure bucket is +3.3% while the rest of the gradient contributes far less. Intel +5.24% is the large-cap face of it, adding $30.0B of market value. The beta complex supplied +1.74 points of that move; the remainder is Intel's own. Wolfspeed is purer still at +3.97%, with its own residual slightly negative. So far this morning Beta accounts for 34.6% of cross-sectional variance, an 81st-percentile reading for that factor since 2020.
| Factor | Return | Z-Score | 5d Z | 20d Z | 63d Z | Category | Direction |
|---|---|---|---|---|---|---|---|
| Beta | +0.88% | +0.9 | +1.8 | +0.6 | -1.1 | Style-Risk | Most market-sensitive names outperformed |
| Residual Volatility | +0.19% | +0.4 | +0.3 | +0.4 | +1.0 | Style-Risk | More volatile names outperformed |
| Bitcoin / Crypto | +0.16% | +0.5 | +0.1 | +1.4 | +0.9 | Thematic | Crypto-exposed names outperformed |
| Leverage | +0.07% | +0.4 | +0.1 | -0.8 | -3.0 | Style | More levered names outperformed today |
| Short-Sale Activity | -0.07% | -0.7 | -0.4 | +0.8 | +1.0 | Style-Flow | Barely-shorted names beat the most short-sold |
| Short Interest | -0.02% | -0.1 | -1.7 | -1.4 | -0.2 | Style-Positioning | Flat today; most-shorted lagging over the week |
| Short-Term Momentum | -0.04% | -0.1 | -0.5 | -1.7 | -3.7 | Style-Momentum | Last week's movers reverting, at a crawl today |
| Hedge-Fund Ownership | +0.01% | +0.1 | -0.8 | -1.1 | +0.8 | Style-Positioning | Flat — no ownership tilt in today's move |
| Bucket | Avg Ret Pct |
|---|---|
| 1 | -0.31 |
| 2 | 0.16 |
| 3 | 0.14 |
| 4 | 0.33 |
| 5 | 0.19 |
| 6 | 0.31 |
| 7 | 0.59 |
| 8 | 0.60 |
| 9 | 0.82 |
| 10 | 0.46 |
| 11 | 0.84 |
| 12 | 0.67 |
| 13 | 0.85 |
| 14 | 1.30 |
| 15 | 1.28 |
| 16 | 1.20 |
| 17 | 1.73 |
| 18 | 2.24 |
| 19 | 2.33 |
| 20 | 3.32 |
The same position shows up under a second label: the top 50 high-beta momentum names are up +2.60% against +0.54% for the rest of the universe, and those names' exposures correlate 0.50 with Beta itself.
WTI is $97.81 as of 7:11 AM ET, down -2.48% and lower for a fourth straight session CNBCBloomberg. Gold slipped with it to $4,354 an ounce CNBC. The curve rallied through the middle — the seven-year down 4.2 bp and the ten-year 4.1 bp to 4.955%, against just 2.0 bp at the two-year CNBC. Energy is the only real casualty on the board: XLE and XOP are the weakest equity groups, and consumer staples at -0.05% is the only other sector fund lower. The relief is small against the trend — USO is down today and still up more than a third over three months.
| ETF | Theme | Today | 1d Ago | 5d Ago | 20d Ago | 63d Ago |
|---|---|---|---|---|---|---|
| BITO | crypto | +4.08% | +6.23% | +5.30% | +11.43% | +28.07% |
| ARKK | innovation growth | +1.77% | +1.51% | +5.56% | +5.96% | +10.03% |
| SMH | semiconductors | +1.52% | +2.21% | +0.79% | +1.84% | -13.17% |
| MTUM | momentum | +1.17% | +1.14% | +1.04% | +1.68% | -8.35% |
| QQQ | large cap growth | +1.01% | +0.63% | +0.92% | +1.48% | -2.48% |
| SPY | large cap | +0.65% | +0.13% | -0.09% | +0.13% | +2.26% |
| TLT | long-term bonds | +0.65% | -0.65% | +0.47% | -0.94% | -5.25% |
| VXX | volatility | -1.49% | +0.17% | -1.72% | -7.45% | -22.11% |
| XLE | energy | -0.89% | -0.26% | -1.27% | +0.88% | +20.45% |
| USO | oil | -2.33% | -0.96% | -0.70% | +14.33% | +33.91% |
Bitcoin traded as high as $85,229 and was $84,616 at 7:22 AM ET, up +4.23% CNBC — its best level since January, and it got there after the Senate voted last week to block the Clarity Act CNBC. The equity proxies are moving harder than the theme: COIN +5.04%, MSTR +5.57%, HOOD +4.21%, against Bitcoin / Crypto at +0.16%, z=+0.5. On MSTR the style complex supplied +2.51 points of the move, so a good half of it is the same high-beta bid lifting everything else this morning.
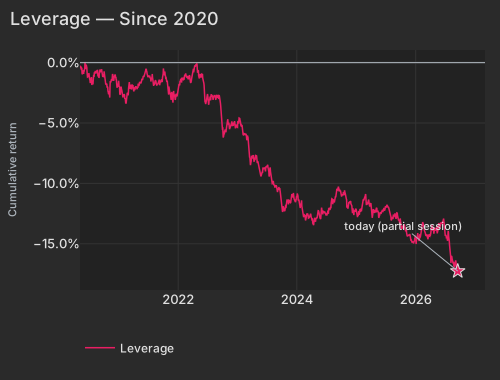
The structural mark on this market is Leverage: -3.97% over the completed 63 sessions at z=-3.0, the bottom 0.2% of 1,538 overlapping three-month windows since 2020. Today's +0.07% is consistent with the yield relief and nothing more. The long end explains the persistence — the 20-year at 5.333% is still the highest point on the curve CNBC — and the Fed hiked last week with Neel Kashkari saying inflation remains too high Bloomberg.
| Date | Cumret Pct |
|---|---|
| 2020-05-07 | -0.36 |
| 2020-06-01 | -0.62 |
| 2020-06-23 | -1.19 |
| 2020-07-16 | -1.21 |
| 2020-08-07 | -0.90 |
| 2020-08-31 | -1.05 |
| 2020-09-23 | -1.15 |
| 2020-10-15 | -1.72 |
| 2020-11-06 | -2.89 |
| 2020-12-01 | -1.51 |
| 2020-12-23 | -2.03 |
| 2021-01-19 | -2.30 |
| 2021-02-10 | -2.93 |
| 2021-03-05 | -2.05 |
| 2021-03-29 | -1.98 |
| 2021-04-21 | -2.08 |
| 2021-05-13 | -1.65 |
| 2021-06-07 | -1.06 |
| 2021-06-29 | -1.20 |
| 2021-07-22 | -1.31 |
| 2021-08-13 | -1.47 |
| 2021-09-07 | -1.49 |
| 2021-09-29 | -1.13 |
| 2021-10-21 | -1.51 |
| 2021-11-12 | -2.60 |
| 2021-12-07 | -2.61 |
| 2021-12-30 | -2.75 |
| 2022-01-24 | -1.65 |
| 2022-02-15 | -1.12 |
| 2022-03-10 | -1.14 |
| 2022-04-01 | -0.59 |
| 2022-04-26 | -0.09 |
| 2022-05-18 | -0.94 |
| 2022-06-10 | -1.87 |
| 2022-07-06 | -3.16 |
| 2022-07-28 | -2.69 |
| 2022-08-19 | -2.84 |
| 2022-09-13 | -2.74 |
| 2022-10-05 | -5.65 |
| 2022-10-27 | -4.98 |
| 2022-11-18 | -5.34 |
| 2022-12-13 | -4.96 |
| 2023-01-06 | -4.94 |
| 2023-01-31 | -5.20 |
| 2023-02-23 | -5.89 |
| 2023-03-17 | -7.79 |
| 2023-04-11 | -7.65 |
| 2023-05-03 | -8.08 |
| 2023-05-25 | -9.40 |
| 2023-06-20 | -8.80 |
| 2023-07-13 | -8.92 |
| 2023-08-04 | -10.02 |
| 2023-08-28 | -10.14 |
| 2023-09-20 | -10.39 |
| 2023-10-12 | -12.00 |
| 2023-11-03 | -11.33 |
| 2023-11-28 | -11.47 |
| 2023-12-20 | -11.37 |
| 2024-01-16 | -11.34 |
| 2024-02-07 | -12.39 |
| 2024-03-01 | -12.88 |
| 2024-03-25 | -12.62 |
| 2024-04-17 | -13.25 |
| 2024-05-09 | -12.52 |
| 2024-06-03 | -12.30 |
| 2024-06-26 | -12.50 |
| 2024-07-19 | -12.02 |
| 2024-08-12 | -11.72 |
| 2024-09-04 | -10.65 |
| 2024-09-26 | -10.66 |
| 2024-10-18 | -10.79 |
| 2024-11-11 | -11.82 |
| 2024-12-04 | -11.81 |
| 2024-12-27 | -12.31 |
| 2025-01-23 | -12.42 |
| 2025-02-14 | -11.36 |
| 2025-03-11 | -11.74 |
| 2025-04-02 | -11.65 |
| 2025-04-25 | -12.39 |
| 2025-05-19 | -12.28 |
| 2025-06-11 | -12.26 |
| 2025-07-07 | -11.94 |
| 2025-07-29 | -12.44 |
| 2025-08-20 | -12.57 |
| 2025-09-12 | -12.46 |
| 2025-10-06 | -13.56 |
| 2025-10-28 | -13.53 |
| 2025-11-19 | -14.28 |
| 2025-12-12 | -14.90 |
| 2026-01-07 | -15.02 |
| 2026-01-30 | -14.21 |
| 2026-02-24 | -13.39 |
| 2026-03-18 | -14.28 |
| 2026-04-10 | -13.45 |
| 2026-05-04 | -13.92 |
| 2026-05-27 | -13.29 |
| 2026-06-18 | -13.22 |
| 2026-07-14 | -14.56 |
| 2026-08-05 | -15.70 |
| 2026-08-27 | -16.81 |
| 2026-09-21 | -17.26 |
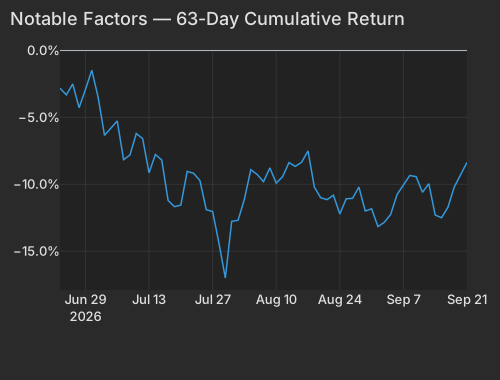
No positioning lens attributes this morning's buyer. Hedge-Fund Ownership is flat on both the residualized and raw measures, z=+0.08 and z=+0.16 — genuine absence, not exposure absorbed upstream. The most-shorted names have lagged -0.64% over the past five sessions at z=-1.7, the persistent drag paying, which sits with risk appetite rather than against it. What the bid has to work against is the three-month hole underneath it: Beta -8.36% cumulative, with the semiconductor and momentum funds carrying comparable damage over the same window.
| Factor | Display Name | Cumret Pct |
|---|---|---|
| beta | Beta | -8.36 |
Lennar's B shares are +10.78%, essentially all of it the stock's own move, after a Capital Markets Day strategy update and a bounce off a 52-week low. The builders are not following — ITB is +0.88% against -8.88% over 20 sessions. Warner Bros. Discovery is +6.92%, adding $4.75B of market value, on the read-through from Paramount's discussed $1.5 billion California production commitment to clear its Skydance merger WSJ; Paramount Skydance itself is +6.90%. Novo Nordisk is -4.85%, erasing $9.28B, after 2030 sales targets came in short of what investors wanted Bloomberg. Accenture is +4.94% on the Anthropic parternship, and Critical Metals +25.88% is boosted by the Greenland security deal.
Goldman Sachs Prime Services reported net buying for the session ending September 18, with aggregate net exposure still at the 34th percentile of the past year and US fundamental long/short net leverage at the 7th.
Variance decomposition: live intraday — 20260921 session, bracketed against its trailing-year range. Factor returns are trailing through last close. Total cross-sectional dispersion: 2.4%ile of the past year.
Variance mix — % of total, today vs 1d ago vs 1-yr avg
market 94.0%ile style 89%ile thematic 28%ile idiosyncratic 3.2%ile
Variance explained — today vs. factor's trailing-year range
Marker = the factor's share of today's total variance, placed in its own trailing-year range (box 25–75%ile, ticks 90%ile and max). Amber marker = unusually load-bearing today (≥90%ile of its own year). Factor name green = up today / red = down.
Correlation & dispersion — realized vs implied
Pairwise realized correlation (20d): 9.50% 7.2%ile since 2020 · 84%ile 3m
Top-500 pairwise: 8.99% 5.8%ile since 2020 · 43%ile 3m · implied (Cboe COR1M): 9.23 2.9%ile of its own history (gap -0.2pp)
Realized 20d vol (ann. pts): all stocks 38 vs VIXEQ 36 · index 10 vs VIX 15 · style factors 19 66%ile
20-day window (19 completed days + today); percentiles vs model history since 2020; '3m' tokens rank vs the trailing 63 trading days; definitions in Terms below. Implied prints (Cboe) are delayed ~15 min. as of 06:39 ET
Top 50 high-beta momentum names (eq-wt, since-2020 rank): +2.6% 83%ile · rest of market +0.5%
| Factor | Today | 1d | 5d | 20d | 60d |
|---|---|---|---|---|---|
| Style-Risk | |||||
| Beta | +0.88% z+0.9 | +0.96% | +3.94% | +2.46% | -5.86% |
| Residual Volatility | +0.19% z+0.4 | -0.12% | +0.33% | +0.97% | +5.31% |
| International | +0.03% z+0.1 | -0.12% | +0.03% | +0.65% | +1.94% |
| Style | |||||
| Leverage | +0.07% z+0.4 | -0.13% | +0.04% | -0.63% | -4.35% |
| Growth | -0.08% z-0.3 | +0.07% | -0.15% | -0.35% | +1.86% |
| Liquidity | +0.07% z+0.3 | +0.37% | +0.17% | +1.34% | +3.10% |
| Value | -0.03% z-0.1 | -0.02% | -0.16% | -0.04% | -0.90% |
| Profitability | -0.01% z-0.1 | +0.35% | +0.31% | -0.59% | -2.61% |
| Dividend Yield | -0.01% z-0.0 | +0.14% | +0.43% | +0.30% | -0.22% |
| Size | +0.00% z+0.0 | +0.33% | +0.72% | +2.59% | +1.87% |
| Style-Momentum | |||||
| One-Day Momentum | +0.07% z+0.2 | -0.24% | -0.49% | -2.29% | -2.92% |
| Medium-Term Momentum | +0.05% z+0.2 | -0.02% | -0.05% | -0.56% | -0.95% |
| Short-Term Momentum | -0.04% z-0.1 | -0.51% | -0.36% | -2.33% | -9.51% |
| Long-Term Momentum | -0.06% z-0.1 | +0.26% | +1.78% | +2.13% | -5.61% |
| Style-Positioning | |||||
| Short Interest | -0.02% z-0.1 | -0.39% | -0.64% | -1.03% | -0.87% |
| Hedge-Fund Ownership | +0.01% z+0.1 | +0.15% | -0.18% | -0.52% | +0.39% |
| Style-Flow | |||||
| Short-Sale Activity | -0.07% z-0.7 | +0.02% | -0.08% | +0.39% | +1.12% |
| Morning Activity | +0.07% z+0.5 | -0.26% | +0.06% | +0.17% | +2.55% |
| Thematic | |||||
| Bitcoin / Crypto | +0.16% z+0.5 | +0.35% | +0.03% | +1.92% | +2.88% |
| Oil | -0.19% z-0.4 | -0.05% | +0.09% | +1.53% | +6.29% |
| China | +0.16% z+0.4 | +0.40% | +0.15% | +0.26% | +2.13% |
| Semiconductors | +0.06% z+0.1 | +0.79% | +2.04% | +1.95% | -6.72% |
| Treasury (Duration) | -0.03% z-0.1 | -0.24% | -0.20% | -2.32% | -1.54% |
| Gold | -0.00% z-0.0 | +0.17% | +0.32% | +0.18% | +5.43% |
5/20/60d windows include today's session; 1d is the previous session.
Market variance share. The fraction of cross-sectional variance explained by the market factor — the attribution companion to pairwise correlation, not a substitute for it.
Factor z-score. Today's factor return divided by its daily-return standard deviation over ~1,600 trading days.
Conditional importance. A factor's relative share of what a tree-based fit of today's stock returns explains; sums to 100% across factors.
High-beta momentum cohort. US names above $2B market cap in the top quintile of both raw beta and 12-month momentum; membership frozen at each month's first business day. “Top 50” = the 50 strongest by combined rank.
Data compiled by FactorPulse AI; edited and verified by Jeff Klein. For informational purposes only. Does not constitute financial advice, an investment recommendation, or an offer to buy or sell any securities. Always consult a qualified financial professional before making investment decisions.
For more on factor construction methodology, see www.factorpulse.com/glossary.