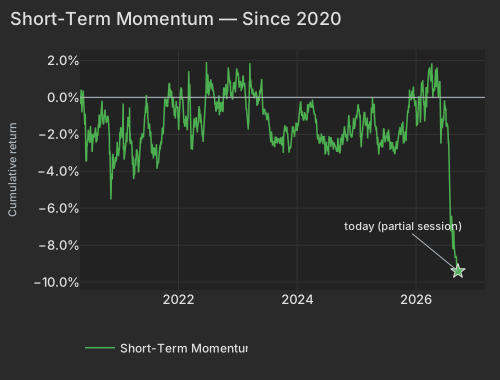
Hedge funds paring back their bets, not any single headline, is what has been steering stocks for the past three months, and Friday's pre-open showed no sign of the pattern breaking. Each week's winners have been sold off in turn since June, a churn that fits what Goldman Sachs' trading desk is now reporting: its hedge-fund clients have cut their chip exposure to about 19% from a 24% peak, shifting money toward analog chipmakers, materials and defense names. Trend-following funds dumped roughly $15 billion of global stocks last week and are expected to sell another $20 billion this week if markets stay flat, according to LSEG. All of that lands on an unusually mechanical Friday, with more than $2 trillion in futures and options expiring and S&P Dow Jones Indices rejiggering the S&P 500 at the close, adding fuel-cell maker Bloom Energy and gene-sequencing company Illumina while dropping brewer Molson Coors and ad-tech firm The Trade Desk.
Overseas, Japan and Korea were the weak spots. The Bank of Japan raised its benchmark rate to 1.25% on a split 7-2 vote and paired it with cautious guidance, pushing the yen past 157 to the dollar and sending the main Japan stock fund down more than 1%. In Seoul, President Lee Jae Myung ruled out sending forces to the Strait of Hormuz as his approval rating slid to a record-low 37%, and the Korea fund gave up more than 1% after a strong month. Metals were the bright spot: silver climbed about 2% and gold traded near $4,370 an ounce, gains attributed to easing crude costs, with oil steady around $102 a barrel after three straight declines. Treasury yields ticked higher, the 10-year sitting just under 5%.
Among big names, Netflix dropped about 4%, wiping out roughly $13 billion in value, after reports that its content chief is pushing the streamer deeper into live sports, while Alphabet and Meta moved higher. And Warren Buffett said in a Friday letter that he is stepping aside as Berkshire Hathaway's chairman, warning that investors are increasingly showing "casino-like behavior." On the economy, the New York Fed's model kept its forecast for 2026 growth at a sluggish 1.2%, nudged its inflation outlook slightly higher and pointed to an AI-driven investment boom as a reason rates may need to stay elevated further out, with an updated read on third-quarter growth due at 12:45 p.m. ET.
The shorter clocks are far milder — z=-0.9 over five days and z=-1.0 over twenty — so the extreme belongs to the quarter, not to the week, and nothing in the session so far extends it. The rest of the pre-open cross-section is quiet: Beta is the largest style move in basis points at +0.26% (z=+0.3), and no factor in the table clears a single-day z of 0.6.
| Factor | Return | Z-Score | 5d Z | 20d Z | 63d Z | Category | Direction |
|---|---|---|---|---|---|---|---|
| Short-Term Momentum | +0.02% | +0.1 | -0.9 | -1.0 | -3.5 | Style-Momentum | Five-day reversion, three months running |
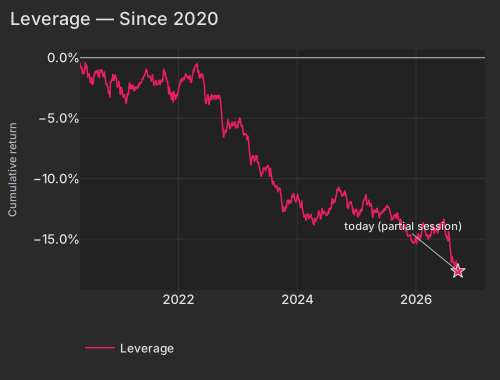
| Leverage | -0.05% | -0.3 | -1.2 | -1.1 | -3.0 | Style | Debt-heavy names still discounted |
| Beta | +0.26% | +0.3 | +0.0 | +0.3 | -1.3 | Style-Risk | High-beta names bid pre-open |
| International | -0.17% | -0.6 | -0.2 | +0.6 | +0.4 | Style-Risk | US over US-listed foreign names |
| Hedge-Fund Ownership | +0.05% | +0.5 | -1.3 | -1.4 | +0.6 | Style-Positioning | Month-long drag, paused today |
| China | +0.16% | +0.4 | -0.2 | -0.0 | +0.2 | Thematic | China-exposed names led |
| Bitcoin / Crypto | +0.11% | +0.4 | +0.6 | +1.1 | +0.7 | Thematic | Crypto-linked names led |
| Treasury (Duration) | -0.07% | -0.2 | +0.0 | -1.4 | -0.3 | Thematic | Duration not sorting today |
| Date | Cumret Pct |
|---|---|
| 2020-05-06 | 0.05 |
| 2020-05-29 | -0.94 |
| 2020-06-22 | -2.25 |
| 2020-07-15 | -2.29 |
| 2020-08-06 | -1.85 |
| 2020-08-28 | -1.45 |
| 2020-09-22 | -1.28 |
| 2020-10-14 | -1.24 |
| 2020-11-05 | -2.92 |
| 2020-11-30 | -3.69 |
| 2020-12-22 | -2.40 |
| 2021-01-15 | -1.91 |
| 2021-02-09 | -2.79 |
| 2021-03-04 | -1.58 |
| 2021-03-26 | -3.18 |
| 2021-04-20 | -2.80 |
| 2021-05-12 | -2.52 |
| 2021-06-04 | -1.28 |
| 2021-06-28 | -1.03 |
| 2021-07-21 | -3.04 |
| 2021-08-12 | -2.74 |
| 2021-09-03 | -3.08 |
| 2021-09-28 | -1.71 |
| 2021-10-20 | -0.50 |
| 2021-11-11 | 0.35 |
| 2021-12-06 | -0.51 |
| 2021-12-29 | -0.53 |
| 2022-01-21 | 0.45 |
| 2022-02-14 | -1.44 |
| 2022-03-09 | -0.19 |
| 2022-03-31 | -2.10 |
| 2022-04-25 | -1.43 |
| 2022-05-17 | -1.37 |
| 2022-06-09 | -1.32 |
| 2022-07-05 | 0.80 |
| 2022-07-27 | 0.43 |
| 2022-08-18 | -0.53 |
| 2022-09-12 | -0.97 |
| 2022-10-04 | -0.74 |
| 2022-10-26 | -0.09 |
| 2022-11-17 | 0.90 |
| 2022-12-12 | 0.44 |
| 2023-01-05 | 1.32 |
| 2023-01-30 | 0.48 |
| 2023-02-22 | -0.12 |
| 2023-03-16 | 0.75 |
| 2023-04-10 | 0.14 |
| 2023-05-02 | -0.14 |
| 2023-05-24 | 0.25 |
| 2023-06-16 | -0.62 |
| 2023-07-12 | -1.15 |
| 2023-08-03 | -2.40 |
| 2023-08-25 | -2.30 |
| 2023-09-19 | -2.52 |
| 2023-10-11 | -2.41 |
| 2023-11-02 | -1.94 |
| 2023-11-27 | -2.51 |
| 2023-12-19 | -1.97 |
| 2024-01-12 | -1.26 |
| 2024-02-06 | -1.11 |
| 2024-02-29 | -1.20 |
| 2024-03-22 | -0.24 |
| 2024-04-16 | -0.73 |
| 2024-05-08 | -2.21 |
| 2024-05-31 | -2.23 |
| 2024-06-25 | -2.91 |
| 2024-07-18 | -2.35 |
| 2024-08-09 | -2.59 |
| 2024-09-03 | -2.94 |
| 2024-09-25 | -2.84 |
| 2024-10-17 | -1.75 |
| 2024-11-08 | -2.13 |
| 2024-12-03 | -2.18 |
| 2024-12-26 | -1.23 |
| 2025-01-22 | -1.09 |
| 2025-02-13 | -1.32 |
| 2025-03-10 | -1.09 |
| 2025-04-01 | -1.38 |
| 2025-04-24 | -1.38 |
| 2025-05-16 | -2.82 |
| 2025-06-10 | -2.66 |
| 2025-07-03 | -2.08 |
| 2025-07-28 | -2.53 |
| 2025-08-19 | -2.65 |
| 2025-09-11 | -2.58 |
| 2025-10-03 | -1.94 |
| 2025-10-27 | -2.20 |
| 2025-11-18 | -0.61 |
| 2025-12-11 | 0.29 |
| 2026-01-06 | -0.84 |
| 2026-01-29 | -1.02 |
| 2026-02-23 | -0.21 |
| 2026-03-17 | 0.30 |
| 2026-04-09 | 1.56 |
| 2026-05-01 | 0.96 |
| 2026-05-26 | 0.43 |
| 2026-06-17 | -1.11 |
| 2026-07-13 | -1.46 |
| 2026-08-04 | -6.48 |
| 2026-08-26 | -7.97 |
| 2026-09-18 | -9.40 |
All of this lands on a mechanical-flow day. S&P Dow Jones Indices executes its quarterly reconstitution at today's close, with Bloom Energy, Everpure and Illumina joining the S&P 500 in place of Molson Coors, The Trade Desk and Builders FirstSource, effective before Monday's open, as CME Group reported, alongside more than $2 trillion of expiring notional across index futures, index options and single-stock options. IWB is already the one broad instrument trading heavy, at 1.7× the typical session pace.
Goldman Sachs Prime Brokerage data, covering flows through the prior session at the latest, puts global semiconductor net exposure at 19%, down from a 24% peak in June, with client buying moving into analog semiconductors, materials and defense. LSEG's expiry preview puts trend-follower liquidation at roughly $15B of global equities in the week to September 11, with a further $20B projected on a flat tape this week against $120B of net length still in place. Our positioning lens speaks to the leverage half of that claim directly: Hedge-Fund Ownership has lost -0.70% over the past 20 sessions at z=-1.4, and the raw version carries the same sign at -0.29% — the heavily-owned names were not spared this month. Today they are +0.05% at z=+0.5, a one-day pause in that drag. Short Interest is flat at +0.03%, which takes a squeeze off the table as an explanation for anything this morning.
| ETF | Theme | Today | 1d Ago | 5d Ago | 20d Ago | 63d Ago |
|---|---|---|---|---|---|---|
| SMH | semiconductors | +0.18% | +2.76% | +0.06% | -0.06% | -10.15% |
| XAR | defense | +0.36% | -0.40% | -1.37% | -15.06% | -15.48% |
| XLB | materials | -0.34% | +0.69% | -0.10% | -3.45% | -2.15% |
| IGV | software | +0.47% | +0.78% | +4.53% | +2.89% | +18.64% |
| ARKK | innovation growth | +0.57% | +4.50% | +4.65% | +4.33% | +10.74% |
| MTUM | momentum | — | +2.10% | +1.18% | +0.28% | -6.56% |
| QQQ | large cap growth | +0.16% | +1.73% | +1.16% | +0.12% | -0.66% |
| SPY | large cap | -0.02% | +1.13% | +0.63% | -0.84% | +3.18% |
The destinations named in that flow report are themselves three-month losers — XAR -15.48% and XLB -2.15% over 63 sessions against SMH's -10.15% — so the buying reported into materials and defense is the same fade-the-leaders pattern expressed at theme level. The semiconductor axis is where it has been loudest: Semiconductors carried 6.3 vol points of cross-sectional variance on the blended five-day window, the 97.9th percentile since 2020.
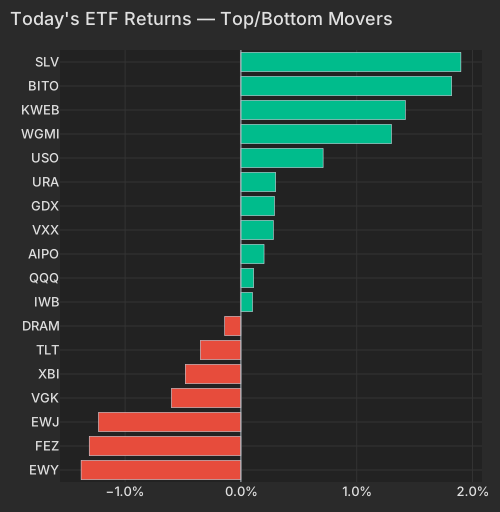
The International factor is -0.17% at z=-0.6 — small in basis points, but carrying 2.19% of this morning's cross-sectional variance, above the 90th percentile of its own past year. That makes the listing-segment spread the one style axis doing real work pre-open, and the overnight news sits inside it. The Bank of Japan raised its policy rate to 1.25% on a split 7-2 vote with cautious guidance, sending the yen past 157 per dollar, CNBC reported; EWJ is -1.17%. In Korea, President Lee Jae Myung ruled out sending forces to the Strait of Hormuz as his approval rating hit a record-low 37%, and EWY is -1.29% after +4.56% over the past 20 sessions. Vodafone at -4.90% is the heaviest single drag inside the segment.
| Sym | Theme | Ret Today Pct | Vol Pace |
|---|---|---|---|
| EWY | international | -1.38 | 0.35 |
| FEZ | international | -1.31 | 0.09 |
| EWJ | international | -1.23 | 0.02 |
| VGK | international | -0.60 | 0.11 |
| XBI | growth | -0.48 | 0.08 |
| TLT | rates | -0.35 | 0.17 |
| DRAM | technology | -0.14 | 0.59 |
| IWB | size | 0.10 | 1.74 |
| QQQ | growth | 0.11 | 0.34 |
| AIPO | technology + cyclical | 0.20 | 0.21 |
| VXX | uncertainty | 0.28 | 0.22 |
| GDX | currency | 0.29 | 0.18 |
| URA | energy + cyclical | 0.30 | 0.20 |
| USO | energy + cyclical | 0.71 | 0.75 |
| WGMI | retail + currency | 1.30 | 0.04 |
| KWEB | international | 1.42 | 0.18 |
| BITO | retail + currency | 1.82 | 0.02 |
| SLV | currency | 1.90 | 1.37 |
Rates are firmer across the curve with the belly leading — the 3-year at 4.805% (+4.3 bps) and the 10-year at 4.98% (+3.3 bps), as CNBC reported — yet Treasury (Duration) is flat at -0.07%, so duration is not sorting the cross-section the way it did over the past month (-1.99%, z=-1.4). Metals are the strongest thing on the board: SLV is +2.06% with spot gold at $4,370.45, up +0.70% at 9:06 AM ET, gains the Economic Times attributed to easing crude costs. WTI itself is steady at $102.04, up +0.13% at 8:56 AM ET, after three sessions of declines that Morgan Stanley's Martijn Rats set against tightening crude supply and a widening crude share of diesel pricing.
Xenon Pharmaceuticals is -22.99%, erasing $1.29B of market value. The company paused new patient enrollment in its Phase 3 major-depressive-disorder and bipolar studies of azetukalner after reports of psychosis and ataxia, disclosing it alongside an NDA submission for focal onset seizures. Netflix is -4.29%, erasing $13.26B, essentially all of it the stock's own move, after CNBC reported content chief Bela Bajaria's push into live sports on Thursday. Alphabet at +2.15% and Meta at +1.02% are pulling the other way inside the same sector, whose median stock is +0.23%. Separately, Warren Buffett said in a Friday letter that he is stepping aside as Berkshire Hathaway chairman, cautioning that market participants increasingly show "casino-like behavior," as CBS News and Fox Business reported.
Leverage is the other multi-week signal running in the same direction: -4.16% over the past 60 sessions at z=-3.0 on the 63-day window, and flat today at -0.05%. Balance-sheet-heavy names have been discounted continuously through the same stretch in which each week's leaders were given back, which is what a book being sized down rather than re-aimed looks like.
| Date | Cumret Pct |
|---|---|
| 2020-05-06 | -0.41 |
| 2020-05-29 | -1.34 |
| 2020-06-22 | -1.36 |
| 2020-07-15 | -1.66 |
| 2020-08-06 | -1.37 |
| 2020-08-28 | -1.36 |
| 2020-09-22 | -1.42 |
| 2020-10-14 | -2.19 |
| 2020-11-05 | -3.18 |
| 2020-11-30 | -1.84 |
| 2020-12-22 | -2.49 |
| 2021-01-15 | -2.39 |
| 2021-02-09 | -3.55 |
| 2021-03-04 | -2.11 |
| 2021-03-26 | -2.47 |
| 2021-04-20 | -2.38 |
| 2021-05-12 | -2.08 |
| 2021-06-04 | -1.60 |
| 2021-06-28 | -1.58 |
| 2021-07-21 | -1.67 |
| 2021-08-12 | -1.93 |
| 2021-09-03 | -1.97 |
| 2021-09-28 | -1.65 |
| 2021-10-20 | -1.66 |
| 2021-11-11 | -2.72 |
| 2021-12-06 | -2.75 |
| 2021-12-29 | -3.16 |
| 2022-01-21 | -1.77 |
| 2022-02-14 | -1.52 |
| 2022-03-09 | -1.71 |
| 2022-03-31 | -1.24 |
| 2022-04-25 | -0.59 |
| 2022-05-17 | -1.44 |
| 2022-06-09 | -2.12 |
| 2022-07-05 | -3.28 |
| 2022-07-27 | -3.25 |
| 2022-08-18 | -3.28 |
| 2022-09-12 | -3.14 |
| 2022-10-04 | -5.75 |
| 2022-10-26 | -5.86 |
| 2022-11-17 | -5.80 |
| 2022-12-12 | -5.41 |
| 2023-01-05 | -5.24 |
| 2023-01-30 | -5.57 |
| 2023-02-22 | -6.33 |
| 2023-03-16 | -7.87 |
| 2023-04-10 | -8.14 |
| 2023-05-02 | -8.39 |
| 2023-05-24 | -9.72 |
| 2023-06-16 | -9.16 |
| 2023-07-12 | -9.26 |
| 2023-08-03 | -10.26 |
| 2023-08-25 | -10.63 |
| 2023-09-19 | -10.95 |
| 2023-10-11 | -12.29 |
| 2023-11-02 | -11.92 |
| 2023-11-27 | -11.99 |
| 2023-12-19 | -11.74 |
| 2024-01-12 | -11.80 |
| 2024-02-06 | -12.56 |
| 2024-02-29 | -13.28 |
| 2024-03-22 | -13.14 |
| 2024-04-16 | -13.86 |
| 2024-05-08 | -13.08 |
| 2024-05-31 | -12.88 |
| 2024-06-25 | -12.91 |
| 2024-07-18 | -12.56 |
| 2024-08-09 | -11.93 |
| 2024-09-03 | -11.19 |
| 2024-09-25 | -10.97 |
| 2024-10-17 | -11.19 |
| 2024-11-08 | -12.25 |
| 2024-12-03 | -12.16 |
| 2024-12-26 | -12.76 |
| 2025-01-22 | -13.01 |
| 2025-02-13 | -11.89 |
| 2025-03-10 | -12.03 |
| 2025-04-01 | -12.13 |
| 2025-04-24 | -12.85 |
| 2025-05-16 | -12.70 |
| 2025-06-10 | -12.75 |
| 2025-07-03 | -12.32 |
| 2025-07-28 | -12.91 |
| 2025-08-19 | -13.03 |
| 2025-09-11 | -12.92 |
| 2025-10-03 | -13.49 |
| 2025-10-27 | -13.82 |
| 2025-11-18 | -14.73 |
| 2025-12-11 | -15.22 |
| 2026-01-06 | -15.10 |
| 2026-01-29 | -14.69 |
| 2026-02-23 | -13.73 |
| 2026-03-17 | -14.66 |
| 2026-04-09 | -14.10 |
| 2026-05-01 | -14.15 |
| 2026-05-26 | -14.15 |
| 2026-06-17 | -13.77 |
| 2026-07-13 | -14.90 |
| 2026-08-04 | -15.87 |
| 2026-08-26 | -16.95 |
| 2026-09-18 | -17.65 |
Two conditions decide how much room the reversal pattern has left. Implied single-stock volatility is elevated at 36.35 on the Cboe VIXEQ, the 74.6th percentile of its own history, while implied index volatility is 15.50, the 35.3rd percentile — single names have room to keep moving even if the index does not. Against that, the high-beta momentum cohort is +0.62% this morning versus +0.05% for the rest of the universe, which is not the direction the last three months have run. Into an expiry that clears dealer positioning and a reconstitution that reprices index membership at the close, the axis worth watching is not the index level but whether next week's leaders get handed back again.
The New York Fed's DSGE model update, released at 9:00 AM ET, held 2026 real GDP growth at 1.2%, as bea.gov reported — still well below the Survey of Professional Forecasters — revised inflation for the remainder of 2026 slightly higher, and lowered its near-term r* estimate while raising it in later years, attributing the gap to an AI-related investment boom and buoyant financial conditions. The New York Fed Staff Nowcast is due at 12:45 PM ET, tracking Q3 growth at 2.3% against that 1.2% structural path, with the main risk to watch the upward inflation revisions tied to energy prices and tariffs.
Variance decomposition: live intraday — 20260918 session, bracketed against its trailing-year range. Factor returns are trailing through last close. Total cross-sectional dispersion: 0.4%ile of the past year.
Variance mix — % of total, today vs 1d ago vs 1-yr avg
market 9.6%ile style 31%ile thematic 61%ile idiosyncratic 87%ile
Variance explained — today vs. factor's trailing-year range
Marker = the factor's share of today's total variance, placed in its own trailing-year range (box 25–75%ile, ticks 90%ile and max). Amber marker = unusually load-bearing today (≥90%ile of its own year). Factor name green = up today / red = down.
Correlation & dispersion — realized vs implied
Pairwise realized correlation (20d): 9.15% 6.5%ile since 2020 · 79%ile 3m
Top-500 pairwise: 8.66% 5.5%ile since 2020 · 41%ile 3m · implied (Cboe COR1M): 10.79 4.8%ile of its own history (gap -2.1pp)
Realized 20d vol (ann. pts): all stocks 38 vs VIXEQ 36 · index 10 vs VIX 16 · style factors 18 64%ile
20-day window (19 completed days + today); percentiles vs model history since 2020; '3m' tokens rank vs the trailing 63 trading days; definitions in Terms below. Implied prints (Cboe) are delayed ~15 min. as of 08:58 ET
High-beta momentum cohort (eq-wt, since-2020 rank): +0.6% 58%ile · rest of market +0.1%
| Factor | Today | 1d | 5d | 20d | 60d |
|---|---|---|---|---|---|
| Style-Risk | |||||
| International | -0.17% z-0.6 | +0.22% | -0.14% | +0.75% | +1.61% |
| Residual Volatility | +0.14% z+0.3 | +0.32% | +1.53% | +1.05% | +4.71% |
| Beta | +0.26% z+0.3 | +1.52% | +0.01% | +1.20% | -6.63% |
| Style | |||||
| Leverage | -0.05% z-0.3 | +0.01% | -0.46% | -0.86% | -4.16% |
| Value | +0.06% z+0.2 | -0.12% | -0.36% | -0.11% | -0.62% |
| Size | -0.07% z-0.2 | +0.12% | +0.31% | +2.00% | +1.27% |
| Profitability | -0.02% z-0.1 | -0.17% | -0.40% | -1.00% | -2.83% |
| Growth | +0.03% z+0.1 | -0.19% | -0.01% | -0.40% | +1.80% |
| Dividend Yield | -0.01% z-0.1 | +0.28% | +0.05% | +0.03% | -0.07% |
| Liquidity | +0.02% z+0.1 | +0.06% | -0.15% | +0.74% | +2.02% |
| Style-Momentum | |||||
| One-Day Momentum | -0.04% z-0.1 | +0.07% | -1.12% | -2.33% | -2.37% |
| Long-Term Momentum | -0.07% z-0.1 | +0.59% | +0.48% | +1.45% | -4.41% |
| Short-Term Momentum | +0.02% z+0.1 | -0.06% | -0.64% | -1.37% | -8.65% |
| Medium-Term Momentum | +0.01% z+0.1 | +0.28% | +0.33% | -0.08% | -0.36% |
| Style-Positioning | |||||
| Hedge-Fund Ownership | +0.05% z+0.5 | -0.10% | -0.32% | -0.70% | +0.29% |
| Short Interest | +0.03% z+0.2 | +0.00% | +0.13% | -0.59% | -0.54% |
| Style-Flow | |||||
| Morning Activity | -0.04% z-0.3 | +0.23% | +0.25% | +0.50% | +2.64% |
| Short-Sale Activity | -0.00% z-0.0 | +0.01% | +0.11% | +0.39% | +0.92% |
| Thematic | |||||
| China | +0.15% z+0.4 | -0.14% | -0.18% | -0.08% | +1.22% |
| Bitcoin / Crypto | +0.11% z+0.4 | -0.07% | +0.41% | +1.53% | +2.31% |
| Treasury (Duration) | -0.07% z-0.2 | +0.17% | +0.01% | -1.99% | -1.08% |
| Gold | +0.05% z+0.1 | +0.44% | +0.28% | +0.65% | +5.04% |
| Semiconductors | -0.06% z-0.1 | +0.19% | -0.99% | +0.16% | -6.39% |
| Oil | -0.02% z-0.0 | +0.38% | +0.01% | +1.81% | +5.99% |
5/20/60d windows include today's session; 1d is the previous session.
Market variance share. The fraction of cross-sectional variance explained by the market factor — the attribution companion to pairwise correlation, not a substitute for it.
Factor z-score. Today's factor return divided by its daily-return standard deviation over ~1,600 trading days.
High-beta momentum cohort. US names above $2B market cap in the top quintile of both raw beta and 12-month momentum; membership frozen at each month's first business day. “Top 50” = the 50 strongest by combined rank.
VIXEQ / DSPX / COR1M. Cboe implied indices: single-stock volatility, dispersion, and 1-month implied correlation (top-50 S&P names). Quotes delayed ~15 minutes.
Data compiled by FactorPulse AI; edited and verified by Jeff Klein. For informational purposes only. Does not constitute financial advice, an investment recommendation, or an offer to buy or sell any securities. Always consult a qualified financial professional before making investment decisions.
For more on factor construction methodology, see www.factorpulse.com/glossary.