Investors spent Friday selling whatever had worked the week before: last week's biggest gainers slipped about 1% while last week's laggards held flat, and the most heavily shorted stocks trailed the pack. Yet riskier names rose anyway, so this was a reshuffle inside the risk trade rather than a retreat from it. Bitcoin did the heavy lifting, climbing almost 6% to about $81,000 and dragging crypto-linked stocks along: bitcoin holder Strategy jumped 16%, exchange Coinbase gained 12%, miner MARA rose 14%, and broker Robinhood added 9% after the SEC granted it a five-year exemption to trade tokenized U.S. stocks on its blockchain venue. Chipmakers also rallied, with the sector's biggest names up about 2%. Roughly $7 trillion of options expired at the close alongside the S&P's quarterly rebalance, but it showed up in trading volume rather than prices—the S&P 500 finished essentially flat.
Bonds were the day's one broad headwind. The 10-year Treasury yield finished at 5%, up about 6 basis points, with the 2-year near 4.75%, after the Bank of Japan raised rates to 1.25% on a 7-2 vote overnight. Oil went the other way, with crude down 2% to just under $100 in a third straight decline. Among individual stocks, steelmaker Nucor fell 6% after forecasting third-quarter earnings below Wall Street estimates, pulling rival Steel Dynamics down 4% and the materials sector into the red. Drug developer Xenon Pharmaceuticals plunged 31% after pausing enrollment in a late-stage trial of its depression treatment over safety findings, prompting Deutsche Bank to downgrade the stock.
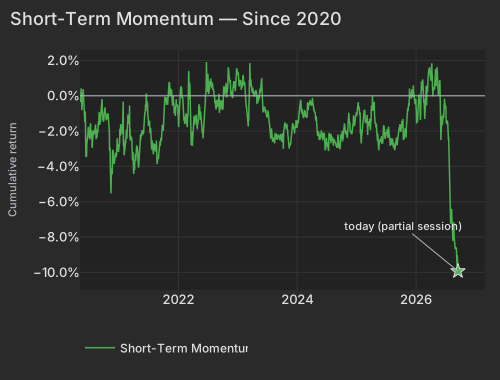
The bigger picture is a pattern three months in the making: since late spring, each week's hottest stocks have been faded the following week, a stretch of reversals deeper than anything since 2020, though it has cooled since its late-August peak. It looks like hedge funds cutting and then rebuilding leverage over the summer rather than a verdict on any one company—and stocks favored by hedge funds actually outperformed Friday. Market-wide fear is low, with the VIX near 15 and well off its early-September high, even as individual stocks remain jumpy. On the economy, the New York Fed's nowcast kept fourth-quarter growth at 2.6% and third-quarter at 2.3%, while its longer-range model nudged 2026 core inflation up to 3.3% from 3.1%, a stickier path than Wall Street forecasts assume.
Friday's cross-section punished whatever had worked in the preceding week and rewarded almost everything else. Short-Term Momentum printed -0.51% at z=-1.7, and the faster companion agreed: One-Day Momentum, the factor that asks whether yesterday's movers kept going, came in at -0.24% at z=-0.8. Qualcomm (QCOM), which sat 2.2σ into the top decile of last week's gainers, closed -5.81% and gave up $11.5B of market value with no driver in the day's coverage.
| Factor | Return | Z-Score | 5d Z | 20d Z | 63d Z | Category | Direction |
|---|---|---|---|---|---|---|---|
| Short Interest | -0.37% | -2.2 | -0.7 | -1.3 | -0.2 | Positioning | Most-shorted names lagged |
| Profitability | +0.33% | +1.8 | -0.1 | -0.8 | -1.8 | Style | Profitable names led |
| Short-Term Momentum | -0.51% | -1.7 | -1.7 | -1.4 | -3.7 | Momentum | Week-old moves reversed |
| Morning Activity | -0.20% | -1.6 | +0.3 | +0.6 | +2.3 | Flow | Habitually early names lagged |
| Hedge-Fund Ownership | +0.15% | +1.3 | -0.9 | -1.2 | +0.7 | Positioning | Hedge-fund-owned names led |
| Semiconductors | +0.74% | +1.2 | -0.1 | +0.4 | -1.3 | Thematic | Chip names led |
| Bitcoin / Crypto | +0.36% | +1.2 | +1.0 | +1.3 | +0.8 | Thematic | Crypto-linked names led |
| Beta | +0.95% | +1.0 | +0.3 | +0.4 | -1.2 | Risk | High-beta names led |
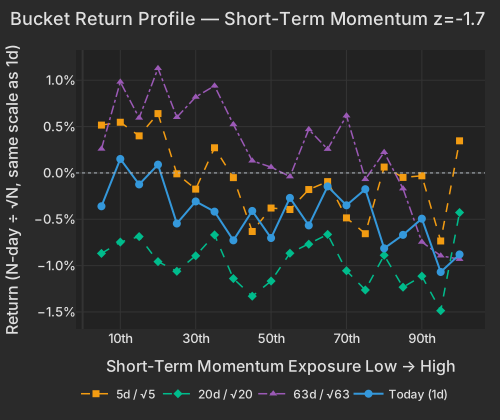
This is not a one-day quirk. The 5-day trend factor has run -9.19% over the trailing 60 sessions, and its slope is negative at every lookback the buckets measure — a 63-day rank correlation of -0.79 between exposure and return. The names most exposed to last week's move have been marked down consistently for a quarter, whichever names those happened to be in any given week.
| Date | Cumret Pct |
|---|---|
| 2020-05-06 | 0.05 |
| 2020-05-29 | -0.94 |
| 2020-06-22 | -2.25 |
| 2020-07-15 | -2.29 |
| 2020-08-06 | -1.85 |
| 2020-08-28 | -1.45 |
| 2020-09-22 | -1.28 |
| 2020-10-14 | -1.24 |
| 2020-11-05 | -2.92 |
| 2020-11-30 | -3.69 |
| 2020-12-22 | -2.40 |
| 2021-01-15 | -1.91 |
| 2021-02-09 | -2.79 |
| 2021-03-04 | -1.58 |
| 2021-03-26 | -3.18 |
| 2021-04-20 | -2.80 |
| 2021-05-12 | -2.52 |
| 2021-06-04 | -1.28 |
| 2021-06-28 | -1.03 |
| 2021-07-21 | -3.04 |
| 2021-08-12 | -2.74 |
| 2021-09-03 | -3.08 |
| 2021-09-28 | -1.71 |
| 2021-10-20 | -0.50 |
| 2021-11-11 | 0.35 |
| 2021-12-06 | -0.51 |
| 2021-12-29 | -0.53 |
| 2022-01-21 | 0.45 |
| 2022-02-14 | -1.44 |
| 2022-03-09 | -0.19 |
| 2022-03-31 | -2.10 |
| 2022-04-25 | -1.43 |
| 2022-05-17 | -1.37 |
| 2022-06-09 | -1.32 |
| 2022-07-05 | 0.80 |
| 2022-07-27 | 0.43 |
| 2022-08-18 | -0.53 |
| 2022-09-12 | -0.97 |
| 2022-10-04 | -0.74 |
| 2022-10-26 | -0.09 |
| 2022-11-17 | 0.90 |
| 2022-12-12 | 0.44 |
| 2023-01-05 | 1.32 |
| 2023-01-30 | 0.48 |
| 2023-02-22 | -0.12 |
| 2023-03-16 | 0.75 |
| 2023-04-10 | 0.14 |
| 2023-05-02 | -0.14 |
| 2023-05-24 | 0.25 |
| 2023-06-16 | -0.62 |
| 2023-07-12 | -1.15 |
| 2023-08-03 | -2.40 |
| 2023-08-25 | -2.30 |
| 2023-09-19 | -2.52 |
| 2023-10-11 | -2.41 |
| 2023-11-02 | -1.94 |
| 2023-11-27 | -2.51 |
| 2023-12-19 | -1.97 |
| 2024-01-12 | -1.26 |
| 2024-02-06 | -1.11 |
| 2024-02-29 | -1.20 |
| 2024-03-22 | -0.24 |
| 2024-04-16 | -0.73 |
| 2024-05-08 | -2.21 |
| 2024-05-31 | -2.23 |
| 2024-06-25 | -2.91 |
| 2024-07-18 | -2.35 |
| 2024-08-09 | -2.59 |
| 2024-09-03 | -2.94 |
| 2024-09-25 | -2.84 |
| 2024-10-17 | -1.75 |
| 2024-11-08 | -2.13 |
| 2024-12-03 | -2.18 |
| 2024-12-26 | -1.23 |
| 2025-01-22 | -1.09 |
| 2025-02-13 | -1.32 |
| 2025-03-10 | -1.09 |
| 2025-04-01 | -1.38 |
| 2025-04-24 | -1.38 |
| 2025-05-16 | -2.82 |
| 2025-06-10 | -2.66 |
| 2025-07-03 | -2.08 |
| 2025-07-28 | -2.53 |
| 2025-08-19 | -2.65 |
| 2025-09-11 | -2.58 |
| 2025-10-03 | -1.94 |
| 2025-10-27 | -2.20 |
| 2025-11-18 | -0.61 |
| 2025-12-11 | 0.29 |
| 2026-01-06 | -0.84 |
| 2026-01-29 | -1.02 |
| 2026-02-23 | -0.21 |
| 2026-03-17 | 0.30 |
| 2026-04-09 | 1.56 |
| 2026-05-01 | 0.96 |
| 2026-05-26 | 0.43 |
| 2026-06-17 | -1.11 |
| 2026-07-13 | -1.46 |
| 2026-08-04 | -6.48 |
| 2026-08-26 | -7.97 |
| 2026-09-18 | -9.93 |
The membership of that basket rebuilds every week, which is what makes the run interpretable: each leg of the last three months has been faded in turn, not one position sold down repeatedly. Implied single-stock volatility is still high at 36.3 (Cboe VIXEQ, 74.5th percentile of its own history) while implied index volatility has come off — VIX at 14.9, 16% below its 20-session high of 17.84 set September 10. Hedge funds have been rebuilding gross leverage off late-summer lows after the earlier de-riskingFederal Reserve. A multi-week reversion run this deep, through that sequence, is indicative of deleveraging-and-releveraging churn rather than a view on any single name.
| Bucket | Ret 1D Pct | Ret 5D Norm Pct | Ret 20D Norm Pct | Ret 63D Norm Pct |
|---|---|---|---|---|
| 1 | -0.36 | 0.52 | -0.87 | 0.26 |
| 2 | 0.15 | 0.55 | -0.75 | 0.98 |
| 3 | -0.12 | 0.40 | -0.69 | 0.59 |
| 4 | 0.09 | 0.64 | -0.96 | 1.13 |
| 5 | -0.55 | -0.01 | -1.06 | 0.60 |
| 6 | -0.31 | -0.17 | -0.89 | 0.82 |
| 7 | -0.42 | 0.27 | -0.67 | 0.94 |
| 8 | -0.73 | -0.05 | -1.14 | 0.52 |
| 9 | -0.41 | -0.63 | -1.33 | 0.13 |
| 10 | -0.70 | -0.38 | -1.17 | 0.06 |
| 11 | -0.27 | -0.39 | -0.87 | -0.04 |
| 12 | -0.57 | -0.18 | -0.77 | 0.47 |
| 13 | -0.15 | -0.09 | -0.66 | 0.26 |
| 14 | -0.35 | -0.48 | -1.06 | 0.62 |
| 15 | -0.18 | -0.66 | -1.26 | -0.07 |
| 16 | -0.81 | 0.06 | -0.89 | 0.22 |
| 17 | -0.67 | -0.05 | -1.23 | -0.17 |
| 18 | -0.49 | -0.03 | -1.11 | -0.75 |
| 19 | -1.07 | -0.73 | -1.49 | -0.89 |
| 20 | -0.88 | 0.35 | -0.43 | -0.93 |
The 20-day z of z=-1.4 is materially milder than the 63-day reading, and the worst window was set through August 28 — the run has cooled from its summer extreme. Today's tape also refuses the de-risking read: Hedge-Fund Ownership paid +0.15% at z=+1.3 and +0.16% on a raw basis, and MTUM closed +1.14%.
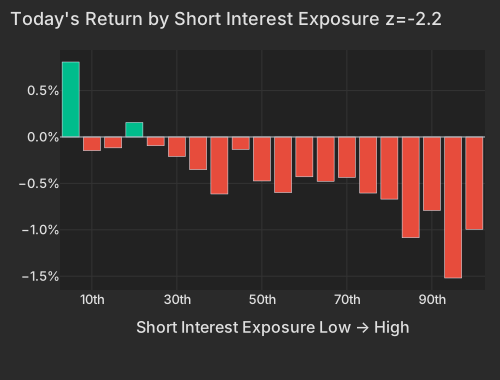
The day's highest-conviction print was positioning, not direction. Short Interest returned -0.37% at z=-2.2, with the bottom decile — names carrying almost no reported short interest — up +0.8% while the most heavily shorted lagged. That is the model's largest persistent style drag doing exactly what it does, and it carried 1.59% of the session's cross-sectional variance, inside the top decile of its own year. Paired with the Beta bid, it leans toward appetite for risk, not away from it.
| Bucket | Avg Ret Pct |
|---|---|
| 1 | 0.81 |
| 2 | -0.15 |
| 3 | -0.12 |
| 4 | 0.16 |
| 5 | -0.09 |
| 6 | -0.21 |
| 7 | -0.35 |
| 8 | -0.61 |
| 9 | -0.13 |
| 10 | -0.47 |
| 11 | -0.60 |
| 12 | -0.43 |
| 13 | -0.48 |
| 14 | -0.44 |
| 15 | -0.60 |
| 16 | -0.67 |
| 17 | -1.09 |
| 18 | -0.79 |
| 19 | -1.52 |
| 20 | -0.99 |
The extreme example sits 2.7σ into the most-shorted end: Xenon Pharmaceuticals (XENE) closed -30.86%, erasing $1.7B of market value, after the company paused Phase 3 enrollment for azetukalner in depression on neuropsychiatric safety findings and Deutsche Bank cut the stock to Hold.
Bitcoin traded at $81,011 as of 4:11 PM ET, up +5.88% on the dayCNBCEconomic Times. The equity proxies went further than the Bitcoin/Crypto factor's +0.36% at z=+1.2 would carry: Strategy (MSTR) closed +16.38% and added $8.8B of market value, Coinbase (COIN) +11.57%, MARA Holdings +13.54% — overwhelmingly their own moves rather than the thematic complex. Robinhood (HOOD) closed +9.15% after the SEC granted a five-year innovation exemption for on-chain trading of tokenized U.S. stocks, the regulatory clearance its Layer-2 venue needed.
| ETF | Theme | Today | 1d Ago | 5d Ago | 20d Ago | 63d Ago |
|---|---|---|---|---|---|---|
| WGMI | crypto miners | +6.62% | +3.68% | +1.36% | +2.30% | -32.79% |
| BITO | crypto | +6.13% | +0.59% | -0.87% | +11.25% | +18.22% |
| DRAM | memory chips & storage | +3.29% | +4.43% | -1.33% | +4.79% | -17.40% |
| SMH | semiconductors | +2.02% | +2.76% | +0.06% | -0.06% | -10.15% |
| MTUM | momentum | +1.14% | +2.10% | +1.18% | +0.28% | -6.56% |
| IGV | software | -1.36% | +0.78% | +4.53% | +2.89% | +18.64% |
| XLU | utilities | -1.20% | +0.90% | -1.95% | -5.29% | -5.63% |
| NLR | nuclear power | -2.61% | +2.99% | -6.16% | -6.07% | -11.30% |
The thematic factors carried 5.7% of the session's cross-sectional variance, the 87.8th percentile since 2020 — crypto and chips both moving hard on their own stories. The Semiconductors factor added +0.74% at z=+1.2 with its top-exposure decile up +2.0%; Lumentum (LITE) +3.99% and Silicon Motion (SIMO) +6.82% were carried almost entirely by the day's beta and chip complex rather than anything company-specific.
Roughly $7 trillion of options notional expired alongside the S&P quarterly reconstitution at the closeBloomberg. It showed up in the volume rather than the prices: IWB traded at 7.0× the typical session pace, IJR at 3.8×, MDY at 2.4×, while SPY closed the regular session +0.12%. Sandisk (SNDK) closed +10.89% ahead of its entry into the S&P 100 on MondayBloomberg, with roughly half of that move coming through the beta and liquidity axes rather than the index news.
Rates gave the session its only broad headwind: the 10-year finished at 5.004%, up 5.7 bps, with the 2-year at 4.754% and up 6.4 bps — the front end led, and TLT closed -0.68%CNBC. The Bank of Japan's hike to 1.25% on a 7-2 vote set the tone overnightBloomberg. Crude went the other way, WTI at $99.71 and down -2.16% in a third consecutive daily declineCNBCBloomberg.
Steel took the worst of the single-name damage outside health care: Nucor (NUE) closed -6.20% after guiding Q3 EPS to $5.55–$5.65, below consensusEconomic Times, with Steel Dynamics (STLD) -4.15% and the materials sector at -0.85%. Positioning data covering the September 15 session put aggregate CTA exposure to U.S. equities at a +1.1 z-score, down from +2.4 in late August — programmatic supply into quarter-end has room to run against a reversion pattern that is already three months old.
The S&P quarterly rebalance, effective at the 4:00 PM ET close, pushed multi-billion-dollar passive trades through the closing cross alongside the triple-witching expiryBloomberg. The New York Fed Staff Nowcast, released at 12:45 PM ET, held Q4 GDP bea.gov growth at 2.6% with Q3 unchanged at 2.3%. The New York Fed's DSGE update at 9:00 AM ET kept 2026 growth at 1.2% and revised 2026 core PCE bea.gov inflation up to 3.3% from 3.1% in June, a more persistent inflation path than the private-sector consensus carries.
Variance decomposition: live intraday — 20260918 session, bracketed against its trailing-year range. Factor returns are trailing through last close. Total cross-sectional dispersion: 17%ile of the past year.
Variance mix — % of total, today vs 1d ago vs 1-yr avg
market 28%ile style 68%ile thematic 92.8%ile idiosyncratic 43%ile
Variance explained — today vs. factor's trailing-year range
Marker = the factor's share of today's total variance, placed in its own trailing-year range (box 25–75%ile, ticks 90%ile and max). Amber marker = unusually load-bearing today (≥90%ile of its own year). Factor name green = up today / red = down.
Correlation & dispersion — realized vs implied
Pairwise realized correlation (20d): 9.06% 6.4%ile since 2020 · 78%ile 3m
Top-500 pairwise: 8.38% 5.0%ile since 2020 · 40%ile 3m · implied (Cboe COR1M): 9.59 3.5%ile of its own history (gap -1.2pp)
Realized 20d vol (ann. pts): all stocks 38 vs VIXEQ 36 · index 10 vs VIX 15 · style factors 18 66%ile
20-day window (19 completed days + today); percentiles vs model history since 2020; '3m' tokens rank vs the trailing 63 trading days; definitions in Terms below. Implied prints (Cboe) are delayed ~15 min. as of 15:58 ET
Top 50 high-beta momentum names (eq-wt, since-2020 rank): +2.5% 82%ile · rest of market -0.7%
| Factor | Today | 1d | 5d | 20d | 60d |
|---|---|---|---|---|---|
| Style-Risk | |||||
| Beta | +0.95% z+1.0 | +1.52% | +0.71% | +1.89% | -5.94% |
| International | -0.13% z-0.4 | +0.22% | -0.10% | +0.79% | +1.65% |
| Residual Volatility | -0.09% z-0.2 | +0.32% | +1.30% | +0.82% | +4.48% |
| Style | |||||
| Profitability | +0.33% z+1.8 | -0.17% | -0.05% | -0.65% | -2.48% |
| Liquidity | +0.38% z+1.4 | +0.06% | +0.22% | +1.10% | +2.39% |
| Size | +0.32% z+0.9 | +0.12% | +0.69% | +2.39% | +1.66% |
| Dividend Yield | +0.15% z+0.9 | +0.28% | +0.21% | +0.19% | +0.10% |
| Leverage | -0.13% z-0.8 | +0.01% | -0.54% | -0.94% | -4.24% |
| Growth | +0.08% z+0.3 | -0.19% | +0.05% | -0.35% | +1.86% |
| Value | -0.01% z-0.0 | -0.12% | -0.43% | -0.18% | -0.68% |
| Style-Momentum | |||||
| Short-Term Momentum | -0.51% z-1.7 | -0.06% | -1.17% | -1.90% | -9.19% |
| One-Day Momentum | -0.24% z-0.8 | +0.07% | -1.32% | -2.53% | -2.57% |
| Long-Term Momentum | +0.22% z+0.3 | +0.59% | +0.78% | +1.74% | -4.12% |
| Medium-Term Momentum | -0.01% z-0.0 | +0.28% | +0.30% | -0.11% | -0.39% |
| Style-Positioning | |||||
| Short Interest | -0.37% z-2.2 | +0.00% | -0.27% | -0.99% | -0.95% |
| Hedge-Fund Ownership | +0.15% z+1.3 | -0.10% | -0.23% | -0.61% | +0.38% |
| Style-Flow | |||||
| Morning Activity | -0.20% z-1.6 | +0.23% | +0.10% | +0.34% | +2.48% |
| Short-Sale Activity | +0.02% z+0.2 | +0.01% | +0.14% | +0.42% | +0.95% |
| Thematic | |||||
| Semiconductors | +0.74% z+1.2 | +0.19% | -0.19% | +0.96% | -5.59% |
| Bitcoin / Crypto | +0.36% z+1.2 | -0.07% | +0.65% | +1.77% | +2.56% |
| China | +0.43% z+1.1 | -0.14% | +0.09% | +0.19% | +1.49% |
| Treasury (Duration) | -0.23% z-0.7 | +0.17% | -0.14% | -2.15% | -1.24% |
| Gold | +0.17% z+0.5 | +0.44% | +0.40% | +0.77% | +5.16% |
| Oil | -0.05% z-0.1 | +0.38% | -0.02% | +1.78% | +5.95% |
5/20/60d windows include today's session; 1d is the previous session.
Factor z-score. Today's factor return divided by its daily-return standard deviation over ~1,600 trading days.
VIXEQ / DSPX / COR1M. Cboe implied indices: single-stock volatility, dispersion, and 1-month implied correlation (top-50 S&P names). Quotes delayed ~15 minutes.
Data compiled by FactorPulse AI; edited and verified by Jeff Klein. For informational purposes only. Does not constitute financial advice, an investment recommendation, or an offer to buy or sell any securities. Always consult a qualified financial professional before making investment decisions.
For more on factor construction methodology, see www.factorpulse.com/glossary.