The riskiest, most beaten-down corners of the stock market led heading into Thursday's open, a day after the Federal Reserve raised interest rates for the first time since 2023. The Fed's quarter-point move, approved unanimously, took its target range to 3.75%–4%, and Treasury yields actually slipped in response, with the 10-year settling just under 5%. A reassuring jobs report helped: new unemployment claims came in at 196,000, well below the 208,000 economists expected, suggesting the Fed is tightening into a labor market that isn't shedding workers. That combination sent the market's most volatile stocks up nearly 4% before the bell, while the steadier names barely moved.
The catch is that these are the same stocks investors have been buying and then abandoning all quarter. The morning's leaders were the summer's biggest losers: crypto miners rose more than 5% after losing over a third of their value in the past three months, and chipmakers including Nvidia and Broadcom climbed 2% to 3% after a double-digit slide. Uranium and AI power-infrastructure plays told the same story. Meanwhile the quarter's winners went the other way — oil fell about 2% to just under $100 a barrel after Saudi Arabia offered extra shipments through the Strait of Hormuz, and gold jumped 2.6% to about $4,370 an ounce as investors treated the hike as already priced in.
The day's standout was generator maker Generac, which surged 32% after Amazon took warrants on up to $340 million of its stock, tied to supplying backup power for Amazon's data centers. Waste hauler GFL Environmental gained 8% amid competing private-equity approaches, with its chief executive saying he would consider offers above the current share price. One note of caution came from Goldman Sachs, whose prime-brokerage desk reported that hedge funds were net sellers of global stocks through August and September — and there is little sign yet of big money stepping in to buy the rebound, with trading in the leading names running lighter than the broader market.
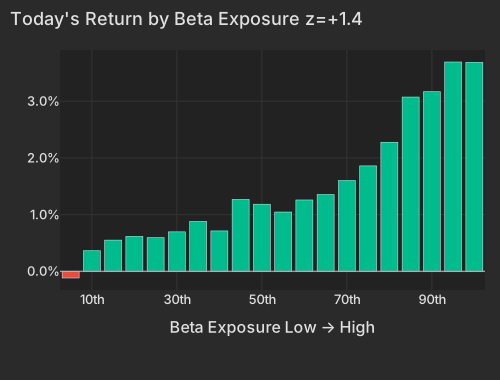
These are pre-open marks, with the bell still ahead. Beta accounts for 28.5% of this morning's cross-sectional variance, above the 90th percentile of its own past year, and it is the only style axis with a decisive print. The shape is one-sided: the top beta bucket is up +3.7% while the low-exposure end sits still. Rates supplied the trigger — the FOMC the Federal Reserve voted 12-0 on Wednesday to lift the target range 25 bp to 3.75%–4.00%Federal Reserve, and the curve has since backed off, with the 5-year down 5.8 bp to 4.797%CNBC. Initial claims the BLS at 196,000 against a 208,000 consensus removed the growth worry from the equation.
| Factor | Return | Z-Score | 5d Z | 20d Z | 63d Z | Category | Direction |
|---|---|---|---|---|---|---|---|
| Beta | +1.33% | +1.4 | +0.1 | +0.1 | -1.1 | Style-Risk | High-beta names led |
| Short-Term Momentum | -0.33% | -1.1 | -1.2 | -1.1 | -3.5 | Style-Momentum | Last week's losers led |
| Gold | +0.23% | +0.7 | -0.5 | +0.5 | +1.0 | Thematic | Gold-exposed names led |
| Leverage | +0.10% | +0.6 | -1.1 | -0.8 | -2.8 | Style | Debt-heavy names firmer |
| Short Interest | -0.08% | -0.5 | -0.4 | -1.4 | +0.1 | Style-Positioning | Most-shorted names lagged |
| Hedge-Fund Ownership | -0.01% | -0.1 | -1.3 | -1.1 | +0.8 | Style-Positioning | Flat — no signal |
| Oil | -0.22% | -0.5 | -0.8 | +0.9 | +1.0 | Thematic | Oil-exposed names lagged |
| Bucket | Avg Ret Pct |
|---|---|
| 1 | -0.12 |
| 2 | 0.36 |
| 3 | 0.55 |
| 4 | 0.62 |
| 5 | 0.59 |
| 6 | 0.70 |
| 7 | 0.88 |
| 8 | 0.71 |
| 9 | 1.27 |
| 10 | 1.18 |
| 11 | 1.05 |
| 12 | 1.26 |
| 13 | 1.35 |
| 14 | 1.60 |
| 15 | 1.86 |
| 16 | 2.28 |
| 17 | 3.07 |
| 18 | 3.17 |
| 19 | 3.69 |
| 20 | 3.69 |
The names carrying it are not carrying their own stories. Aehr Test Systems is up +6.40% with essentially no company-specific component; AXT is up +5.70% on the same arithmetic. Semiconductors are where the exposure lives — SMH +2.84%, Nvidia +2.15%, Broadcom +2.46% — and that theme has been the loudest single source of cross-sectional variance over the past week, at 6.3 vol points and the 98th percentile since 2020. The sector's own news flow has not stopped either, with data-center developer LIAN preparing a roughly $500 million IPOBloomberg.
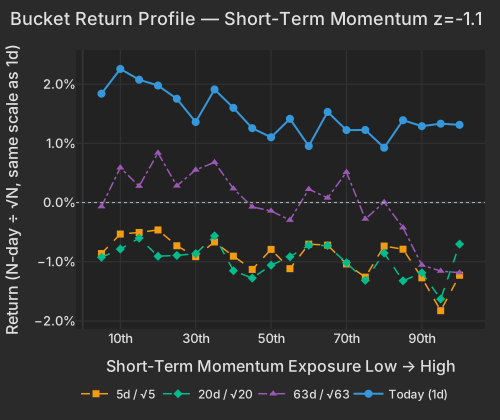
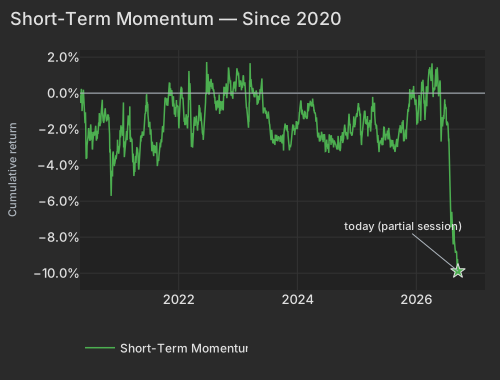
Short-Term Momentum is -0.33% at z=-1.1, and the bucket data says the reversion is coming from the bottom end: the worst recent multi-day performers are up +1.82%. That is not a one-day quirk. The factor has run -8.43% over the past 60 sessions at z=-3.5 on the 63-day window, the record of a quarter in which each week's movers were handed back to the other side. Implied index volatility at 15.46 against 17.71 at Wednesday's close, with implied single-stock volatility unchanged at 36.47, is the same configuration in options terms — a calmer index over stocks still moving hard on their own.
| Bucket | Ret 1D Pct | Ret 5D Norm Pct | Ret 20D Norm Pct | Ret 63D Norm Pct |
|---|---|---|---|---|
| 1 | 1.84 | -0.86 | -0.92 | -0.07 |
| 2 | 2.26 | -0.53 | -0.79 | 0.59 |
| 3 | 2.07 | -0.51 | -0.60 | 0.28 |
| 4 | 1.98 | -0.46 | -0.91 | 0.84 |
| 5 | 1.75 | -0.73 | -0.89 | 0.28 |
| 6 | 1.36 | -0.91 | -0.86 | 0.55 |
| 7 | 1.91 | -0.67 | -0.56 | 0.68 |
| 8 | 1.60 | -0.91 | -1.15 | 0.23 |
| 9 | 1.26 | -1.13 | -1.28 | -0.07 |
| 10 | 1.10 | -0.79 | -1.06 | -0.14 |
| 11 | 1.41 | -1.12 | -0.92 | -0.30 |
| 12 | 0.95 | -0.70 | -0.72 | 0.23 |
| 13 | 1.53 | -0.72 | -0.73 | 0.08 |
| 14 | 1.22 | -1.04 | -1.02 | 0.51 |
| 15 | 1.23 | -1.26 | -1.31 | -0.28 |
| 16 | 0.93 | -0.74 | -0.85 | 0.01 |
| 17 | 1.39 | -0.79 | -1.32 | -0.42 |
| 18 | 1.29 | -1.27 | -1.19 | -1.06 |
| 19 | 1.33 | -1.83 | -1.63 | -1.16 |
| 20 | 1.31 | -1.23 | -0.70 | -1.19 |
| Date | Cumret Pct |
|---|---|
| 2020-05-05 | -0.18 |
| 2020-05-28 | -0.74 |
| 2020-06-19 | -2.52 |
| 2020-07-14 | -2.54 |
| 2020-08-05 | -2.18 |
| 2020-08-27 | -1.66 |
| 2020-09-21 | -1.03 |
| 2020-10-13 | -1.37 |
| 2020-11-04 | -3.30 |
| 2020-11-27 | -3.60 |
| 2020-12-21 | -3.25 |
| 2021-01-14 | -2.04 |
| 2021-02-08 | -3.03 |
| 2021-03-03 | -1.41 |
| 2021-03-25 | -3.85 |
| 2021-04-19 | -3.15 |
| 2021-05-11 | -2.90 |
| 2021-06-03 | -1.69 |
| 2021-06-25 | -0.60 |
| 2021-07-20 | -2.62 |
| 2021-08-11 | -2.99 |
| 2021-09-02 | -3.53 |
| 2021-09-27 | -1.88 |
| 2021-10-19 | -0.56 |
| 2021-11-10 | -0.16 |
| 2021-12-03 | -0.57 |
| 2021-12-28 | -0.78 |
| 2022-01-20 | 0.26 |
| 2022-02-11 | -1.74 |
| 2022-03-08 | 0.74 |
| 2022-03-30 | -2.62 |
| 2022-04-22 | -1.53 |
| 2022-05-16 | -1.23 |
| 2022-06-08 | -1.67 |
| 2022-07-01 | 1.07 |
| 2022-07-26 | 0.47 |
| 2022-08-17 | -0.44 |
| 2022-09-09 | -0.75 |
| 2022-10-03 | -0.94 |
| 2022-10-25 | -0.22 |
| 2022-11-16 | 0.52 |
| 2022-12-09 | 0.37 |
| 2023-01-04 | 0.98 |
| 2023-01-27 | 0.58 |
| 2023-02-21 | -0.38 |
| 2023-03-15 | 0.72 |
| 2023-04-06 | 0.11 |
| 2023-05-01 | -0.65 |
| 2023-05-23 | 0.13 |
| 2023-06-15 | -0.83 |
| 2023-07-11 | -1.18 |
| 2023-08-02 | -2.74 |
| 2023-08-24 | -2.66 |
| 2023-09-18 | -2.52 |
| 2023-10-10 | -3.19 |
| 2023-11-01 | -1.77 |
| 2023-11-24 | -2.83 |
| 2023-12-18 | -2.33 |
| 2024-01-11 | -1.60 |
| 2024-02-05 | -1.21 |
| 2024-02-28 | -1.27 |
| 2024-03-21 | -0.46 |
| 2024-04-15 | -1.00 |
| 2024-05-07 | -2.38 |
| 2024-05-30 | -2.14 |
| 2024-06-24 | -3.23 |
| 2024-07-17 | -2.29 |
| 2024-08-08 | -2.59 |
| 2024-08-30 | -3.05 |
| 2024-09-24 | -3.09 |
| 2024-10-16 | -2.14 |
| 2024-11-07 | -2.53 |
| 2024-12-02 | -2.28 |
| 2024-12-24 | -1.76 |
| 2025-01-21 | -1.09 |
| 2025-02-12 | -1.62 |
| 2025-03-07 | -1.45 |
| 2025-03-31 | -1.90 |
| 2025-04-23 | -1.21 |
| 2025-05-15 | -2.78 |
| 2025-06-09 | -2.83 |
| 2025-07-02 | -2.32 |
| 2025-07-25 | -2.48 |
| 2025-08-18 | -3.12 |
| 2025-09-10 | -2.99 |
| 2025-10-02 | -2.22 |
| 2025-10-24 | -2.59 |
| 2025-11-17 | -1.03 |
| 2025-12-10 | 0.18 |
| 2026-01-05 | -0.89 |
| 2026-01-28 | -0.59 |
| 2026-02-20 | -0.59 |
| 2026-03-16 | 0.03 |
| 2026-04-08 | 1.15 |
| 2026-04-30 | 0.25 |
| 2026-05-22 | 0.07 |
| 2026-06-16 | -1.69 |
| 2026-07-10 | -1.79 |
| 2026-08-03 | -6.21 |
| 2026-08-25 | -7.35 |
| 2026-09-17 | -9.89 |
The high-beta momentum cohort makes the point in prices: it is up +3.53% this morning against +0.88% for everything that fits neither screen, a 94th-percentile session since 2020, with the top 50 of the group at +4.16%. The buying has spread across the group in its usual proportion rather than concentrating. Beta's exposure vector and that group overlap at 0.50, and Residual Volatility at 0.36 — the factor print and the group print are one position being marked, not two independent signals.
| ETF | Theme | Today | 1d Ago | 5d Ago | 20d Ago | 63d Ago |
|---|---|---|---|---|---|---|
| WGMI | crypto miners | +5.42% | +3.46% | -6.84% | -2.73% | -35.66% |
| AIPO | AI power infrastructure | +3.50% | +1.30% | -5.46% | -6.90% | -14.67% |
| DRAM | memory chips & storage | +3.09% | +0.58% | -10.15% | +0.42% | -18.78% |
| URA | uranium | +3.06% | -0.96% | -11.72% | -5.16% | -13.58% |
| SMH | semiconductors | +2.84% | +0.64% | -5.00% | -4.25% | -11.44% |
| SPY | large cap | +1.25% | -0.44% | -1.10% | -1.75% | +0.75% |
| XLE | energy | -0.77% | -2.88% | -1.96% | +0.55% | +16.48% |
| USO | oil | -1.82% | -3.52% | +4.13% | +19.52% | +35.25% |
| VXX | volatility | -3.93% | +0.93% | +0.71% | -6.21% | -18.34% |
Read the first column against the last: the instruments leading this morning are the ones that lost a quarter or a third of their value over the past 63 sessions, and the two that are lower — the oil complex and VIX futures — are the quarter's winners.
Goldman Sachs Prime Services reported that hedge funds were net sellers of global equities across the August–September window, with macro-product shorts accounting for 70% of the outflows. Our ownership lenses do not name a buyer stepping the other way: Hedge-Fund Ownership is flat on both the residualized and raw readings, z=-0.1 and +0.1. In Wednesday's completed session, volume in the high-beta momentum names ran below the tape's pace, and the gains were concentrated in the easiest-to-trade names, +2.08% in the top liquidity third against +0.06% in the bottom. Short Interest at -0.08%, z=-0.5, says the most-shorted names still lagged the un-shorted ones — the persistent drag is intact and nothing is being squeezed. The group closed Wednesday 21.4% below its high.
Spot gold is $4,373.37 at 9:01 AM ET, up +2.61%CNBC, with GDX +3.32% and silver's trust +3.50%; the Gold factor is +0.23% at z=+0.7, and participants read the bounce as a priced-in response to the 25 bp moveThe Wall Street Journal. The dollar index has eased to 100.08CNBC. Crude went the other way: WTI is $99.97 as of 8:52 AM ET, down -2.40%CNBC, after Saudi Arabia offered additional barrels through the Strait of HormuzNYT. Marathon Petroleum is -1.59%, with more than three-quarters of that coming from its factor exposures rather than the company.
The morning's biggest single-name move belongs to Generac, up +32.06% after Amazon obtained warrants on up to 1.69 million shares at $200.93, tied to generator deliveries for its data centersCNBC. GFL Environmental is +8.27% on competing private-equity approaches, with chief executive Patrick Dovigi telling Bloomberg Deals TV on Wednesday he would weigh bids above the share price. The exception inside the high-beta group is Fluence Energy at -23.15%: its factor exposures were worth +3.85% this morning, so the entire decline and more is the market marking the company down on its own account, and the driver is not yet carried in today's sourced coverage.
Initial Claims, released at 8:30 AM ET, showed weekly filings of 196,000 for the week ended September 12 against a 208,000 consensus, with continuing claims falling to 1.73 million and the four-week average down to 203,250 — a labor market with no visible layoff impulse into a tightening Fed.
The Philadelphia Fed Manufacturing Survey, also released at 8:30 AM ET, printed 37.8 against a consensus of 31.3, cooling from August's 47.4; the prices-paid index climbed to 48.6 and the employment index dropped to 11.8, a combination of firm activity, firmer input costs and slower hiring.
Variance decomposition: live intraday — 20260917 session, bracketed against its trailing-year range. Factor returns are trailing through last close. Total cross-sectional dispersion: 14%ile of the past year.
Variance mix — % of total, today vs 1d ago vs 1-yr avg
market 98.8%ile style 88%ile thematic 5.2%ile idiosyncratic 1.2%ile
Variance explained — today vs. factor's trailing-year range
Marker = the factor's share of today's total variance, placed in its own trailing-year range (box 25–75%ile, ticks 90%ile and max). Amber marker = unusually load-bearing today (≥90%ile of its own year). Factor name green = up today / red = down.
Correlation & dispersion — realized vs implied
Pairwise realized correlation (20d): 10.25% 9.2%ile since 2020 · 81%ile 3m
Top-500 pairwise: 9.66% 7.0%ile since 2020 · 44%ile 3m · implied (Cboe COR1M): 14.43 11%ile of its own history (gap -4.8pp)
Realized 20d vol (ann. pts): all stocks 38 vs VIXEQ 36 · index 11 vs VIX 15 · style factors 18 64%ile
20-day window (19 completed days + today); percentiles vs model history since 2020; '3m' tokens rank vs the trailing 63 trading days; definitions in Terms below. Implied prints (Cboe) are delayed ~15 min. as of 08:58 ET
High-beta momentum cohort (eq-wt, since-2020 rank): +3.5% 94.0%ile · rest of market +0.9%
| Factor | Today | 1d | 5d | 20d | 60d |
|---|---|---|---|---|---|
| Style-Risk | |||||
| Beta | +1.33% z+1.4 | +0.78% | +0.21% | +0.62% | -7.56% |
| International | +0.02% z+0.1 | -0.16% | -0.15% | +1.11% | +1.16% |
| Residual Volatility | -0.00% z-0.0 | +0.15% | +1.04% | +0.79% | +3.70% |
| Style | |||||
| Leverage | +0.10% z+0.6 | +0.25% | -0.40% | -0.60% | -3.95% |
| Profitability | +0.09% z+0.5 | +0.17% | -0.10% | -0.53% | -2.25% |
| Liquidity | +0.09% z+0.3 | -0.13% | -0.32% | +1.00% | +1.28% |
| Value | +0.04% z+0.2 | -0.15% | -0.05% | +0.16% | -0.20% |
| Dividend Yield | -0.02% z-0.1 | -0.21% | -0.33% | -0.02% | -1.03% |
| Growth | -0.02% z-0.1 | +0.15% | +0.13% | -0.24% | +2.24% |
| Size | +0.02% z+0.0 | +0.10% | +0.39% | +2.07% | +0.92% |
| Style-Momentum | |||||
| Short-Term Momentum | -0.33% z-1.1 | -0.34% | -0.85% | -1.47% | -8.43% |
| Medium-Term Momentum | -0.11% z-0.4 | -0.40% | -0.33% | -0.59% | -0.08% |
| One-Day Momentum | +0.03% z+0.1 | -0.21% | -0.89% | -1.76% | -1.78% |
| Long-Term Momentum | -0.01% z-0.0 | +0.25% | -0.15% | +1.23% | -5.36% |
| Style-Positioning | |||||
| Short Interest | -0.08% z-0.5 | -0.11% | -0.15% | -1.02% | -0.06% |
| Hedge-Fund Ownership | -0.01% z-0.1 | -0.10% | -0.31% | -0.55% | +0.52% |
| Style-Flow | |||||
| Morning Activity | +0.07% z+0.6 | -0.03% | -0.00% | +0.39% | +2.31% |
| Short-Sale Activity | -0.04% z-0.3 | -0.11% | +0.24% | +0.36% | +0.97% |
| Thematic | |||||
| Gold | +0.23% z+0.7 | -0.13% | -0.33% | +0.72% | +4.03% |
| Oil | -0.22% z-0.5 | -0.78% | -0.83% | +1.99% | +4.18% |
| Bitcoin / Crypto | -0.13% z-0.4 | -0.31% | +0.14% | +1.93% | +1.67% |
| Semiconductors | +0.20% z+0.3 | +0.42% | -0.88% | +0.55% | -6.57% |
| China | +0.12% z+0.3 | +0.01% | +0.14% | +0.25% | +0.65% |
| Treasury (Duration) | +0.05% z+0.2 | -0.08% | -0.24% | -1.96% | -0.92% |
5/20/60d windows include today's session; 1d is the previous session.
Pairwise realized correlation. Index variance net of the weighted idiosyncratic diagonal, over the cross terms — the estimator used for implied-correlation indices. 20-day window unless noted; history since 2020.
Market variance share. The fraction of cross-sectional variance explained by the market factor — the attribution companion to pairwise correlation, not a substitute for it.
Factor z-score. Today's factor return divided by its daily-return standard deviation over ~1,600 trading days.
Conditional importance. A factor's relative share of what a tree-based fit of today's stock returns explains; sums to 100% across factors.
High-beta momentum cohort. US names above $2B market cap in the top quintile of both raw beta and 12-month momentum; membership frozen at each month's first business day. “Top 50” = the 50 strongest by combined rank.
Dispersion (realized). Total cross-sectional volatility net of the market component; high dispersion is the flip side of low correlation.
Stock-specific (idiosyncratic) return. The part of a stock's move not explained by market, style, or thematic factors in our decomposition.
VIXEQ / DSPX / COR1M. Cboe implied indices: single-stock volatility, dispersion, and 1-month implied correlation (top-50 S&P names). Quotes delayed ~15 minutes.
Data compiled by FactorPulse AI; edited and verified by Jeff Klein. For informational purposes only. Does not constitute financial advice, an investment recommendation, or an offer to buy or sell any securities. Always consult a qualified financial professional before making investment decisions.
For more on factor construction methodology, see www.factorpulse.com/glossary.