The riskiest, most beaten-down corner of the stock market did the heavy lifting on Thursday, one day after the Federal Reserve delivered its first rate increase since 2023 and set its target range at 3.75% to 4%. A basket of the 50 most volatile momentum stocks jumped about 4.5% while the rest of the market barely moved, up roughly 0.2%; the S&P 500 added about 1% and small caps less than half a percent. The buying came from the end of the market favored by individual investors, not hedge funds, whose favorites lagged as prime brokers reported funds trimming exposure under funding pressure after the hike. Treasury yields fell across the board, with the 10-year note slipping to about 4.93%, and a measure of market fear dropped nearly 4%. Even so, one strong day hardly repairs the damage: that top-50 group went into the session still roughly a third below its high.
The standout mover was Generac, the backup-generator maker, which surged about 19% after Amazon agreed to a $2.4 billion supply deal for its data centers and took warrants on up to $340 million of the company's stock. Chip stocks rode the wave, with memory-chip and South Korea funds each up more than 4% and a broad semiconductor fund up nearly 3%. Gold miners gained about 3% as gold rebounded almost 2% to around $4,340 an ounce with the dollar flat. Oil went the other way, with U.S. crude falling about 1% to just above $101 a barrel after Saudi Arabia raised offers through the Strait of Hormuz. Alphabet closed up about 1% despite reports of hedge-fund selling, though communications stocks were the weakest sector, down less than 1%.
The clearest loser had nothing to do with the Fed. AutoNation, the car dealer, fell about 10% to a 52-week low after its finance chief warned that profit per new vehicle would drop 10% from the prior quarter, dragging rival dealer Lithia Motors down more than 4%. Thursday's economic data was strong: weekly jobless claims fell to 196,000, well below the 208,000 economists expected, and the Philadelphia Fed's factory survey came in at 37.8 against a 31.3 forecast, though its prices-paid gauge climbed and its employment reading fell sharply. Taken together, they point to a labor market with few layoffs heading into what could be a second rate increase.
Yields fell across every tenor the session after the FOMC the Federal Reserve's first hike since 2023, which took the target range to 3.75%–4.00%.Federal Reserve The 2-year came down 5.4 bps to 4.673% and the 10-year 7.0 bps to 4.934%.CNBC The equity response was narrow rather than broad: SPY added +1.08%, IWM +0.43%, and the high-beta winners multiplied that by four.
| Factor | Return | Z-Score | 5d Z | 20d Z | 63d Z | Category | Direction |
|---|---|---|---|---|---|---|---|
| Beta | +1.55% | z=+1.6 | +0.2 | +0.2 | -1.0 | Style-Risk | Market-sensitive names led |
| Morning Activity | +0.25% | z=+2.0 | +0.6 | +1.0 | +2.4 | Style-Flow | Habitually morning-heavy names led |
| Dividend Yield | +0.29% | z=+1.6 | -0.1 | +0.4 | -0.4 | Style | High payout led, low payout lagged |
| Gold | +0.44% | z=+1.4 | -0.2 | +0.6 | +1.1 | Thematic | Gold-exposed names led |
| Residual Volatility | +0.33% | z=+0.7 | +1.2 | +0.5 | +0.8 | Style-Risk | More volatile names led |
| Hedge-Fund Ownership | -0.10% | z=-0.9 | -1.6 | -1.3 | +0.7 | Style-Positioning | Hedge-fund-owned names lagged |
| Short-Term Momentum | -0.05% | z=-0.2 | -0.8 | -0.9 | -3.4 | Style-Momentum | Last week's leaders keep getting faded |
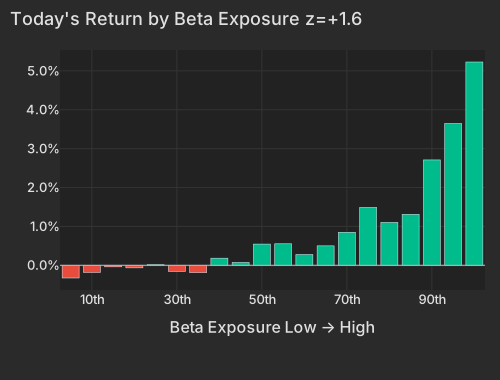
There was nothing linear about it. The highest-beta names gained +5.2% as a group while the low-beta end sat still, and the biggest single-name prints were industrial power. Generac rose +18.80% in the session, adding $1.95B of market value, after Amazon secured warrants on up to $340M of stock tied to a $2.4B backup-generator supply agreement for its data centers.CNBC Vicor gained +18.24%, mostly its own move, after disclosing a non-exclusive license of its vertical power delivery technology to a leading AI hardware maker. Elsewhere the beta complex did the work rather than the companies: MaxLinear +7.44% and Marvell +4.80% were carried almost entirely by the day's factor moves, and Intel's +7.64% was more style than story.
| Bucket | Avg Ret Pct |
|---|---|
| 1 | -0.33 |
| 2 | -0.18 |
| 3 | -0.04 |
| 4 | -0.07 |
| 5 | 0.02 |
| 6 | -0.16 |
| 7 | -0.19 |
| 8 | 0.18 |
| 9 | 0.07 |
| 10 | 0.55 |
| 11 | 0.55 |
| 12 | 0.28 |
| 13 | 0.50 |
| 14 | 0.85 |
| 15 | 1.49 |
| 16 | 1.10 |
| 17 | 1.31 |
| 18 | 2.71 |
| 19 | 3.65 |
| 20 | 5.23 |
That is the 84th-best session of 1,685 days since 2020 for the group, and the wider high-beta momentum cohort — roughly 150 names — gained +3.46%. The buying spread across the group in its usual proportion rather than concentrating in the names that most fit the profile, and in Wednesday's session the group's volume ran below the broad market's pace. One day at the 95th percentile does not repair the quarter: as of Wednesday's close the top-50 group sat 33.8% below its high, Beta has returned -7.34% over the trailing 60 sessions, and MTUM is -7.86% over 63 days.
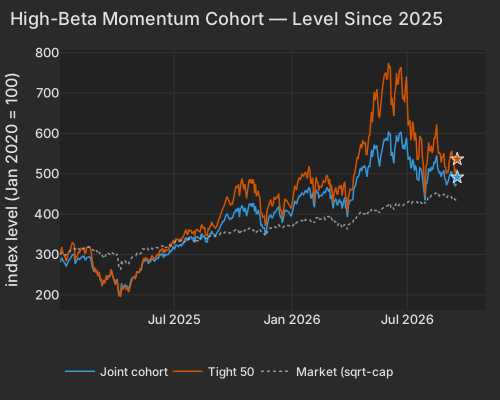
| Series | Prev Close Level |
|---|---|
| joint | 475.03 |
| tight50 | 512.85 |
| market | 433.03 |
| ETF | Theme | Today | 1d Ago | 5d Ago | 20d Ago | 63d Ago |
|---|---|---|---|---|---|---|
| DRAM | memory chips & storage | +4.47% | +0.58% | -10.15% | +0.42% | -18.78% |
| ARKK | innovation growth | +4.42% | -0.37% | -1.63% | +5.09% | +5.18% |
| EWY | south korea | +4.20% | -0.54% | -7.99% | +3.23% | -14.75% |
| GDX | gold miners | +3.18% | -1.41% | -6.71% | +4.33% | +6.37% |
| SMH | semiconductors | +2.67% | +0.64% | -5.00% | -4.25% | -11.44% |
| MTUM | momentum | +2.08% | +0.11% | -2.86% | -3.65% | -7.86% |
| SPY | large cap | +1.08% | -0.44% | -1.10% | -1.75% | +0.75% |
| IWM | small cap | +0.43% | -0.43% | -2.05% | -5.18% | -2.54% |
| XLC | communication services | -0.59% | -0.90% | +1.96% | +2.28% | +0.87% |
| VXX | volatility | -3.82% | +0.93% | +0.71% | -6.21% | -18.34% |
Morning Activity paid +0.25% at z=+2.0, the 97.6th percentile of its own history since 2020: names that habitually run volume-heavy mornings beat the names whose volume is spread evenly through the session. Small in basis points, persistent in direction — the factor has returned +2.49% over the trailing 60 sessions at z=+2.4 on the 63-day window, and the group that ripped today carries a +1.2σ tilt to exactly that characteristic, which is what licenses calling it retail-tilted. The direct positioning lens points the other way: Hedge-Fund Ownership returned -0.10% at z=-0.9, negative on a raw basis too, and negative on both the 5-day and 20-day windows. Prime-brokerage reporting this week described gross exposure coming down on funding pressure after the hike, with selling in AlphabetNYT — covered session unstated, and Alphabet itself closed +1.16% with Communication Services the weakest sector at -0.70%.
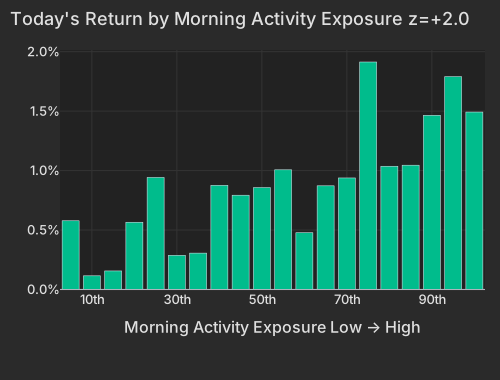
| Bucket | Avg Ret Pct |
|---|---|
| 1 | 0.58 |
| 2 | 0.11 |
| 3 | 0.16 |
| 4 | 0.57 |
| 5 | 0.94 |
| 6 | 0.29 |
| 7 | 0.31 |
| 8 | 0.88 |
| 9 | 0.79 |
| 10 | 0.86 |
| 11 | 1.01 |
| 12 | 0.48 |
| 13 | 0.87 |
| 14 | 0.94 |
| 15 | 1.91 |
| 16 | 1.04 |
| 17 | 1.05 |
| 18 | 1.46 |
| 19 | 1.79 |
| 20 | 1.49 |
Short-Term Momentum has returned -8.16% over the trailing 60 sessions at z=-3.4 on the 63-day window, with today essentially flat. Because that basket rebuilds from each prior week, the run means each week's leaders were faded in turn rather than one position being sold down for three months — and right now the high-beta winners screen as last week's losers, so today's bounce is the same pattern paying again. Single-stock implied volatility at 36.36 sits in the 74.7th percentile of its history while index volatility fell to 15.5 from 17.71, and style factors took 31.5% of cross-sectional variance against a 22.2% one-year average. The churn is running through the style axes, not the index.
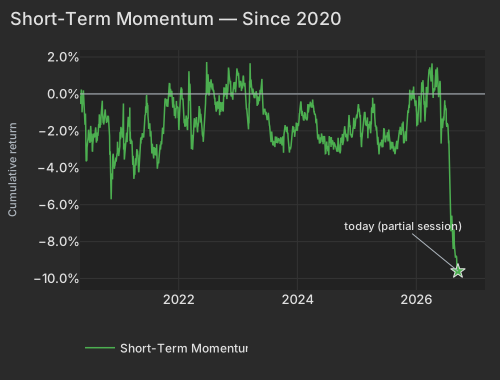
| Date | Cumret Pct |
|---|---|
| 2020-05-05 | -0.18 |
| 2020-05-28 | -0.74 |
| 2020-06-19 | -2.52 |
| 2020-07-14 | -2.54 |
| 2020-08-05 | -2.18 |
| 2020-08-27 | -1.66 |
| 2020-09-21 | -1.03 |
| 2020-10-13 | -1.37 |
| 2020-11-04 | -3.30 |
| 2020-11-27 | -3.60 |
| 2020-12-21 | -3.25 |
| 2021-01-14 | -2.04 |
| 2021-02-08 | -3.03 |
| 2021-03-03 | -1.41 |
| 2021-03-25 | -3.85 |
| 2021-04-19 | -3.15 |
| 2021-05-11 | -2.90 |
| 2021-06-03 | -1.69 |
| 2021-06-25 | -0.60 |
| 2021-07-20 | -2.62 |
| 2021-08-11 | -2.99 |
| 2021-09-02 | -3.53 |
| 2021-09-27 | -1.88 |
| 2021-10-19 | -0.56 |
| 2021-11-10 | -0.16 |
| 2021-12-03 | -0.57 |
| 2021-12-28 | -0.78 |
| 2022-01-20 | 0.26 |
| 2022-02-11 | -1.74 |
| 2022-03-08 | 0.74 |
| 2022-03-30 | -2.62 |
| 2022-04-22 | -1.53 |
| 2022-05-16 | -1.23 |
| 2022-06-08 | -1.67 |
| 2022-07-01 | 1.07 |
| 2022-07-26 | 0.47 |
| 2022-08-17 | -0.44 |
| 2022-09-09 | -0.75 |
| 2022-10-03 | -0.94 |
| 2022-10-25 | -0.22 |
| 2022-11-16 | 0.52 |
| 2022-12-09 | 0.37 |
| 2023-01-04 | 0.98 |
| 2023-01-27 | 0.58 |
| 2023-02-21 | -0.38 |
| 2023-03-15 | 0.72 |
| 2023-04-06 | 0.11 |
| 2023-05-01 | -0.65 |
| 2023-05-23 | 0.13 |
| 2023-06-15 | -0.83 |
| 2023-07-11 | -1.18 |
| 2023-08-02 | -2.74 |
| 2023-08-24 | -2.66 |
| 2023-09-18 | -2.52 |
| 2023-10-10 | -3.19 |
| 2023-11-01 | -1.77 |
| 2023-11-24 | -2.83 |
| 2023-12-18 | -2.33 |
| 2024-01-11 | -1.60 |
| 2024-02-05 | -1.21 |
| 2024-02-28 | -1.27 |
| 2024-03-21 | -0.46 |
| 2024-04-15 | -1.00 |
| 2024-05-07 | -2.38 |
| 2024-05-30 | -2.14 |
| 2024-06-24 | -3.23 |
| 2024-07-17 | -2.29 |
| 2024-08-08 | -2.59 |
| 2024-08-30 | -3.05 |
| 2024-09-24 | -3.09 |
| 2024-10-16 | -2.14 |
| 2024-11-07 | -2.53 |
| 2024-12-02 | -2.28 |
| 2024-12-24 | -1.76 |
| 2025-01-21 | -1.09 |
| 2025-02-12 | -1.62 |
| 2025-03-07 | -1.45 |
| 2025-03-31 | -1.90 |
| 2025-04-23 | -1.21 |
| 2025-05-15 | -2.78 |
| 2025-06-09 | -2.83 |
| 2025-07-02 | -2.32 |
| 2025-07-25 | -2.48 |
| 2025-08-18 | -3.12 |
| 2025-09-10 | -2.99 |
| 2025-10-02 | -2.22 |
| 2025-10-24 | -2.59 |
| 2025-11-17 | -1.03 |
| 2025-12-10 | 0.18 |
| 2026-01-05 | -0.89 |
| 2026-01-28 | -0.59 |
| 2026-02-20 | -0.59 |
| 2026-03-16 | 0.03 |
| 2026-04-08 | 1.15 |
| 2026-04-30 | 0.25 |
| 2026-05-22 | 0.07 |
| 2026-06-16 | -1.69 |
| 2026-07-10 | -1.79 |
| 2026-08-03 | -6.21 |
| 2026-08-25 | -7.35 |
| 2026-09-17 | -9.60 |
The Gold factor paid +0.44% at z=+1.4 with spot gold at $4,343.39 as of 4:11 PM ET, up +1.91%.CNBC That is a rebound from the post-decision low, and silver joined it.The Wall Street Journal Metals bid with the dollar going nowhere — DXY 100.25, unchanged on the day.CNBC Crude went the other way, WTI at $101.26 as of 4:01 PM ET, down -1.14%CNBC after Saudi Arabia raised offers through the Strait of Hormuz.NYT
The clearest loser had nothing to do with rates. AutoNation fell -10.42% in the session to a 52-week low after its CFO guided to a 10% sequential decline in third-quarter new-vehicle gross profit per unit, with peer Lithia Motors down 4.4%.The Wall Street Journal Xenon Pharmaceuticals closed the regular session +1.11% and then fell a further -12.63% in late trading after the company said it had voluntarily paused new patient enrollment in its Phase 3 psychiatry trials for azetukalner while submitting an epilepsy filing to the FDA.
Initial Claims the BLS, released at 8:30 AM ET, showed weekly filings falling to 196,000 against a 208,000 consensus, with continuing claims down to 1.73 million — a labor market with little layoff activity heading into a second possible hike.
The Philadelphia Fed Manufacturing Survey, also released at 8:30 AM ET, printed 37.8 versus a 31.3 consensus, cooling from August's 47.4; the prices-paid index climbed to 48.6 and the employment index dropped to 11.8 from 27.9.
Variance decomposition: live intraday — 20260917 session, bracketed against its trailing-year range. Factor returns are trailing through last close. Total cross-sectional dispersion: 35%ile of the past year.
Variance mix — % of total, today vs 1d ago vs 1-yr avg
market 76%ile style 88%ile thematic 20%ile idiosyncratic 18%ile
Variance explained — today vs. factor's trailing-year range
Marker = the factor's share of today's total variance, placed in its own trailing-year range (box 25–75%ile, ticks 90%ile and max). Amber marker = unusually load-bearing today (≥90%ile of its own year). Factor name green = up today / red = down.
Correlation & dispersion — realized vs implied
Pairwise realized correlation (20d): 9.53% 7.1%ile since 2020 · 81%ile 3m
Top-500 pairwise: 9.39% 6.5%ile since 2020 · 44%ile 3m · implied (Cboe COR1M): 10.83 5.0%ile of its own history (gap -1.4pp)
Realized 20d vol (ann. pts): all stocks 38 vs VIXEQ 36 · index 10 vs VIX 16 · style factors 18 64%ile
20-day window (19 completed days + today); percentiles vs model history since 2020; '3m' tokens rank vs the trailing 63 trading days; definitions in Terms below. Implied prints (Cboe) are delayed ~15 min. as of 15:58 ET
Top 50 high-beta momentum names (eq-wt, since-2020 rank): +4.6% 95.1%ile · rest of market +0.2%
| Factor | Today | 1d | 5d | 20d | 60d |
|---|---|---|---|---|---|
| Style-Risk | |||||
| Beta | +1.55% z+1.6 | +0.78% | +0.43% | +0.84% | -7.34% |
| Residual Volatility | +0.33% z+0.7 | +0.15% | +1.38% | +1.13% | +4.04% |
| International | +0.19% z+0.6 | -0.16% | +0.03% | +1.28% | +1.33% |
| Style | |||||
| Dividend Yield | +0.29% z+1.6 | -0.21% | -0.03% | +0.28% | -0.73% |
| Profitability | -0.17% z-0.9 | +0.17% | -0.36% | -0.79% | -2.52% |
| Growth | -0.20% z-0.8 | +0.15% | -0.05% | -0.42% | +2.06% |
| Value | -0.11% z-0.5 | -0.15% | -0.20% | +0.02% | -0.34% |
| Size | +0.11% z+0.3 | +0.10% | +0.48% | +2.16% | +1.01% |
| Liquidity | +0.07% z+0.3 | -0.13% | -0.34% | +0.98% | +1.26% |
| Leverage | +0.03% z+0.1 | +0.25% | -0.47% | -0.68% | -4.03% |
| Style-Momentum | |||||
| Medium-Term Momentum | +0.28% z+1.0 | -0.40% | +0.06% | -0.20% | +0.32% |
| Long-Term Momentum | +0.56% z+0.9 | +0.25% | +0.42% | +1.79% | -4.80% |
| Short-Term Momentum | -0.05% z-0.2 | -0.34% | -0.58% | -1.20% | -8.16% |
| One-Day Momentum | +0.04% z+0.1 | -0.21% | -0.88% | -1.75% | -1.77% |
| Style-Positioning | |||||
| Hedge-Fund Ownership | -0.10% z-0.9 | -0.10% | -0.40% | -0.64% | +0.43% |
| Short Interest | -0.01% z-0.1 | -0.11% | -0.08% | -0.94% | +0.02% |
| Style-Flow | |||||
| Morning Activity | +0.25% z+2.0 | -0.03% | +0.18% | +0.57% | +2.49% |
| Short-Sale Activity | +0.01% z+0.1 | -0.11% | +0.29% | +0.41% | +1.02% |
| Thematic | |||||
| Gold | +0.44% z+1.4 | -0.13% | -0.12% | +0.93% | +4.24% |
| Oil | +0.39% z+0.8 | -0.78% | -0.22% | +2.60% | +4.79% |
| Treasury (Duration) | +0.18% z+0.6 | -0.08% | -0.11% | -1.83% | -0.79% |
| China | -0.14% z-0.3 | +0.01% | -0.11% | -0.00% | +0.40% |
| Semiconductors | +0.17% z+0.3 | +0.42% | -0.90% | +0.53% | -6.59% |
| Bitcoin / Crypto | -0.07% z-0.2 | -0.31% | +0.21% | +2.00% | +1.74% |
5/20/60d windows include today's session; 1d is the previous session.
Pairwise realized correlation. Index variance net of the weighted idiosyncratic diagonal, over the cross terms — the estimator used for implied-correlation indices. 20-day window unless noted; history since 2020.
Market variance share. The fraction of cross-sectional variance explained by the market factor — the attribution companion to pairwise correlation, not a substitute for it.
Factor z-score. Today's factor return divided by its daily-return standard deviation over ~1,600 trading days.
Conditional importance. A factor's relative share of what a tree-based fit of today's stock returns explains; sums to 100% across factors.
High-beta momentum cohort. US names above $2B market cap in the top quintile of both raw beta and 12-month momentum; membership frozen at each month's first business day. “Top 50” = the 50 strongest by combined rank.
Dispersion (realized). Total cross-sectional volatility net of the market component; high dispersion is the flip side of low correlation.
Stock-specific (idiosyncratic) return. The part of a stock's move not explained by market, style, or thematic factors in our decomposition.
VIXEQ / DSPX / COR1M. Cboe implied indices: single-stock volatility, dispersion, and 1-month implied correlation (top-50 S&P names). Quotes delayed ~15 minutes.
Data compiled by FactorPulse AI; edited and verified by Jeff Klein. For informational purposes only. Does not constitute financial advice, an investment recommendation, or an offer to buy or sell any securities. Always consult a qualified financial professional before making investment decisions.
For more on factor construction methodology, see www.factorpulse.com/glossary.