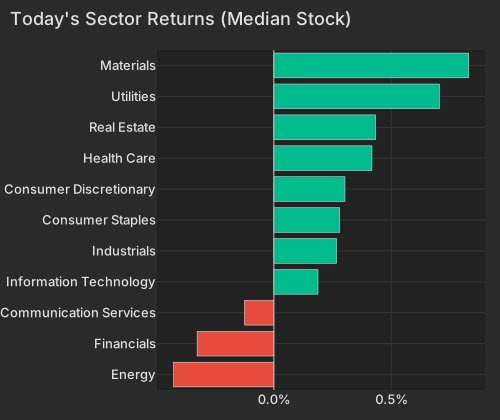
The riskiest, most heavily indebted stocks in the market were being bought Wednesday morning for the first time in a week, and traders were doing it ahead of the Federal Reserve's 2 p.m. decision rather than waiting for it. Futures put better than 90% odds on a quarter-point rate increase, which would be the first hike in three years and the first call of Kevin Warsh's tenure as Fed chair. Treasury yields fell across the board anyway, even after the government reported that August retail sales jumped 1.2%, four times what economists expected, with 12 of 13 categories higher. A strong consumer number that can't push yields up is what a fully priced rate hike looks like, and the stock market took it as permission to wade back into the names this quarter has punished hardest.
Oil did much of the work. U.S. crude fell to around $104 a barrel after the American Petroleum Institute reported a 7-million-barrel build in domestic stockpiles, and oil producers were the morning's weakest group, with exploration-and-production shares trading at several times their normal volume. The odd part is that the selling landed on a supply problem that hasn't gone away: Saudi Aramco's East-West pipeline, a key route for getting crude around the Strait of Hormuz, remains shut after drone strikes, and satellite imagery reviewed by BBC Verify suggests repairs will take five to six weeks. One week of inventory data is being weighed against a multi-week outage, and for now the inventory data is winning. Gold and copper miners sat on the other side of the trade, with gold up about 1.3% to roughly $4,350 an ounce.
Chipmakers carried the rally. Intel rose 5.5% on reports it is in early talks with South Korea's SK Hynix to make memory chips at its Ohio plant, and computer maker Dell hit a record high on a $95 billion backlog of unfilled server orders. Korean stocks and memory-chip names, which have been hammered for a month, bounced with them. The day's biggest casualty was trucking and rail-freight company JB Hunt, down 11% after warning on demand for intermodal shipping and squeezed margins. Elsewhere, crypto-linked stocks lagged the day after the Senate blocked a digital-asset regulation bill on a 49-50 vote, with bitcoin near $75,600. Both of the morning's reversals, buying risk and selling oil, are wagers on the same 2 p.m. announcement, and neither has the answer yet.
| Factor | Return | Z-Score | 5d Z | 20d Z | 63d Z | Category | Direction |
|---|---|---|---|---|---|---|---|
| Leverage | +0.22% | z=+1.3 | -2.03 | -1.08 | -2.97 | Style | More levered names outperformed |
| Beta | +0.71% | z=+0.7 | -1.09 | -0.36 | -1.14 | Style-Risk | More market-sensitive names outperformed |
| Semiconductors | +0.42% | z=+0.7 | -1.00 | -0.55 | -1.18 | Thematic | High-exposure names outperformed |
| Bitcoin / Crypto | -0.25% | z=-0.8 | +0.62 | +1.83 | +0.85 | Thematic | Crypto-linked names underperformed |
| Short-Sale Activity | -0.08% | z=-0.8 | +1.85 | +1.29 | +1.36 | Style-Flow | Yesterday's most short-sold names lagged |
| Oil | -0.36% | z=-0.8 | -0.12 | +1.29 | +1.17 | Thematic | Oil-exposed names underperformed |
| Short-Term Momentum | -0.22% | z=-0.7 | -0.89 | -0.99 | -3.20 | Style-Momentum | Last week's moves reversing |
| Short Interest | -0.08% | z=-0.5 | -0.00 | -0.41 | +0.27 | Style-Positioning | Most-shorted names lagged, no squeeze |
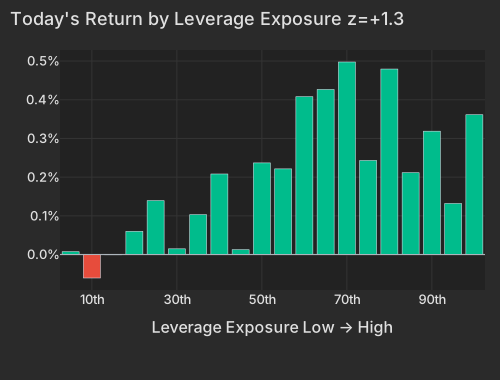
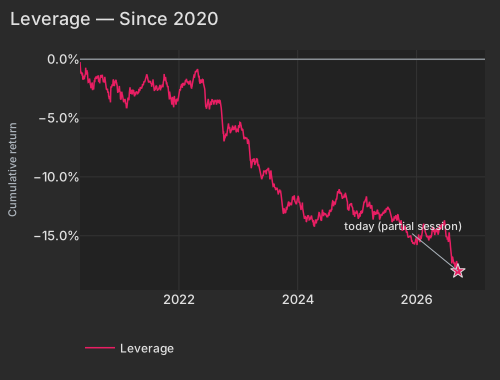
Leverage is the day's highest-conviction print at +0.22%, z=+1.33, after falling in every one of the prior five sessions. The structural context is why a 22-basis-point factor move matters: the same factor has run -3.95% over the trailing 60 sessions, at z=-2.97 on the 63-day window. Today flips the sign, not the damage.
| Bucket | Avg Ret Pct |
|---|---|
| 1 | 0.01 |
| 2 | -0.06 |
| 3 | -0.00 |
| 4 | 0.06 |
| 5 | 0.14 |
| 6 | 0.01 |
| 7 | 0.10 |
| 8 | 0.21 |
| 9 | 0.01 |
| 10 | 0.24 |
| 11 | 0.22 |
| 12 | 0.41 |
| 13 | 0.43 |
| 14 | 0.50 |
| 15 | 0.24 |
| 16 | 0.48 |
| 17 | 0.21 |
| 18 | 0.32 |
| 19 | 0.13 |
| 20 | 0.36 |
The re-sort is not a clean one. The least-levered names are sitting still rather than being sold, and the print carries no conditional importance once Beta is in the model — the balance-sheet bid is arriving with the beta bid, not separately from it. Beta itself is +0.71% against -11.79% over the trailing 60 sessions, and it accounts for 18.8% of today's cross-sectional variance. The top 50 high-beta momentum names are up +2.09% so far, against +0.10% for the names in neither screen.
| Date | Cumret Pct |
|---|---|
| 2020-05-04 | -0.24 |
| 2020-05-27 | -1.64 |
| 2020-06-18 | -1.17 |
| 2020-07-13 | -2.01 |
| 2020-08-04 | -1.58 |
| 2020-08-26 | -1.92 |
| 2020-09-18 | -1.49 |
| 2020-10-12 | -2.38 |
| 2020-11-03 | -3.12 |
| 2020-11-25 | -1.75 |
| 2020-12-18 | -2.46 |
| 2021-01-13 | -2.97 |
| 2021-02-05 | -3.46 |
| 2021-03-02 | -3.20 |
| 2021-03-24 | -2.59 |
| 2021-04-16 | -2.81 |
| 2021-05-10 | -2.37 |
| 2021-06-02 | -1.89 |
| 2021-06-24 | -1.67 |
| 2021-07-19 | -2.34 |
| 2021-08-10 | -2.47 |
| 2021-09-01 | -2.47 |
| 2021-09-24 | -2.37 |
| 2021-10-18 | -2.06 |
| 2021-11-09 | -3.10 |
| 2021-12-02 | -3.66 |
| 2021-12-27 | -3.57 |
| 2022-01-19 | -2.33 |
| 2022-02-10 | -1.86 |
| 2022-03-07 | -2.10 |
| 2022-03-29 | -1.95 |
| 2022-04-21 | -0.91 |
| 2022-05-13 | -1.78 |
| 2022-06-07 | -2.08 |
| 2022-06-30 | -3.72 |
| 2022-07-25 | -3.44 |
| 2022-08-16 | -3.54 |
| 2022-09-08 | -3.72 |
| 2022-09-30 | -6.34 |
| 2022-10-24 | -6.54 |
| 2022-11-15 | -6.28 |
| 2022-12-08 | -5.94 |
| 2023-01-03 | -6.13 |
| 2023-01-26 | -6.09 |
| 2023-02-17 | -6.68 |
| 2023-03-14 | -7.75 |
| 2023-04-05 | -8.46 |
| 2023-04-28 | -8.49 |
| 2023-05-22 | -9.99 |
| 2023-06-14 | -9.50 |
| 2023-07-10 | -9.42 |
| 2023-08-01 | -10.47 |
| 2023-08-23 | -11.11 |
| 2023-09-15 | -11.09 |
| 2023-10-09 | -13.10 |
| 2023-10-31 | -12.75 |
| 2023-11-22 | -12.36 |
| 2023-12-15 | -11.93 |
| 2024-01-10 | -11.82 |
| 2024-02-02 | -12.65 |
| 2024-02-27 | -13.81 |
| 2024-03-20 | -13.59 |
| 2024-04-12 | -14.17 |
| 2024-05-06 | -13.59 |
| 2024-05-29 | -13.72 |
| 2024-06-21 | -13.26 |
| 2024-07-16 | -13.28 |
| 2024-08-07 | -12.13 |
| 2024-08-29 | -11.93 |
| 2024-09-23 | -11.30 |
| 2024-10-15 | -11.67 |
| 2024-11-06 | -12.78 |
| 2024-11-29 | -12.24 |
| 2024-12-23 | -13.07 |
| 2025-01-17 | -13.13 |
| 2025-02-11 | -12.44 |
| 2025-03-06 | -12.58 |
| 2025-03-28 | -12.47 |
| 2025-04-22 | -12.96 |
| 2025-05-14 | -13.13 |
| 2025-06-06 | -13.27 |
| 2025-07-01 | -12.75 |
| 2025-07-24 | -12.96 |
| 2025-08-15 | -13.60 |
| 2025-09-09 | -13.53 |
| 2025-10-01 | -13.67 |
| 2025-10-23 | -14.43 |
| 2025-11-14 | -15.14 |
| 2025-12-09 | -15.48 |
| 2026-01-02 | -15.10 |
| 2026-01-27 | -15.40 |
| 2026-02-19 | -14.12 |
| 2026-03-13 | -14.99 |
| 2026-04-07 | -14.95 |
| 2026-04-29 | -14.70 |
| 2026-05-21 | -14.46 |
| 2026-06-15 | -14.09 |
| 2026-07-09 | -15.13 |
| 2026-07-31 | -15.90 |
| 2026-08-24 | -17.42 |
| 2026-09-16 | -18.01 |
The curve is doing the work. The 2-year is 4.627%, down 3.6 basis points, and the 10-year 4.967%, down 2.9 CNBC. Every tenor is lower into a decision that futures put above a 90% probability of a 25-basis-point hikeNYT. A 1.2% retail sales beat at 8:30 failed to push them higher, which is what a fully priced hike looks like.
WTI is $104.05, -1.68% as of 9:29 ET CNBC, after the American Petroleum Institute reported a 7.1-million-barrel build in U.S. crude stockpilesNYT. The Oil factor is -0.36% at z=-0.77, cutting against a 20-day z of +1.29 — the first material give-back in a month-long run. Diamondback Energy is -6.45%, and roughly three-quarters of that is the stock's own move rather than the crude factor, with no driver named in today's coverage.
| ETF | Theme | Today | 1d Ago | 5d Ago | 20d Ago | 63d Ago |
|---|---|---|---|---|---|---|
| XOP | oil E&P | -2.61% | +3.22% | +2.99% | +8.92% | +26.11% |
| XLE | energy | -1.97% | +2.17% | +1.79% | +5.35% | +18.69% |
| USO | oil | -1.97% | +3.32% | +10.84% | +24.23% | +33.54% |
| DRAM | memory chips & storage | +1.82% | +0.38% | -9.97% | -8.91% | -22.60% |
| SMH | semiconductors | +1.33% | +0.11% | -5.51% | -8.75% | -16.22% |
| EWY | south korea | +1.32% | +0.15% | -7.07% | -4.65% | -16.53% |
| MTUM | momentum | +0.76% | -0.06% | -2.97% | -7.00% | -10.23% |
| SPY | large cap | +0.25% | -0.46% | -1.12% | -1.98% | +0.34% |
| XLF | financials | -0.47% | -0.32% | -0.79% | -1.27% | +6.14% |
| Sector | Median Ret Pct |
|---|---|
| Energy | -0.43 |
| Financials | -0.33 |
| Communication Services | -0.13 |
| Information Technology | 0.19 |
| Industrials | 0.27 |
| Consumer Staples | 0.28 |
| Consumer Discretionary | 0.30 |
| Health Care | 0.42 |
| Real Estate | 0.43 |
| Utilities | 0.71 |
| Materials | 0.83 |
The selling lands on an outage that has not been resolved. Saudi Aramco's 1,200-kilometre East-West pipeline remains shut after drone strikes damaged pumping stations, taking 4 to 5 million barrels a day of Strait-of-Hormuz bypass capacity offline, and satellite imagery reviewed by BBC Verify points to repairs running five to six weeksBloomberg. A one-week inventory print is being marked against a multi-week supply problem.
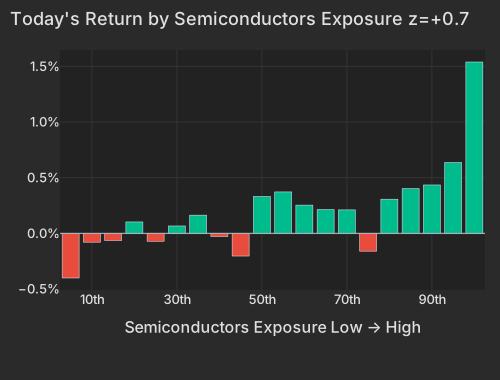
Semiconductors is +0.42% at z=+0.70 — a small return that is nonetheless the only axis today with meaningful conditional importance, at 0.163. The bid is one-sided: the highest-exposure bucket is up about 1.5% with nothing symmetric at the low-exposure end.
| Bucket | Avg Ret Pct |
|---|---|
| 1 | -0.40 |
| 2 | -0.08 |
| 3 | -0.06 |
| 4 | 0.10 |
| 5 | -0.07 |
| 6 | 0.07 |
| 7 | 0.16 |
| 8 | -0.03 |
| 9 | -0.20 |
| 10 | 0.33 |
| 11 | 0.37 |
| 12 | 0.25 |
| 13 | 0.21 |
| 14 | 0.21 |
| 15 | -0.16 |
| 16 | 0.31 |
| 17 | 0.40 |
| 18 | 0.43 |
| 19 | 0.64 |
| 20 | 1.54 |
Intel is +5.53%, adding $28.4B of market value, after reports of exploratory talks with SK Hynix to produce DRAM at its Ohio facilityBloomberg. About half of that is Intel's own move; the rest is carried by the day's beta and 12-month momentum complex. Dell is +5.42%, reported at an all-time high of $568.67 on a $95 billion unfulfilled server backlogBloomberg. United Microelectronics is +4.12%, and Lumentum and Silicon Motion led the high-exposure end on 800G transceiver and enterprise SSD controller demandBloomberg.
Semiconductor variance on the five-day blend is 6.3 vol points, the 98th percentile since 2020 — the chip axis has been the market's most load-bearing thematic for a week, in both directions, and today it is being paid rather than punished. The index leg explains 8.3% of this morning's cross-sectional variance and single names about half of it. Realized pairwise correlation remains pinned near the lows it has held for weeks, 8.35% on the 20-day blend and the 4.6th percentile since 2020, while against the past three months it sits mid-range at the 55.6th percentile. Implied one-month single-stock correlation (Cboe COR1M) at 13.59 is in the bottom 9.1% of its 20-year history.
The single-name work is where the damage is concentrated. JB Hunt is -10.67% after transport updates flagged intermodal demand and margin pressureWSJ, erasing $2.7B of market value at nearly six standard deviations of its own residual history. American Express -2.65% and Bank of America -1.79% are also almost entirely their own moves, with no driver named in today's coverage.
The 5-day reversion factor — Short-Term Momentum in the table — is -0.22% today at z=-0.72. On the 63-day window it stands at z=-3.2, having run -8.21% over the trailing 60 sessions. Each recent multi-day leg has been faded in turn, in both directions, and that is the pattern that has capped every bounce this quarter.
Implied index volatility is not relaxed into the decision either: VIX at 17.2 sits at the top of its 20-session range of 14.32 to 17.84, the high set September 10. Gold is $4,347.30, +1.27% at 9:39 ET CNBC, with the dollar index barely changed at 99.685 CNBC — the hedge is being paid alongside the equity bid. Bitcoin / Crypto is -0.25% at z=-0.81, the session after the Senate blocked the Digital Asset Market Clarity Act on a 49-50 cloture voteFT; bitcoin is $75,613 at 9:39 ET CNBC.
Both of this morning's reversals — balance-sheet risk bought, crude sold — are bets on the same 2:00 PM event, and neither of them has the event yet.
The Advance Retail Sales report, released at 8:30 AM ET, showed August receipts up 1.2% month-over-month against a 0.3% consensus and a revised 0.5% July contraction, with 12 of 13 categories higher and non-store retailers up 2.6%. Treasury yields did not follow it higher. The FOMC federalreserve.gov decision lands at 2:00 PM ET, priced above 90% for a 25-basis-point hike — the first increase in three years and Kevin Warsh's first as ChairNYT.
Variance decomposition: live intraday — 20260916 session, bracketed against its trailing-year range. Factor returns are trailing through last close. Total cross-sectional dispersion: 1.6%ile of the past year.
Variance mix — % of total, today vs 1d ago vs 1-yr avg
market 37%ile style 82%ile thematic 92.0%ile idiosyncratic 28%ile
Variance explained — today vs. factor's trailing-year range
Marker = the factor's share of today's total variance, placed in its own trailing-year range (box 25–75%ile, ticks 90%ile and max). Amber marker = unusually load-bearing today (≥90%ile of its own year). Factor name green = up today / red = down.
Correlation & dispersion — realized vs implied
Pairwise realized correlation (20d): 8.35% 4.6%ile since 2020 · 56%ile 3m
Top-500 pairwise: 7.44% 3.7%ile since 2020 · 33%ile 3m · implied (Cboe COR1M): 13.59 9.1%ile of its own history (gap -6.2pp)
Realized 20d vol (ann. pts): all stocks 39 vs VIXEQ 36 · index 10 vs VIX 17 · style factors 18 66%ile
20-day window (19 completed days + today); percentiles vs model history since 2020; '3m' tokens rank vs the trailing 63 trading days; definitions in Terms below. Implied prints (Cboe) are delayed ~15 min. as of 09:21 ET
Top 50 high-beta momentum names (eq-wt, since-2020 rank): +2.1% 78%ile · rest of market +0.1%
| Factor | Today | 1d | 5d | 20d | 60d |
|---|---|---|---|---|---|
| Style-Risk | |||||
| Beta | +0.71% z+0.7 | -0.20% | -2.36% | -1.58% | -11.79% |
| Residual Volatility | -0.14% z-0.3 | -0.20% | +0.56% | +1.04% | +3.16% |
| International | -0.02% z-0.1 | +0.06% | +0.02% | +1.43% | +0.97% |
| Style | |||||
| Leverage | +0.22% z+1.3 | -0.16% | -0.77% | -0.81% | -3.95% |
| Profitability | +0.12% z+0.6 | -0.03% | -0.23% | -0.92% | -2.93% |
| Liquidity | -0.13% z-0.5 | -0.20% | -0.31% | +1.01% | +1.17% |
| Growth | -0.07% z-0.3 | -0.10% | -0.08% | -0.59% | +2.07% |
| Value | +0.02% z+0.1 | +0.17% | -0.06% | +0.26% | -0.08% |
| Dividend Yield | +0.01% z+0.1 | +0.22% | -0.21% | +0.09% | -0.85% |
| Size | +0.02% z+0.1 | +0.17% | +0.56% | +1.50% | +0.30% |
| Style-Momentum | |||||
| Short-Term Momentum | -0.22% z-0.7 | +0.59% | -0.60% | -1.35% | -8.21% |
| Medium-Term Momentum | -0.16% z-0.6 | +0.04% | -0.08% | +0.50% | +0.27% |
| Long-Term Momentum | +0.34% z+0.5 | +0.74% | -0.33% | -0.13% | -6.37% |
| One-Day Momentum | -0.12% z-0.4 | -0.18% | -1.01% | -1.22% | -2.32% |
| Style-Positioning | |||||
| Short Interest | -0.08% z-0.5 | -0.12% | -0.00% | -0.31% | +0.17% |
| Hedge-Fund Ownership | -0.01% z-0.1 | -0.15% | -0.30% | -0.20% | +0.69% |
| Style-Flow | |||||
| Short-Sale Activity | -0.08% z-0.8 | +0.07% | +0.45% | +0.63% | +0.96% |
| Morning Activity | -0.04% z-0.3 | +0.06% | -0.20% | +0.95% | +2.18% |
| Thematic | |||||
| Bitcoin / Crypto | -0.25% z-0.8 | -0.10% | +0.42% | +2.48% | +1.78% |
| Oil | -0.36% z-0.8 | +0.73% | -0.13% | +2.73% | +4.47% |
| Semiconductors | +0.42% z+0.7 | +0.57% | -1.36% | -1.50% | -8.41% |
| Gold | +0.15% z+0.5 | -0.15% | -0.67% | +2.11% | +3.89% |
| China | -0.11% z-0.3 | -0.28% | +0.09% | +0.13% | +0.48% |
| Treasury (Duration) | +0.07% z+0.2 | -0.02% | -0.42% | -1.50% | -0.70% |
5/20/60d windows include today's session; 1d is the previous session.
Pairwise realized correlation. Index variance net of the weighted idiosyncratic diagonal, over the cross terms — the estimator used for implied-correlation indices. 20-day window unless noted; history since 2020.
Factor z-score. Today's factor return divided by its daily-return standard deviation over ~1,600 trading days.
Conditional importance. A factor's relative share of what a tree-based fit of today's stock returns explains; sums to 100% across factors.
High-beta momentum cohort. US names above $2B market cap in the top quintile of both raw beta and 12-month momentum; membership frozen at each month's first business day. “Top 50” = the 50 strongest by combined rank.
Stock-specific (idiosyncratic) return. The part of a stock's move not explained by market, style, or thematic factors in our decomposition.
VIXEQ / DSPX / COR1M. Cboe implied indices: single-stock volatility, dispersion, and 1-month implied correlation (top-50 S&P names). Quotes delayed ~15 minutes.
Data compiled by FactorPulse AI; edited and verified by Jeff Klein. For informational purposes only. Does not constitute financial advice, an investment recommendation, or an offer to buy or sell any securities. Always consult a qualified financial professional before making investment decisions.
For more on factor construction methodology, see www.factorpulse.com/glossary.