The Federal Reserve raised interest rates a quarter point on Wednesday, its first increase in three years, and the Dow fell more than 600 points. The vote was unanimous, lifting the benchmark rate to a range of 3.75% to 4%, and Chair Kevin Warsh called it a "sober" decision. It had looked all but certain since the morning, when August retail sales came in at a 1.2% gain, four times what forecasters expected, with 12 of 13 categories higher. Short-term Treasury yields rose sharply while long-term yields barely budged, a sign investors read the move as a near-term squeeze rather than a lasting shift, and reports suggested the Fed's own projections point to one more increase this year. Oddly, the most heavily indebted companies held up better than most on the very day their borrowing costs went up, breaking a five-day losing streak for that group, though they still finished lower.
Regional banks took the hardest hit. Huntington Bancshares dropped nearly 6% and PNC almost 4% after both cut their outlooks for interest income, saying they are having to pay depositors more than the higher rates give back. KeyCorp, Citizens and M&T each fell 4% to 5%. The irony is that Washington had just handed the banks a small gift: the Senate failed by a single vote to advance a bill on digital assets, leaving in place limits on how much yield stablecoins can pay, which bank lobbyists had wanted as protection against deposits walking out the door. It did not help. Elsewhere, trucker J.B. Hunt plunged 13% after warning that driver and diesel costs would push third-quarter earnings lower.
Energy was the worst-performing sector, down about 2.5%, after crude fell more than 3% to roughly $102 a barrel. Saudi Aramco restarted its 1,200-kilometer East-West pipeline, restoring 5 million barrels a day of capacity that bypasses the Strait of Hormuz, and an industry report showed a large build in U.S. crude inventories. ConocoPhillips fell almost 6%, Exxon 3.5% and shale driller Diamondback Energy 8%. The few bright spots were in beaten-down technology: Intel rose more than 5% on reports it is in talks with SK Hynix to make memory chips at its Ohio campus, and bitcoin miners bounced after a quarter in which they lost more than a third of their value, with bitcoin itself flat near $76,000.
The Federal Open Market Committee voted 12-0 to lift the funds rate a quarter point to a 3.75%–4.00% range, its first increase in three yearsFederal Reserve, and the Dow closed more than 600 points lower, with Chair Kevin Warsh calling the decision a "sober" oneBloomberg. August retail sales census.gov at +1.2% against a 0.3% consensus had made the decision close to a formality by 8:30 AMBloomberg. DIA closed -1.17% against SPY at -0.44%. The 2-year yield rose 7.7 bps to 4.74%CNBC; the 30-year eased 1.0 bp to 5.353%, so the front end absorbed the hike and the long end did notCNBC.
| Factor | Return | Z-Score | 5d Z | 20d Z | 63d Z | Category | Direction |
|---|---|---|---|---|---|---|---|
| Oil | -0.75% | z=-1.6 | -0.5 | +1.1 | +1.1 | Thematic | Most oil-exposed names underperformed |
| Leverage | +0.26% | z=+1.5 | -1.9 | -1.0 | -2.9 | Style | More-levered names outperformed |
| Medium-Term Momentum | -0.39% | z=-1.4 | -0.5 | +0.2 | +0.3 | Style-Momentum | Past month's winners gave back |
| Short-Term Momentum | -0.34% | z=-1.1 | -1.1 | -1.1 | -3.2 | Style-Momentum | Last week's leaders faded |
| Short-Sale Activity | -0.13% | z=-1.2 | +1.7 | +1.2 | +1.3 | Style-Flow | Barely-shorted names beat the most heavily short-sold |
| Dividend Yield | -0.18% | z=-1.0 | -1.0 | -0.1 | -0.6 | Style | Higher payout yield underperformed |
| Beta | +0.81% | z=+0.8 | -1.0 | -0.3 | -1.1 | Style-Risk | High-beta names outperformed |
| Semiconductors | +0.42% | z=+0.7 | -1.0 | -0.6 | -1.2 | Thematic | Higher semis exposure outperformed |
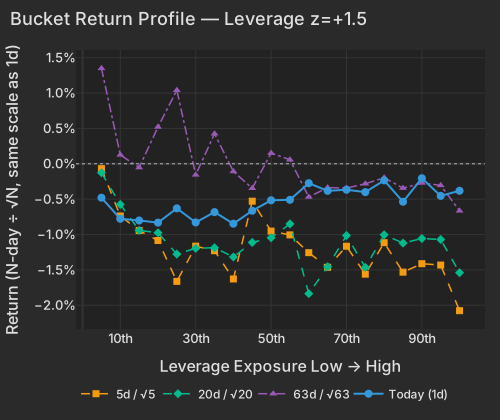
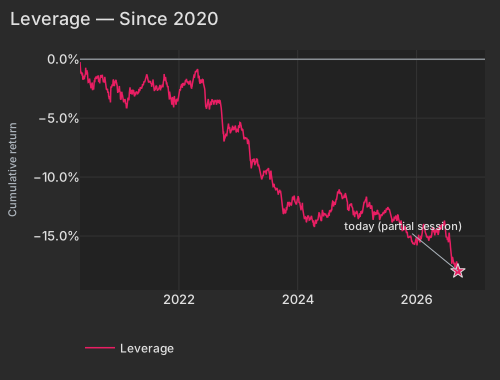
The more levered names outperformed the less levered by +0.26% at z=+1.5, the first up day after five consecutive down sessions. That interrupts the most punishing stretch this factor has had since 2020: -3.91% over the trailing 60 sessions, with the 63-day window at z=-2.9. They did not rally — the highest-leverage bucket still finished lower — they fell less than everything around them, on the session their debt got more expensive.
| Bucket | Ret 1D Pct | Ret 5D Norm Pct | Ret 20D Norm Pct | Ret 63D Norm Pct |
|---|---|---|---|---|
| 1 | -0.48 | -0.07 | -0.13 | 1.35 |
| 2 | -0.78 | -0.74 | -0.57 | 0.13 |
| 3 | -0.80 | -0.94 | -0.94 | -0.05 |
| 4 | -0.83 | -1.08 | -0.98 | 0.52 |
| 5 | -0.63 | -1.66 | -1.28 | 1.04 |
| 6 | -0.83 | -1.16 | -1.20 | -0.16 |
| 7 | -0.68 | -1.23 | -1.19 | 0.42 |
| 8 | -0.85 | -1.63 | -1.32 | -0.11 |
| 9 | -0.66 | -0.53 | -1.11 | -0.35 |
| 10 | -0.52 | -0.95 | -1.05 | 0.15 |
| 11 | -0.51 | -1.01 | -0.85 | 0.06 |
| 12 | -0.27 | -1.26 | -1.84 | -0.47 |
| 13 | -0.38 | -1.46 | -1.46 | -0.34 |
| 14 | -0.37 | -1.17 | -1.01 | -0.34 |
| 15 | -0.40 | -1.56 | -1.46 | -0.28 |
| 16 | -0.24 | -1.12 | -1.00 | -0.20 |
| 17 | -0.54 | -1.53 | -1.12 | -0.34 |
| 18 | -0.20 | -1.41 | -1.06 | -0.27 |
| 19 | -0.45 | -1.43 | -1.07 | -0.31 |
| 20 | -0.38 | -2.08 | -1.54 | -0.67 |
Two facts limit how far that reads. The five-day window is still -0.73% at z=-1.9, so the week remains negative. And the income side of rate sensitivity never turned: Dividend Yield fell -0.18% at z=-1.0, and the high-payout and high-leverage exposures overlap heavily in the same names. What got a one-day reprieve was the debt-service discount, not income-paying equity broadly. Risk appetite was real at the other end too — Beta paid +0.81% and carried 8.7% of the day's variance, and the top 50 high-beta momentum names rose +1.43% while the other roughly 1,250 names in the universe fell -0.78%.
| Date | Cumret Pct |
|---|---|
| 2020-05-04 | -0.24 |
| 2020-05-27 | -1.64 |
| 2020-06-18 | -1.17 |
| 2020-07-13 | -2.01 |
| 2020-08-04 | -1.58 |
| 2020-08-26 | -1.92 |
| 2020-09-18 | -1.49 |
| 2020-10-12 | -2.38 |
| 2020-11-03 | -3.12 |
| 2020-11-25 | -1.75 |
| 2020-12-18 | -2.46 |
| 2021-01-13 | -2.97 |
| 2021-02-05 | -3.46 |
| 2021-03-02 | -3.20 |
| 2021-03-24 | -2.59 |
| 2021-04-16 | -2.81 |
| 2021-05-10 | -2.37 |
| 2021-06-02 | -1.89 |
| 2021-06-24 | -1.67 |
| 2021-07-19 | -2.34 |
| 2021-08-10 | -2.47 |
| 2021-09-01 | -2.47 |
| 2021-09-24 | -2.37 |
| 2021-10-18 | -2.06 |
| 2021-11-09 | -3.10 |
| 2021-12-02 | -3.66 |
| 2021-12-27 | -3.57 |
| 2022-01-19 | -2.33 |
| 2022-02-10 | -1.86 |
| 2022-03-07 | -2.10 |
| 2022-03-29 | -1.95 |
| 2022-04-21 | -0.91 |
| 2022-05-13 | -1.78 |
| 2022-06-07 | -2.08 |
| 2022-06-30 | -3.72 |
| 2022-07-25 | -3.44 |
| 2022-08-16 | -3.54 |
| 2022-09-08 | -3.72 |
| 2022-09-30 | -6.34 |
| 2022-10-24 | -6.54 |
| 2022-11-15 | -6.28 |
| 2022-12-08 | -5.94 |
| 2023-01-03 | -6.13 |
| 2023-01-26 | -6.09 |
| 2023-02-17 | -6.68 |
| 2023-03-14 | -7.75 |
| 2023-04-05 | -8.46 |
| 2023-04-28 | -8.49 |
| 2023-05-22 | -9.99 |
| 2023-06-14 | -9.50 |
| 2023-07-10 | -9.42 |
| 2023-08-01 | -10.47 |
| 2023-08-23 | -11.11 |
| 2023-09-15 | -11.09 |
| 2023-10-09 | -13.10 |
| 2023-10-31 | -12.75 |
| 2023-11-22 | -12.36 |
| 2023-12-15 | -11.93 |
| 2024-01-10 | -11.82 |
| 2024-02-02 | -12.65 |
| 2024-02-27 | -13.81 |
| 2024-03-20 | -13.59 |
| 2024-04-12 | -14.17 |
| 2024-05-06 | -13.59 |
| 2024-05-29 | -13.72 |
| 2024-06-21 | -13.26 |
| 2024-07-16 | -13.28 |
| 2024-08-07 | -12.13 |
| 2024-08-29 | -11.93 |
| 2024-09-23 | -11.30 |
| 2024-10-15 | -11.67 |
| 2024-11-06 | -12.78 |
| 2024-11-29 | -12.24 |
| 2024-12-23 | -13.07 |
| 2025-01-17 | -13.13 |
| 2025-02-11 | -12.44 |
| 2025-03-06 | -12.58 |
| 2025-03-28 | -12.47 |
| 2025-04-22 | -12.96 |
| 2025-05-14 | -13.13 |
| 2025-06-06 | -13.27 |
| 2025-07-01 | -12.75 |
| 2025-07-24 | -12.96 |
| 2025-08-15 | -13.60 |
| 2025-09-09 | -13.53 |
| 2025-10-01 | -13.67 |
| 2025-10-23 | -14.43 |
| 2025-11-14 | -15.14 |
| 2025-12-09 | -15.48 |
| 2026-01-02 | -15.10 |
| 2026-01-27 | -15.40 |
| 2026-02-19 | -14.12 |
| 2026-03-13 | -14.99 |
| 2026-04-07 | -14.95 |
| 2026-04-29 | -14.70 |
| 2026-05-21 | -14.46 |
| 2026-06-15 | -14.09 |
| 2026-07-09 | -15.13 |
| 2026-07-31 | -15.90 |
| 2026-08-24 | -17.42 |
| 2026-09-16 | -17.98 |
Huntington Bancshares closed the session down -5.64% after cutting FY2027 EPS guidance to $1.75–$1.83 from $1.90–$1.93 and marking 2026 net-interest-income growth down to roughly 35% from a 39%–43% rangeFederal Reserve. PNC fell -3.87% after management revised its 2026 net-interest-income target, with sticky deposit rates offsetting what the curve gives backWSJ. KeyCorp closed -4.53%, Citizens -4.85% and M&T -3.98%.
None of that was factor-carried: all five printed stock-specific moves beyond 3.8 standard deviations of their own history, and they account for five of the eight largest such moves in the universe today. That is the residual worth owning from this session — the hike did not discount bank equity through a style axis, it re-set the funding cost on five liability-heavy lenders one presentation at a time. There is a further irony: the Senate's failure to advance the Digital Asset Market Clarity Act on a 49-50 cloture vote kept the limits on payment-stablecoin yields that banking lobbyists wanted, removing a deposit-flight threatFT. The regional banks still closed at the bottom of the tape.
Saudi Aramco restarted the 1,200-kilometre East-West Petroline, returning 5 million barrels a day of Hormuz-bypass capacityWSJ, and this followed an API report of a 7.1 million-barrel U.S. crude buildNYT. WTI closed at $102.19, down -3.44% as of 4:01 PM ETCNBC. The Oil factor took -0.75% at z=-1.6 and 4.6% of the day's cross-sectional variance, top decile against its own past year. The ten most oil-exposed exploration and production names fell -6.75% as a group; Diamondback Energy closed -8.03%, of which the Oil factor carried -1.91%. Energy was the worst sector at -2.46%, with ConocoPhillips -5.82% and Exxon -3.50%.
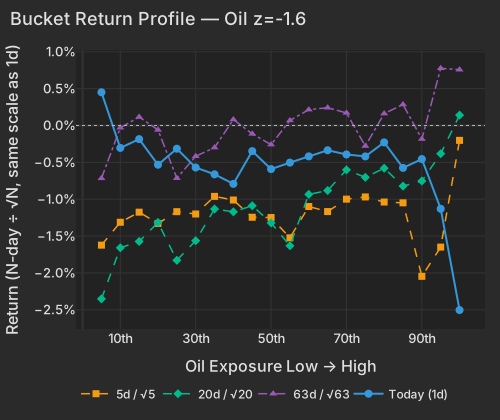
| Bucket | Ret 1D Pct | Ret 5D Norm Pct | Ret 20D Norm Pct | Ret 63D Norm Pct |
|---|---|---|---|---|
| 1 | 0.45 | -1.62 | -2.35 | -0.72 |
| 2 | -0.30 | -1.31 | -1.66 | -0.03 |
| 3 | -0.18 | -1.18 | -1.57 | 0.12 |
| 4 | -0.53 | -1.33 | -1.32 | -0.06 |
| 5 | -0.31 | -1.17 | -1.83 | -0.71 |
| 6 | -0.57 | -1.20 | -1.56 | -0.42 |
| 7 | -0.66 | -0.96 | -1.13 | -0.30 |
| 8 | -0.79 | -1.01 | -1.17 | 0.08 |
| 9 | -0.35 | -1.24 | -1.09 | -0.11 |
| 10 | -0.59 | -1.25 | -1.32 | -0.26 |
| 11 | -0.50 | -1.52 | -1.63 | 0.07 |
| 12 | -0.42 | -1.10 | -0.93 | 0.21 |
| 13 | -0.34 | -1.17 | -0.88 | 0.24 |
| 14 | -0.39 | -1.00 | -0.60 | 0.17 |
| 15 | -0.42 | -0.97 | -0.70 | -0.28 |
| 16 | -0.23 | -1.04 | -0.58 | 0.16 |
| 17 | -0.57 | -1.05 | -0.82 | 0.29 |
| 18 | -0.46 | -2.05 | -0.75 | -0.18 |
| 19 | -1.13 | -1.65 | -0.38 | 0.78 |
| 20 | -2.50 | -0.20 | 0.14 | 0.76 |
| ETF | Theme | Today | 1d Ago | 5d Ago | 20d Ago | 63d Ago |
|---|---|---|---|---|---|---|
| XOP | oil E&P | -3.91% | +3.22% | +2.99% | +8.92% | +26.71% |
| USO | crude | -3.43% | +3.32% | +10.84% | +24.23% | +33.54% |
| XLE | energy | -2.86% | +2.17% | +1.79% | +5.35% | +19.53% |
| KRE | regional banks | -1.73% | -0.08% | -0.35% | -4.32% | +3.11% |
| XLF | financials | -1.57% | -0.32% | -0.79% | -1.27% | +6.51% |
| SPY | large cap | -0.44% | -0.46% | -1.12% | -1.98% | +0.59% |
| SMH | semiconductors | +0.57% | +0.11% | -5.51% | -8.75% | -16.22% |
| DRAM | memory chips & storage | +0.85% | +0.38% | -9.97% | -8.91% | -22.60% |
| WGMI | crypto miners | +3.46% | -4.01% | -13.45% | -14.08% | -37.59% |
| TLT | long-term bonds | +0.17% | -0.27% | -1.81% | -0.41% | -4.75% |
What bid, bid the wreckage. Intel rose more than 5% on reported talks with SK Hynix to make DRAM and high-bandwidth memory at its Ohio campusMarketWatch, and Lumentum closed +9.53% on an upgrade citing 800G transceiver deploymentsBloomberg. Bitcoin at $76,075 was essentially unchanged at +0.15% as of 4:11 PM ETCNBC, with the miners bouncing off a quarter down more than a third.
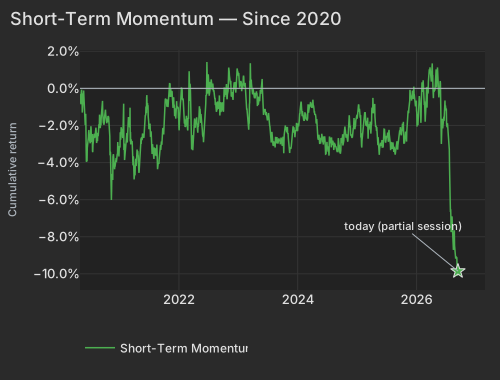
Last week's leaders were faded again. Short-Term Momentum — read as five-day reversion — fell -0.34% at z=-1.1, extending a run of -8.33% over the trailing 60 sessions that sits at z=-3.2 on the 63-day window. The one-month horizon did the same today: 20-day momentum (Medium-Term Momentum in the table) at -0.39%, z=-1.4, with the past month's losers ahead of its winners. Each leg of this quarter's churn has been given back in turn rather than followed.
| Date | Cumret Pct |
|---|---|
| 2020-05-04 | -0.31 |
| 2020-05-27 | -0.50 |
| 2020-06-18 | -2.87 |
| 2020-07-13 | -2.89 |
| 2020-08-04 | -2.62 |
| 2020-08-26 | -2.20 |
| 2020-09-18 | -0.67 |
| 2020-10-12 | -1.45 |
| 2020-11-03 | -2.58 |
| 2020-11-25 | -3.55 |
| 2020-12-18 | -3.53 |
| 2021-01-13 | -2.56 |
| 2021-02-05 | -3.36 |
| 2021-03-02 | -1.91 |
| 2021-03-24 | -3.85 |
| 2021-04-16 | -3.58 |
| 2021-05-10 | -3.07 |
| 2021-06-02 | -2.27 |
| 2021-06-24 | -1.14 |
| 2021-07-19 | -2.85 |
| 2021-08-10 | -3.28 |
| 2021-09-01 | -4.07 |
| 2021-09-24 | -2.15 |
| 2021-10-18 | -0.59 |
| 2021-11-09 | 0.26 |
| 2021-12-02 | -1.01 |
| 2021-12-27 | -1.02 |
| 2022-01-19 | 0.01 |
| 2022-02-10 | -1.68 |
| 2022-03-07 | 0.92 |
| 2022-03-29 | -3.33 |
| 2022-04-21 | -1.56 |
| 2022-05-13 | -1.75 |
| 2022-06-07 | -2.15 |
| 2022-06-30 | 0.53 |
| 2022-07-25 | 0.22 |
| 2022-08-16 | -0.84 |
| 2022-09-08 | -0.38 |
| 2022-09-30 | -1.23 |
| 2022-10-24 | -0.04 |
| 2022-11-15 | 0.26 |
| 2022-12-08 | 0.33 |
| 2023-01-03 | 0.80 |
| 2023-01-26 | 0.12 |
| 2023-02-17 | -0.23 |
| 2023-03-14 | -0.75 |
| 2023-04-05 | -0.06 |
| 2023-04-28 | -0.55 |
| 2023-05-22 | -0.30 |
| 2023-06-14 | -1.15 |
| 2023-07-10 | -1.64 |
| 2023-08-01 | -2.82 |
| 2023-08-23 | -2.84 |
| 2023-09-15 | -2.80 |
| 2023-10-09 | -3.08 |
| 2023-10-31 | -2.28 |
| 2023-11-22 | -3.26 |
| 2023-12-15 | -2.29 |
| 2024-01-10 | -1.99 |
| 2024-02-02 | -1.42 |
| 2024-02-27 | -1.70 |
| 2024-03-20 | -0.81 |
| 2024-04-12 | -1.12 |
| 2024-05-06 | -2.56 |
| 2024-05-29 | -2.76 |
| 2024-06-21 | -3.21 |
| 2024-07-16 | -3.04 |
| 2024-08-07 | -2.84 |
| 2024-08-29 | -3.25 |
| 2024-09-23 | -3.53 |
| 2024-10-15 | -2.53 |
| 2024-11-06 | -2.84 |
| 2024-11-29 | -2.55 |
| 2024-12-23 | -2.02 |
| 2025-01-17 | -1.10 |
| 2025-02-11 | -2.14 |
| 2025-03-06 | -1.84 |
| 2025-03-28 | -2.44 |
| 2025-04-22 | -0.84 |
| 2025-05-14 | -2.84 |
| 2025-06-06 | -3.20 |
| 2025-07-01 | -2.86 |
| 2025-07-24 | -2.89 |
| 2025-08-15 | -3.22 |
| 2025-09-09 | -3.25 |
| 2025-10-01 | -2.34 |
| 2025-10-23 | -2.81 |
| 2025-11-14 | -1.32 |
| 2025-12-09 | -0.34 |
| 2026-01-02 | -0.66 |
| 2026-01-27 | -0.90 |
| 2026-02-19 | -0.89 |
| 2026-03-13 | 0.01 |
| 2026-04-07 | 0.60 |
| 2026-04-29 | 0.18 |
| 2026-05-21 | -0.49 |
| 2026-06-15 | -2.16 |
| 2026-07-09 | -1.97 |
| 2026-07-31 | -6.67 |
| 2026-08-24 | -7.92 |
| 2026-09-16 | -9.85 |
Underneath, this was a single-name day: 72.1% of cross-sectional variance was idiosyncratic against a one-year average of 65.8%. J.B. Hunt closed -13.24% — nearly seven standard deviations of its own residual — after guiding Q3 earnings 5% to 10% lower sequentially on driver and diesel costs against intermodal pricingWSJ. Arcutis closed +11.56%, the largest stock-specific gain. Twenty-day realized pairwise correlation remains pinned near its lows at 8.43%, the 4.9th percentile since 2020, with the market leg explaining 6.6% of variance over that window. Index volatility woke up — VIX at 18.02, the top of its 20-session range of 14.32 to 17.84 — while implied one-month single-stock correlation (Cboe COR1M) at 15.06 sits in the 11.6th percentile of its 20-year history. The hike moved the index; it did not make the names move together.
The Advance Retail Sales report, released at 8:30 AM ET, showed a +1.2% monthly gain against a 0.3% consensus, rebounding from July's revised -0.5%, with 12 of 13 categories higher and non-store retailers up +2.6%Bloomberg. The print pushed Treasury yields up and closed off the debate over the afternoon's decision; CNBC reported the Committee's updated projections point to one further increase this year.
Variance decomposition: live intraday — 20260916 session, bracketed against its trailing-year range. Factor returns are trailing through last close. Total cross-sectional dispersion: 17%ile of the past year.
Variance mix — % of total, today vs 1d ago vs 1-yr avg
market 53%ile style 50%ile thematic 92.4%ile idiosyncratic 47%ile
Variance explained — today vs. factor's trailing-year range
Marker = the factor's share of today's total variance, placed in its own trailing-year range (box 25–75%ile, ticks 90%ile and max). Amber marker = unusually load-bearing today (≥90%ile of its own year). Factor name green = up today / red = down.
Correlation & dispersion — realized vs implied
Pairwise realized correlation (20d): 8.43% 4.9%ile since 2020 · 62%ile 3m
Top-500 pairwise: 7.24% 3.2%ile since 2020 · 33%ile 3m · implied (Cboe COR1M): 15.06 12%ile of its own history (gap -7.8pp)
Realized 20d vol (ann. pts): all stocks 39 vs VIXEQ 37 · index 10 vs VIX 18 · style factors 19 66%ile
20-day window (19 completed days + today); percentiles vs model history since 2020; '3m' tokens rank vs the trailing 63 trading days; definitions in Terms below. Implied prints (Cboe) are delayed ~15 min. as of 15:58 ET
Top 50 high-beta momentum names (eq-wt, since-2020 rank): +1.4% 68%ile · rest of market -0.8%
| Factor | Today | 1d | 5d | 20d | 60d |
|---|---|---|---|---|---|
| Style-Risk | |||||
| Beta | +0.81% z+0.8 | -0.20% | -2.26% | -1.47% | -11.68% |
| International | -0.13% z-0.4 | +0.06% | -0.08% | +1.32% | +0.86% |
| Residual Volatility | +0.18% z+0.4 | -0.20% | +0.88% | +1.37% | +3.48% |
| Style | |||||
| Leverage | +0.26% z+1.6 | -0.16% | -0.73% | -0.78% | -3.91% |
| Dividend Yield | -0.18% z-1.0 | +0.22% | -0.40% | -0.10% | -1.04% |
| Profitability | +0.17% z+0.9 | -0.03% | -0.18% | -0.88% | -2.88% |
| Growth | +0.15% z+0.6 | -0.10% | +0.14% | -0.38% | +2.28% |
| Value | -0.14% z-0.6 | +0.17% | -0.21% | +0.11% | -0.23% |
| Size | +0.13% z+0.4 | +0.17% | +0.67% | +1.60% | +0.41% |
| Liquidity | -0.07% z-0.2 | -0.20% | -0.26% | +1.07% | +1.23% |
| Style-Momentum | |||||
| Medium-Term Momentum | -0.39% z-1.4 | +0.04% | -0.31% | +0.26% | +0.04% |
| Short-Term Momentum | -0.34% z-1.1 | +0.59% | -0.72% | -1.47% | -8.33% |
| One-Day Momentum | -0.25% z-0.9 | -0.18% | -1.14% | -1.35% | -2.44% |
| Long-Term Momentum | +0.23% z+0.3 | +0.74% | -0.45% | -0.24% | -6.48% |
| Style-Positioning | |||||
| Hedge-Fund Ownership | -0.11% z-1.0 | -0.15% | -0.39% | -0.30% | +0.60% |
| Short Interest | -0.12% z-0.7 | -0.12% | -0.04% | -0.34% | +0.14% |
| Style-Flow | |||||
| Short-Sale Activity | -0.13% z-1.2 | +0.07% | +0.40% | +0.58% | +0.91% |
| Morning Activity | +0.00% z+0.0 | +0.06% | -0.16% | +1.00% | +2.23% |
| Thematic | |||||
| Oil | -0.75% z-1.6 | +0.73% | -0.52% | +2.35% | +4.08% |
| Bitcoin / Crypto | -0.29% z-0.9 | -0.10% | +0.38% | +2.43% | +1.74% |
| Semiconductors | +0.42% z+0.7 | +0.57% | -1.36% | -1.50% | -8.41% |
| Gold | -0.14% z-0.4 | -0.15% | -0.96% | +1.82% | +3.60% |
| Treasury (Duration) | -0.08% z-0.2 | -0.02% | -0.57% | -1.66% | -0.86% |
| China | +0.04% z+0.1 | -0.28% | +0.24% | +0.28% | +0.63% |
5/20/60d windows include today's session; 1d is the previous session.
Pairwise realized correlation. Index variance net of the weighted idiosyncratic diagonal, over the cross terms — the estimator used for implied-correlation indices. 20-day window unless noted; history since 2020.
Market variance share. The fraction of cross-sectional variance explained by the market factor — the attribution companion to pairwise correlation, not a substitute for it.
Factor z-score. Today's factor return divided by its daily-return standard deviation over ~1,600 trading days.
High-beta momentum cohort. US names above $2B market cap in the top quintile of both raw beta and 12-month momentum; membership frozen at each month's first business day. “Top 50” = the 50 strongest by combined rank.
Stock-specific (idiosyncratic) return. The part of a stock's move not explained by market, style, or thematic factors in our decomposition.
VIXEQ / DSPX / COR1M. Cboe implied indices: single-stock volatility, dispersion, and 1-month implied correlation (top-50 S&P names). Quotes delayed ~15 minutes.
Data compiled by FactorPulse AI; edited and verified by Jeff Klein. For informational purposes only. Does not constitute financial advice, an investment recommendation, or an offer to buy or sell any securities. Always consult a qualified financial professional before making investment decisions.
For more on factor construction methodology, see www.factorpulse.com/glossary.