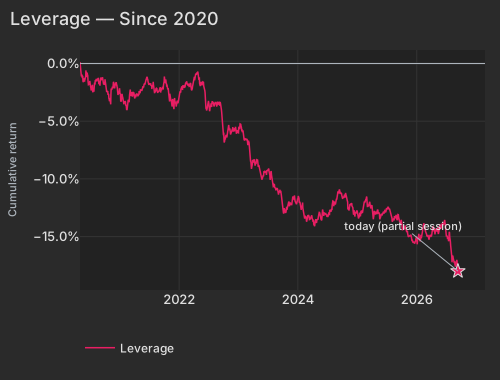
The cost of borrowing is deciding who wins and who loses. The 10-year Treasury yield touched 5% this morning, its highest since 2007, and the longest-dated bonds are selling off fastest. The bill has been arriving for months: over the past quarter, companies carrying heavy debt have trailed their low-debt peers by the widest margin in any three-month stretch since 2020. Today's move barely added to that gap, but the damage was already done. The Federal Reserve decides on rates tomorrow, with futures putting roughly 92% odds on a quarter-point hike and a CNBC survey out this morning pointing to at least two more over the next year.
The split runs by balance sheet rather than industry. Real estate, the purest borrower, fell more than 1% today and is down about 4% for the quarter, with homebuilders off nearly 9% and utilities down 6% over the same stretch. The lenders, by contrast, have gained about 7% this quarter. The starkest single story was online lender Enova, which plunged 23% and shed more than a billion dollars of market value after walking away from its planned purchase of Grasshopper Bancorp and withdrawing its bid for a national bank charter, giving up access to cheap deposits in the very month funding got most expensive. A small hint of relief: high-dividend stocks, many of them also heavy borrowers, edged ahead this morning, a sign worth watching if the debtors are starting to find buyers.
Energy is the side of the same shock that gets paid. Oil traded near $103 a barrel, up about 1.5%, as traders watch repairs to Saudi pipelines hit by Houthi strikes; energy shares rose about 1%, led by ConocoPhillips, while chipmakers bounced after Monday's slide and Dell jumped nearly 5%. Bitcoin slipped 3.5% to around $76,000 after Manhattan federal prosecutors moved to seize $61 million of Tether tied to alleged Iranian oil sales to Chinese buyers, knocking Coinbase down about 6%, though crypto stocks remain up roughly 25% over the past month. Through all of it, the market as a whole hardly budged: the S&P 500 dipped 0.2% as yesterday's winners gave back their gains and stocks moved more independently of one another than at almost any point since 2020. The biggest Treasury move in nearly two decades is reshuffling the deck, not toppling the table.
The benchmark ten-year yield printed 5.002% this morning, up 4.1 basis pointsCNBCBloomberg. The long end is carrying it: the 30-Year rose 4.3 basis points to 5.371% against the 2-Year's 2.2. Underneath, the equity cross-section has spent three months paying for exactly that. Leverage — high-debt balance sheets against low-debt ones — is -4.11% over 60 sessions and -0.95% over the last five, with the five-day window at z=-2.5 and the quarter at z=-3.0. Today the factor is -0.02%, a non-event.
The session is not confirming the thesis on its own, and the clearest piece of that is Dividend Yield: the high-payout end of the market, which overlaps heavily with the leveraged end, outperformed at +0.18% and z=+1.1, with the no-payout bottom bucket — CCO, CZR, BKD — down -0.87%. One morning of that does not touch a 60-session run, but it is the signal to watch if the borrowers are finding a bid.
| Factor | Return | Z-Score | 5d Z | 20d Z | 63d Z | Category | Direction |
|---|---|---|---|---|---|---|---|
| Leverage | -0.02% | -0.15 | -2.5 | -1.5 | -3.0 | Style | Debt-heavy names lagging low-debt peers |
| One-Day Momentum | -0.41% | -1.5 | -1.7 | -1.5 | -0.9 | Style-Momentum | Yesterday's gainers gave back |
| Short-Term Momentum | +0.37% | +1.2 | -0.9 | -1.3 | -3.1 | Style-Momentum | Last week's leaders kept leading |
| Dividend Yield | +0.18% | +1.1 | -0.5 | +0.1 | -0.6 | Style | High-payout names outperformed |
| Semiconductors | +0.62% | +1.0 | -1.0 | -1.1 | -1.5 | Thematic | Chip-exposed names outperformed |
| Bitcoin / Crypto | -0.31% | -1.0 | +0.9 | +1.9 | +0.8 | Thematic | Crypto-exposed names underperformed |
| Short Interest | -0.11% | -0.7 | -0.3 | +0.1 | +0.3 | Style-Positioning | Most-shorted names lagged |
| Residual Volatility | -0.20% | -0.4 | +0.4 | +0.5 | +0.4 | Style-Risk | Higher-volatility names lagged |
| Date | Cumret Pct |
|---|---|
| 2020-05-01 | 0.13 |
| 2020-05-26 | -1.50 |
| 2020-06-17 | -1.04 |
| 2020-07-10 | -2.15 |
| 2020-08-03 | -1.83 |
| 2020-08-25 | -1.48 |
| 2020-09-17 | -1.18 |
| 2020-10-09 | -2.02 |
| 2020-11-02 | -3.13 |
| 2020-11-24 | -1.60 |
| 2020-12-17 | -2.03 |
| 2021-01-12 | -3.18 |
| 2021-02-04 | -3.29 |
| 2021-03-01 | -3.36 |
| 2021-03-23 | -2.59 |
| 2021-04-15 | -2.60 |
| 2021-05-07 | -2.49 |
| 2021-06-01 | -1.79 |
| 2021-06-23 | -1.39 |
| 2021-07-16 | -1.92 |
| 2021-08-09 | -2.49 |
| 2021-08-31 | -2.41 |
| 2021-09-23 | -2.18 |
| 2021-10-15 | -1.71 |
| 2021-11-08 | -2.91 |
| 2021-12-01 | -3.96 |
| 2021-12-23 | -3.30 |
| 2022-01-18 | -2.03 |
| 2022-02-09 | -1.85 |
| 2022-03-04 | -1.76 |
| 2022-03-28 | -1.88 |
| 2022-04-20 | -0.91 |
| 2022-05-12 | -1.96 |
| 2022-06-06 | -2.02 |
| 2022-06-29 | -3.67 |
| 2022-07-22 | -3.45 |
| 2022-08-15 | -3.42 |
| 2022-09-07 | -3.34 |
| 2022-09-29 | -6.12 |
| 2022-10-21 | -6.39 |
| 2022-11-14 | -6.00 |
| 2022-12-07 | -5.80 |
| 2022-12-30 | -5.99 |
| 2023-01-25 | -5.78 |
| 2023-02-16 | -6.58 |
| 2023-03-13 | -7.24 |
| 2023-04-04 | -8.52 |
| 2023-04-27 | -8.44 |
| 2023-05-19 | -9.63 |
| 2023-06-13 | -9.48 |
| 2023-07-07 | -9.11 |
| 2023-07-31 | -10.26 |
| 2023-08-22 | -10.97 |
| 2023-09-14 | -10.94 |
| 2023-10-06 | -12.99 |
| 2023-10-30 | -12.54 |
| 2023-11-21 | -12.23 |
| 2023-12-14 | -11.51 |
| 2024-01-09 | -11.68 |
| 2024-02-01 | -12.05 |
| 2024-02-26 | -13.69 |
| 2024-03-19 | -13.49 |
| 2024-04-11 | -13.97 |
| 2024-05-03 | -13.50 |
| 2024-05-28 | -13.57 |
| 2024-06-20 | -13.04 |
| 2024-07-15 | -13.13 |
| 2024-08-06 | -11.92 |
| 2024-08-28 | -11.71 |
| 2024-09-20 | -11.20 |
| 2024-10-14 | -11.59 |
| 2024-11-05 | -11.98 |
| 2024-11-27 | -12.15 |
| 2024-12-20 | -12.95 |
| 2025-01-16 | -13.06 |
| 2025-02-10 | -12.54 |
| 2025-03-05 | -11.98 |
| 2025-03-27 | -12.57 |
| 2025-04-21 | -12.88 |
| 2025-05-13 | -12.99 |
| 2025-06-05 | -13.09 |
| 2025-06-30 | -12.79 |
| 2025-07-23 | -12.74 |
| 2025-08-14 | -13.47 |
| 2025-09-08 | -13.52 |
| 2025-09-30 | -13.83 |
| 2025-10-22 | -14.14 |
| 2025-11-13 | -15.03 |
| 2025-12-08 | -15.28 |
| 2025-12-31 | -15.21 |
| 2026-01-26 | -15.42 |
| 2026-02-18 | -13.92 |
| 2026-03-12 | -14.99 |
| 2026-04-06 | -14.92 |
| 2026-04-28 | -14.68 |
| 2026-05-20 | -14.60 |
| 2026-06-12 | -13.90 |
| 2026-07-08 | -14.90 |
| 2026-07-30 | -15.46 |
| 2026-08-21 | -17.27 |
| 2026-09-15 | -18.00 |
The split is by balance sheet rather than by sector label. Real estate is the purest expression of the borrower side — IYR -1.38% today and -3.92% over the quarter, with WELL, PLD and AMT all lower — while homebuilders have given back -8.66% and utilities -6.09% over the same 63 sessions. The lenders have not paid at all: XLF is +6.92% across the quarter and regional banks added +0.54% this morning. Wells Fargo is +2.89%, adding $7.63B of market value on a move the factor complex does not explain and the coverage in front of us has not yet named.
| ETF | Theme | Today | 1d Ago | 5d Ago | 20d Ago | 63d Ago |
|---|---|---|---|---|---|---|
| XOP | oil & gas E&P | +2.01% | -1.15% | +1.45% | +7.19% | +17.01% |
| XLE | energy | +1.17% | -0.94% | +0.73% | +4.23% | +12.13% |
| KRE | regional banks | +0.54% | +0.28% | -1.54% | -4.90% | +0.95% |
| XLF | financials | -0.22% | -0.38% | -1.84% | -1.94% | +6.92% |
| TLT | long-term bonds | -0.41% | +0.07% | -1.56% | -1.35% | -5.64% |
| XHB | homebuilders | -0.51% | -0.19% | -4.82% | -9.86% | -8.66% |
| XLU | utilities | -0.63% | -1.34% | -2.92% | -5.62% | -6.09% |
| IYR | real estate | -1.38% | -0.47% | -1.82% | -4.55% | -3.92% |
| BITO | crypto | -3.51% | +2.31% | -1.21% | +24.82% | +22.66% |
Enova International, which carries a +2.5σ Leverage exposure, fell -22.58% and gave up $1.29B of market value after terminating its $369M acquisition of Grasshopper Bancorp and withdrawing its national bank charter applicationsBloomberg. A nonbank lender walking away from cheap deposit funding in the month funding got most expensive is the thesis in one ticker.
Energy is the side of the same shock that gets paid. WTI traded $102.97 at 9:29 ET, up +1.56%CNBC, with traders watching repair work on Saudi pipelines after the Houthi strikesNYT. The Oil factor is +0.35% at z=+0.7 and the energy sector +1.08%, led by COP +1.79%. The chip complex is also untouched by the rate move this morning: Semiconductors is +0.62% at z=+1.0 and SMH +0.76% after yesterday's -4.75%, with Dell +4.61%.
Bitcoin was quoted at $76,282 at 9:39 ET, -3.54% on the dayCNBC. The Bitcoin/Crypto factor gave up -0.31% at z=-1.0, with the most exposed equities — Coinbase, MARA, CleanSpark, Galaxy — down -2.82% as a group and COIN itself -5.87%. The US Attorney in Manhattan filed to seize $61M of Tether alleged to be proceeds of sanctioned Iranian petroleum sales to Chinese buyersCNBC. Against BITO's +24.82% over the past 20 sessions, this dents a month rather than ending one.
Yesterday's biggest gainers fell -0.80% this morning while the other end of the book sat close to still — the day's reversion came from the winners' side. One-Day Momentum is -0.41% at z=-1.5, and at 16.7% of this morning's cross-sectional variance it is the largest single style driver of the session. That is not a one-morning quirk: the same day-over-day fade has run at z=-1.5 across the past 20 sessions. At the one-week lookback the sign flips — Short-Term Momentum is +0.37% at z=+1.2 today, continuation, against -8.21% over the trailing 60 sessions at z=-3.1. A day-old move gets faded; a week-old move persists.
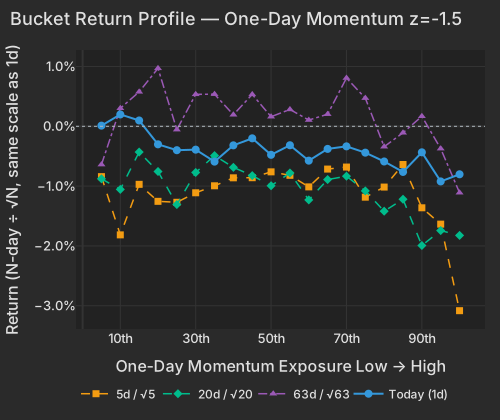
| Bucket | Ret 1D Pct | Ret 5D Norm Pct | Ret 20D Norm Pct | Ret 63D Norm Pct |
|---|---|---|---|---|
| 1 | 0.01 | -0.84 | -0.88 | -0.64 |
| 2 | 0.20 | -1.82 | -1.05 | 0.30 |
| 3 | 0.10 | -0.97 | -0.43 | 0.58 |
| 4 | -0.30 | -1.25 | -0.76 | 0.97 |
| 5 | -0.40 | -1.27 | -1.31 | -0.06 |
| 6 | -0.39 | -1.11 | -0.77 | 0.53 |
| 7 | -0.59 | -0.99 | -0.49 | 0.54 |
| 8 | -0.32 | -0.86 | -0.69 | 0.19 |
| 9 | -0.20 | -0.86 | -0.82 | 0.53 |
| 10 | -0.48 | -0.76 | -0.99 | 0.16 |
| 11 | -0.32 | -0.82 | -0.78 | 0.28 |
| 12 | -0.57 | -1.01 | -1.23 | 0.10 |
| 13 | -0.38 | -0.72 | -0.89 | 0.20 |
| 14 | -0.34 | -0.68 | -0.83 | 0.81 |
| 15 | -0.44 | -1.18 | -1.08 | 0.47 |
| 16 | -0.59 | -1.02 | -1.42 | -0.34 |
| 17 | -0.76 | -0.64 | -1.22 | -0.11 |
| 18 | -0.43 | -1.36 | -1.99 | 0.17 |
| 19 | -0.92 | -1.64 | -1.74 | -0.37 |
| 20 | -0.80 | -3.08 | -1.82 | -1.11 |
All of that churn is happening under an index that is barely moving as a unit. Realized 20-day pairwise correlation is 8.47%, the 5.0th percentile since 2020, with the market leg explaining 6.8% of cross-sectional variance. Measured against only the last three months, the same reading sits at the 62nd percentile — a plateau near the lows, not a fresh one. Implied is priced for the quiet: Cboe's one-month implied single-stock correlation (COR1M) at 13.1 is in the lowest 8.3% of its 20-year history, a premium of roughly 4.6 points over what the past 20 sessions actually realized.
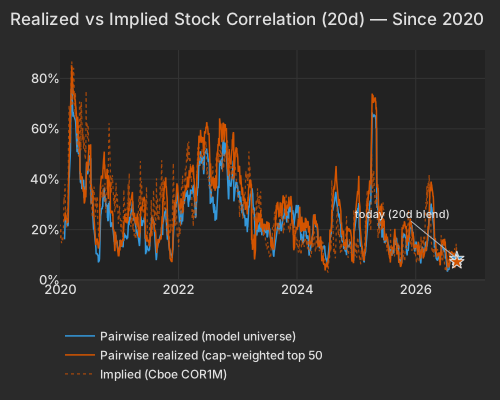
| Series | Today Pct | Prev Close Pct |
|---|---|---|
| pairwise_model | 8.47 | 8.60 |
| pairwise_top500 | 7.15 | 7.22 |
| implied_cor1m |
This is the part a yield headline misses. The largest move in the Treasury market since 2007 has generated almost no common factor in equities: SPY is -0.18%, style factors are carrying 28.5% of today's cross-sectional variance against a one-year average of 22.0%, and the quarter's damage shows up as an eleven-point gap between XLF and IYR rather than as an index drawdown. The FOMC federalreserve.gov decides tomorrow, with futures pricing a quarter-point hike at roughly 92% and a CNBC survey published this morning pointing to at least two more over the next yearNYT.
Variance decomposition: live intraday — 20260915 session, bracketed against its trailing-year range. Factor returns are trailing through last close. Total cross-sectional dispersion: 1.6%ile of the past year.
Variance mix — % of total, today vs 1d ago vs 1-yr avg
market 50%ile style 82%ile thematic 43%ile idiosyncratic 31%ile
Variance explained — today vs. factor's trailing-year range
Marker = the factor's share of today's total variance, placed in its own trailing-year range (box 25–75%ile, ticks 90%ile and max). Amber marker = unusually load-bearing today (≥90%ile of its own year). Factor name green = up today / red = down.
Correlation & dispersion — realized vs implied
Pairwise realized correlation (20d): 8.47% 5.0%ile since 2020 · 62%ile 3m
Top-500 pairwise: 7.15% 3.1%ile since 2020 · 30%ile 3m · implied (Cboe COR1M): 13.10 8.3%ile of its own history (gap -6.0pp)
Realized 20d vol (ann. pts): all stocks 40 vs VIXEQ 36 · index 10 vs VIX 17 · style factors 20 72%ile
20-day window (19 completed days + today); percentiles vs model history since 2020; '3m' tokens rank vs the trailing 63 trading days; definitions in Terms below. Implied prints (Cboe) are delayed ~15 min. as of 09:21 ET
Top 50 high-beta momentum names (eq-wt, since-2020 rank): +1.0% 62%ile · rest of market -0.1%
| Factor | Today | 1d | 5d | 20d | 60d |
|---|---|---|---|---|---|
| Style-Risk | |||||
| Beta | +0.41% z+0.4 | -2.34% | -2.55% | -4.38% | -11.64% |
| Residual Volatility | -0.20% z-0.4 | +1.13% | +0.50% | +1.15% | +2.81% |
| International | -0.02% z-0.1 | -0.09% | +0.02% | +1.42% | +0.97% |
| Style | |||||
| Dividend Yield | +0.18% z+1.1 | -0.23% | -0.18% | +0.07% | -0.66% |
| Value | +0.22% z+0.9 | -0.31% | +0.13% | +0.17% | -0.25% |
| Size | +0.08% z+0.2 | -0.02% | +0.86% | +1.78% | +0.10% |
| Profitability | -0.03% z-0.2 | -0.35% | -0.40% | -1.16% | -3.08% |
| Leverage | -0.02% z-0.1 | -0.52% | -0.95% | -1.12% | -4.11% |
| Growth | +0.03% z+0.1 | +0.10% | +0.07% | -0.49% | +2.17% |
| Liquidity | +0.01% z+0.1 | +0.11% | -0.04% | +1.35% | +1.12% |
| Style-Momentum | |||||
| One-Day Momentum | -0.41% z-1.5 | -0.76% | -1.10% | -1.94% | -2.37% |
| Short-Term Momentum | +0.37% z+1.2 | -0.85% | -0.62% | -1.79% | -8.21% |
| Long-Term Momentum | +0.51% z+0.8 | -1.02% | -0.14% | -1.29% | -5.18% |
| Medium-Term Momentum | -0.12% z-0.4 | +0.40% | +0.19% | +0.81% | +0.21% |
| Style-Positioning | |||||
| Short Interest | -0.11% z-0.7 | +0.33% | -0.12% | +0.11% | +0.25% |
| Hedge-Fund Ownership | -0.07% z-0.6 | -0.03% | -0.20% | +0.01% | +0.78% |
| Style-Flow | |||||
| Morning Activity | +0.02% z+0.1 | +0.04% | -0.23% | +1.14% | +2.25% |
| Short-Sale Activity | -0.01% z-0.1 | +0.14% | +0.41% | +0.66% | +0.96% |
| Thematic | |||||
| Bitcoin / Crypto | -0.31% z-1.0 | +0.77% | +0.60% | +2.55% | +1.72% |
| Semiconductors | +0.62% z+1.0 | -2.11% | -1.37% | -3.00% | -7.50% |
| Oil | +0.35% z+0.7 | -0.30% | +0.47% | +2.99% | +4.63% |
| Gold | -0.16% z-0.5 | +0.07% | -0.73% | +2.10% | +3.42% |
| China | -0.09% z-0.2 | +0.07% | +0.10% | +0.50% | +0.83% |
| Treasury (Duration) | -0.04% z-0.1 | +0.02% | -0.68% | -1.46% | -0.74% |
5/20/60d windows include today's session; 1d is the previous session.
Pairwise realized correlation. Index variance net of the weighted idiosyncratic diagonal, over the cross terms — the estimator used for implied-correlation indices. 20-day window unless noted; history since 2020.
Market variance share. The fraction of cross-sectional variance explained by the market factor — the attribution companion to pairwise correlation, not a substitute for it.
Factor z-score. Today's factor return divided by its daily-return standard deviation over ~1,600 trading days.
VIXEQ / DSPX / COR1M. Cboe implied indices: single-stock volatility, dispersion, and 1-month implied correlation (top-50 S&P names). Quotes delayed ~15 minutes.
Data compiled by FactorPulse AI; edited and verified by Jeff Klein. For informational purposes only. Does not constitute financial advice, an investment recommendation, or an offer to buy or sell any securities. Always consult a qualified financial professional before making investment decisions.
For more on factor construction methodology, see www.factorpulse.com/glossary.