Oil did the sorting today. Crude jumped more than 4% to about $106 a barrel on Middle East supply worries, and the 10-year Treasury yield followed it up to 5%, its highest level since 2007, with 5-year and 30-year yields also at multi-decade highs. Energy was the only sector to finish higher, up roughly 2%, with Exxon and Chevron each gaining about 2.5%, while the S&P 500 slipped about 0.4%. All of it landed a day before the Federal Reserve is expected to raise rates a quarter point from the current 3.5% to 3.75% range; futures put the odds near 90%.
The casualties were the usual rate-sensitive names, and their pain has been building for weeks rather than arriving in one shot. Utilities fell about 1% today and are down about 6% over the past month; homebuilders are down nearly 10% over the same stretch, with 30-year mortgage rates above 7.2%, a one-year high; real estate lost about 1%. Companies carrying heavy debt have now had their worst three-month run since 2020, while steady dividend payers held up, and the S&P 500 now yields more than a full percentage point less in earnings than the 10-year Treasury pays in interest. Notably, corporate bond prices barely budged, so the credit market has not yet joined the equity market's worry. Defense contractors kept sliding, too, down roughly 18% over the past month as investors abandon the legacy prime contractors.
The day's other stories traced back to the same barrel. Federal prosecutors in Manhattan moved to seize $61 million in Tether tied to sanctioned Iranian oil sales; Bitcoin dropped about 4% to roughly $76,000, and crypto exchange Coinbase plunged 10%, shedding about $5.7 billion in market value. Chinese stocks listed in the U.S. were another weak spot, down more than 1%. Online lender Enova sank 23% after calling off its purchase of Grasshopper Bancorp, while lab-equipment makers Thermo Fisher and Revvity bucked the tape, up about 4.5% and 9%. Tomorrow's rate hike is close to a foregone conclusion; the real question is the Fed's forecast for what comes after, because the market has spent the past quarter trading as if more than one is on the way.
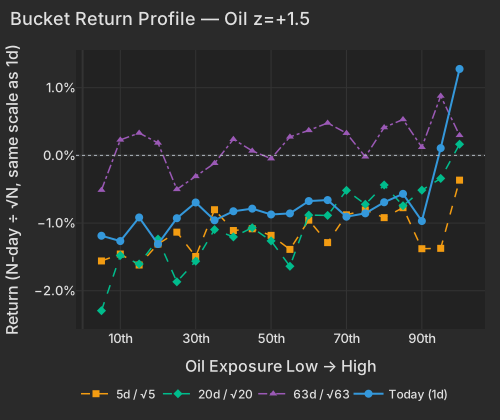
WTI traded at $105.88 at 4:01 PM ET, up +4.43% on the dayCNBC, and the Oil factor returned +0.71% at z=+1.5 with the highest-exposure decile up +1.28%. Energy was the only major sector group higher, at +1.79%, carried by XOM +2.57% and CVX +2.64%. The same barrel is what pushed the curve: the 5-year rose 4.9 bps to 4.837% and the 30-year 4.0 bps to 5.368%, both multi-decade highsCNBC, with the 10-year's move to its highest level since 2007 tied to Middle East supply risk.Bloomberg
| Factor | Return | Z-Score | 5d Z | 20d Z | 63d Z | Category | Direction |
|---|---|---|---|---|---|---|---|
| Short-Term Momentum | +0.57% | +1.9 | -0.6 | -1.2 | -3.1 | Style-Momentum | Last week's leaders kept leading |
| Oil | +0.71% | +1.5 | +0.8 | +1.6 | +1.0 | Thematic | Oil-levered names led |
| Dividend Yield | +0.26% | +1.5 | -0.3 | +0.2 | -0.5 | Style | High payout outperformed |
| Hedge-Fund Ownership | -0.17% | -1.5 | -1.2 | -0.2 | +0.9 | Style-Positioning | Most-owned names lagged |
| Long-Term Momentum | +0.69% | +1.1 | +0.0 | -0.4 | -1.0 | Style-Momentum | 1-year winners led |
| Leverage | -0.12% | -0.7 | -2.8 | -1.6 | -3.1 | Style | Debt-heavy names lagged |
| Short Interest | -0.13% | -0.8 | -0.4 | +0.1 | +0.3 | Style-Positioning | Most-shorted names lagged |
| Beta | -0.21% | -0.2 | -1.5 | -1.2 | -1.4 | Style-Risk | High-beta names slightly behind |
| Bucket | Ret 1D Pct | Ret 5D Norm Pct | Ret 20D Norm Pct | Ret 63D Norm Pct |
|---|---|---|---|---|
| 1 | -1.19 | -1.56 | -2.29 | -0.51 |
| 2 | -1.27 | -1.46 | -1.48 | 0.23 |
| 3 | -0.92 | -1.62 | -1.60 | 0.33 |
| 4 | -1.31 | -1.31 | -1.24 | 0.18 |
| 5 | -0.93 | -1.13 | -1.87 | -0.50 |
| 6 | -0.70 | -1.49 | -1.56 | -0.31 |
| 7 | -0.96 | -0.80 | -1.10 | -0.12 |
| 8 | -0.83 | -1.11 | -1.20 | 0.24 |
| 9 | -0.79 | -1.08 | -1.07 | 0.07 |
| 10 | -0.87 | -1.18 | -1.26 | -0.05 |
| 11 | -0.86 | -1.39 | -1.64 | 0.27 |
| 12 | -0.67 | -0.96 | -0.88 | 0.37 |
| 13 | -0.66 | -1.29 | -0.89 | 0.48 |
| 14 | -0.91 | -0.88 | -0.52 | 0.33 |
| 15 | -0.86 | -0.81 | -0.72 | -0.02 |
| 16 | -0.69 | -0.92 | -0.44 | 0.41 |
| 17 | -0.57 | -0.77 | -0.74 | 0.53 |
| 18 | -0.97 | -1.38 | -0.51 | 0.12 |
| 19 | 0.11 | -1.37 | -0.34 | 0.88 |
| 20 | 1.28 | -0.37 | 0.16 | 0.30 |
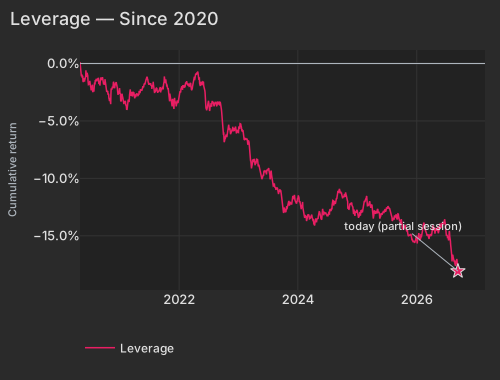
The Leverage factor has returned -4.21% over the trailing 60 sessions, with the 63-day z at z=-3.1 and the five-day z at z=-2.8. Today added only -0.12% at z=-0.7 — the discounting of debt-heavy balance sheets is a quarter old, not a Tuesday event. The equity math is now explicit: the S&P 500 earnings yield of 3.82% sits 115 bps below the 10-year, a negative gap across developed markets.FT Payout yield paying +0.26% at z=+1.5 on a day the long end rose is the other half of the same sort.
| Date | Cumret Pct |
|---|---|
| 2020-05-01 | 0.13 |
| 2020-05-26 | -1.50 |
| 2020-06-17 | -1.04 |
| 2020-07-10 | -2.15 |
| 2020-08-03 | -1.83 |
| 2020-08-25 | -1.48 |
| 2020-09-17 | -1.18 |
| 2020-10-09 | -2.02 |
| 2020-11-02 | -3.13 |
| 2020-11-24 | -1.60 |
| 2020-12-17 | -2.03 |
| 2021-01-12 | -3.18 |
| 2021-02-04 | -3.29 |
| 2021-03-01 | -3.36 |
| 2021-03-23 | -2.59 |
| 2021-04-15 | -2.60 |
| 2021-05-07 | -2.49 |
| 2021-06-01 | -1.79 |
| 2021-06-23 | -1.39 |
| 2021-07-16 | -1.92 |
| 2021-08-09 | -2.49 |
| 2021-08-31 | -2.41 |
| 2021-09-23 | -2.18 |
| 2021-10-15 | -1.71 |
| 2021-11-08 | -2.91 |
| 2021-12-01 | -3.96 |
| 2021-12-23 | -3.30 |
| 2022-01-18 | -2.03 |
| 2022-02-09 | -1.85 |
| 2022-03-04 | -1.76 |
| 2022-03-28 | -1.88 |
| 2022-04-20 | -0.91 |
| 2022-05-12 | -1.96 |
| 2022-06-06 | -2.02 |
| 2022-06-29 | -3.67 |
| 2022-07-22 | -3.45 |
| 2022-08-15 | -3.42 |
| 2022-09-07 | -3.34 |
| 2022-09-29 | -6.12 |
| 2022-10-21 | -6.39 |
| 2022-11-14 | -6.00 |
| 2022-12-07 | -5.80 |
| 2022-12-30 | -5.99 |
| 2023-01-25 | -5.78 |
| 2023-02-16 | -6.58 |
| 2023-03-13 | -7.24 |
| 2023-04-04 | -8.52 |
| 2023-04-27 | -8.44 |
| 2023-05-19 | -9.63 |
| 2023-06-13 | -9.48 |
| 2023-07-07 | -9.11 |
| 2023-07-31 | -10.26 |
| 2023-08-22 | -10.97 |
| 2023-09-14 | -10.94 |
| 2023-10-06 | -12.99 |
| 2023-10-30 | -12.54 |
| 2023-11-21 | -12.23 |
| 2023-12-14 | -11.51 |
| 2024-01-09 | -11.68 |
| 2024-02-01 | -12.05 |
| 2024-02-26 | -13.69 |
| 2024-03-19 | -13.49 |
| 2024-04-11 | -13.97 |
| 2024-05-03 | -13.50 |
| 2024-05-28 | -13.57 |
| 2024-06-20 | -13.04 |
| 2024-07-15 | -13.13 |
| 2024-08-06 | -11.92 |
| 2024-08-28 | -11.71 |
| 2024-09-20 | -11.20 |
| 2024-10-14 | -11.59 |
| 2024-11-05 | -11.98 |
| 2024-11-27 | -12.15 |
| 2024-12-20 | -12.95 |
| 2025-01-16 | -13.06 |
| 2025-02-10 | -12.54 |
| 2025-03-05 | -11.98 |
| 2025-03-27 | -12.57 |
| 2025-04-21 | -12.88 |
| 2025-05-13 | -12.99 |
| 2025-06-05 | -13.09 |
| 2025-06-30 | -12.79 |
| 2025-07-23 | -12.74 |
| 2025-08-14 | -13.47 |
| 2025-09-08 | -13.52 |
| 2025-09-30 | -13.83 |
| 2025-10-22 | -14.14 |
| 2025-11-13 | -15.03 |
| 2025-12-08 | -15.28 |
| 2025-12-31 | -15.21 |
| 2026-01-26 | -15.42 |
| 2026-02-18 | -13.92 |
| 2026-03-12 | -14.99 |
| 2026-04-06 | -14.92 |
| 2026-04-28 | -14.68 |
| 2026-05-20 | -14.60 |
| 2026-06-12 | -13.90 |
| 2026-07-08 | -14.90 |
| 2026-07-30 | -15.46 |
| 2026-08-21 | -17.27 |
| 2026-09-15 | -18.07 |
The rate-sensitive complex shows the same path rather than a one-day shock. XLU fell -1.16% today and -5.62% over 20 sessions; homebuilders are down -9.86% over the same window, with 30-year mortgage rates at a one-year high above 7.2%, as Forbes reported. Credit did not confirm any of it — HYG -0.18%, LQD -0.02%, BXSL +0.39% — even as the 5% threshold resets the risk-free benchmark for corporate borrowers. Style factors explained 13.1% of cross-sectional variance today against a 22.0% one-year average: the sort was clean, but small next to single-name noise.
| ETF | Theme | Today | 1d Ago | 5d Ago | 20d Ago | 63d Ago |
|---|---|---|---|---|---|---|
| USO | oil | +3.27% | +1.14% | +10.36% | +23.74% | +24.90% |
| XOP | E&P | +3.05% | -1.15% | +1.45% | +7.19% | +17.01% |
| XLE | energy | +2.01% | -0.94% | +0.73% | +4.23% | +12.13% |
| SPY | large cap | -0.36% | -0.45% | -1.21% | -1.99% | +2.58% |
| XHB | homebuilders | -0.53% | -0.19% | -4.82% | -9.86% | -8.66% |
| IYR | real estate | -0.97% | -0.47% | -1.82% | -4.55% | -3.92% |
| XLU | utilities | -1.16% | -1.34% | -2.92% | -5.62% | -6.09% |
| ITA | defense | -1.20% | -1.02% | -3.92% | -14.39% | -7.28% |
| BITO | crypto | -3.91% | +2.31% | -1.21% | +24.82% | +22.66% |
Short-Term Momentum returned +0.57% at z=+1.9, a return in the 97.4th percentile since 2020: the prior week's leaders kept leading. Read it against the same factor's 63-day z of z=-3.1, where each leg of the past quarter was faded in turn. Skyworks entered the session as one of the strongest multi-day winners in the book and closed the regular session +12.60%, though the gain was overwhelmingly its own move and no sourced driver for it sits in today's coverage.
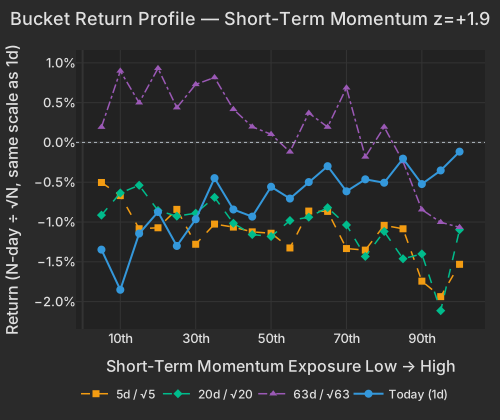
| Bucket | Ret 1D Pct | Ret 5D Norm Pct | Ret 20D Norm Pct | Ret 63D Norm Pct |
|---|---|---|---|---|
| 1 | -1.35 | -0.50 | -0.91 | 0.19 |
| 2 | -1.85 | -0.67 | -0.64 | 0.90 |
| 3 | -1.14 | -1.08 | -0.54 | 0.50 |
| 4 | -0.87 | -1.07 | -0.86 | 0.93 |
| 5 | -1.30 | -0.84 | -0.93 | 0.44 |
| 6 | -0.97 | -1.28 | -0.89 | 0.73 |
| 7 | -0.45 | -1.03 | -0.69 | 0.82 |
| 8 | -0.84 | -1.06 | -1.02 | 0.42 |
| 9 | -0.93 | -1.12 | -1.16 | 0.20 |
| 10 | -0.56 | -1.14 | -1.18 | 0.10 |
| 11 | -0.71 | -1.33 | -0.98 | -0.12 |
| 12 | -0.50 | -0.86 | -0.94 | 0.37 |
| 13 | -0.30 | -0.87 | -0.82 | 0.19 |
| 14 | -0.61 | -1.33 | -1.04 | 0.69 |
| 15 | -0.46 | -1.35 | -1.43 | -0.18 |
| 16 | -0.51 | -1.04 | -1.12 | 0.19 |
| 17 | -0.20 | -1.09 | -1.46 | -0.24 |
| 18 | -0.52 | -1.74 | -1.40 | -0.85 |
| 19 | -0.35 | -1.94 | -2.11 | -1.00 |
| 20 | -0.12 | -1.53 | -1.10 | -1.07 |
Long-Term Momentum paid +0.69% at z=+1.1, and the bottom decile of one-year laggards fell -1.94% — defense and AI-infrastructure names sit in it. XAR fell -0.56% in the regular session and a further -1.96% after the bell on roughly seven times its typical volume, extending a -18.16% 20-day slide as investors exit the legacy prime contractors even while private capital stays committed to defense technology.
Hedge-Fund Ownership returned -0.17% at z=-1.5, and the raw version fell -0.19% — the most-owned names were hit both through their style tilts and on their own. The top-ownership decile fell -1.28%, with China ADRs the heaviest group inside it and FXI down -1.18%. Goldman Sachs Prime Brokerage reports US fundamental long/short net leverage at the 4th percentile of its one-year range and gross at the 27th, covering flows through the prior session at the latest. A book already carrying that little net exposure is not the marginal seller here; today's pressure landed on what the ownership lens can see, and the identity of the seller is not attributed by it.
Bitcoin traded at $76,037 at 4:10 PM ET, down -3.85%CNBC, and the crypto proxies took it harder: COIN closed the session -10.06%, erasing $5.7B of market value, with the miners' ETF WGMI down -3.99%. The day's news in that complex runs back to the same barrel — the US Attorney in Manhattan moved to seize $61 million of Tether tied to sanctioned Iranian petroleum sales.CNBC Elsewhere the single-name damage was idiosyncratic: Enova closed the session -23.23% after terminating its acquisition of Grasshopper BancorpBloomberg, while life-science tools was the odd pocket of strength, with Thermo Fisher +4.49% and Revvity +8.99% against a flat XLV at +0.02%.
Swaps put roughly 90% odds on a 25 bps increase from the current 3.5%–3.75% range tomorrow.Bloomberg The hike is not the open question; the projections that come with it are, because the quarter-long bid for cash-generative, low-debt equity has been trading as though more than one is coming.
Variance decomposition: live intraday — 20260915 session, bracketed against its trailing-year range. Factor returns are trailing through last close. Total cross-sectional dispersion: 18%ile of the past year.
Variance mix — % of total, today vs 1d ago vs 1-yr avg
market 61%ile style 36%ile thematic 41%ile idiosyncratic 64%ile
Variance explained — today vs. factor's trailing-year range
Marker = the factor's share of today's total variance, placed in its own trailing-year range (box 25–75%ile, ticks 90%ile and max). Amber marker = unusually load-bearing today (≥90%ile of its own year). Factor name green = up today / red = down.
Correlation & dispersion — realized vs implied
Pairwise realized correlation (20d): 8.87% 6.0%ile since 2020 · 73%ile 3m
Top-500 pairwise: 7.53% 3.9%ile since 2020 · 33%ile 3m · implied (Cboe COR1M): 14.39 11%ile of its own history (gap -6.9pp)
Realized 20d vol (ann. pts): all stocks 40 vs VIXEQ 36 · index 10 vs VIX 18 · style factors 20 72%ile
20-day window (19 completed days + today); percentiles vs model history since 2020; '3m' tokens rank vs the trailing 63 trading days; definitions in Terms below. Implied prints (Cboe) are delayed ~15 min. as of 15:58 ET
High-beta momentum cohort (eq-wt, since-2020 rank): -0.4% 37%ile · rest of market -0.8%
| Factor | Today | 1d | 5d | 20d | 60d |
|---|---|---|---|---|---|
| Style-Risk | |||||
| Residual Volatility | -0.20% z-0.4 | +1.13% | +0.50% | +1.15% | +2.81% |
| International | +0.08% z+0.3 | -0.09% | +0.12% | +1.53% | +1.07% |
| Beta | -0.21% z-0.2 | -2.34% | -3.17% | -5.00% | -12.26% |
| Style | |||||
| Dividend Yield | +0.26% z+1.5 | -0.23% | -0.11% | +0.15% | -0.58% |
| Value | +0.19% z+0.8 | -0.31% | +0.10% | +0.13% | -0.29% |
| Leverage | -0.12% z-0.7 | -0.52% | -1.05% | -1.21% | -4.21% |
| Liquidity | -0.16% z-0.6 | +0.11% | -0.21% | +1.19% | +0.95% |
| Size | +0.17% z+0.5 | -0.02% | +0.95% | +1.88% | +0.19% |
| Growth | -0.11% z-0.5 | +0.10% | -0.07% | -0.63% | +2.02% |
| Profitability | -0.03% z-0.2 | -0.35% | -0.40% | -1.16% | -3.08% |
| Style-Momentum | |||||
| Short-Term Momentum | +0.57% z+1.9 | -0.85% | -0.42% | -1.59% | -8.01% |
| Long-Term Momentum | +0.69% z+1.1 | -1.02% | +0.04% | -1.10% | -5.00% |
| One-Day Momentum | -0.20% z-0.7 | -0.76% | -0.89% | -1.73% | -2.16% |
| Medium-Term Momentum | +0.03% z+0.1 | +0.40% | +0.34% | +0.95% | +0.35% |
| Style-Positioning | |||||
| Hedge-Fund Ownership | -0.17% z-1.5 | -0.03% | -0.30% | -0.09% | +0.68% |
| Short Interest | -0.13% z-0.8 | +0.33% | -0.14% | +0.09% | +0.23% |
| Style-Flow | |||||
| Short-Sale Activity | +0.07% z+0.6 | +0.14% | +0.48% | +0.73% | +1.03% |
| Morning Activity | +0.07% z+0.6 | +0.04% | -0.17% | +1.19% | +2.30% |
| Thematic | |||||
| Oil | +0.71% z+1.5 | -0.30% | +0.84% | +3.36% | +4.99% |
| Semiconductors | +0.56% z+0.9 | -2.11% | -1.43% | -3.05% | -7.56% |
| China | -0.27% z-0.7 | +0.07% | -0.08% | +0.32% | +0.65% |
| Gold | -0.14% z-0.5 | +0.07% | -0.72% | +2.12% | +3.44% |
| Bitcoin / Crypto | -0.10% z-0.3 | +0.77% | +0.80% | +2.76% | +1.93% |
| Treasury (Duration) | -0.01% z-0.0 | +0.02% | -0.64% | -1.42% | -0.70% |
5/20/60d windows include today's session; 1d is the previous session.
Market variance share. The fraction of cross-sectional variance explained by the market factor — the attribution companion to pairwise correlation, not a substitute for it.
Factor z-score. Today's factor return divided by its daily-return standard deviation over ~1,600 trading days.
Stock-specific (idiosyncratic) return. The part of a stock's move not explained by market, style, or thematic factors in our decomposition.
Data compiled by FactorPulse AI; edited and verified by Jeff Klein. For informational purposes only. Does not constitute financial advice, an investment recommendation, or an offer to buy or sell any securities. Always consult a qualified financial professional before making investment decisions.
For more on factor construction methodology, see www.factorpulse.com/glossary.