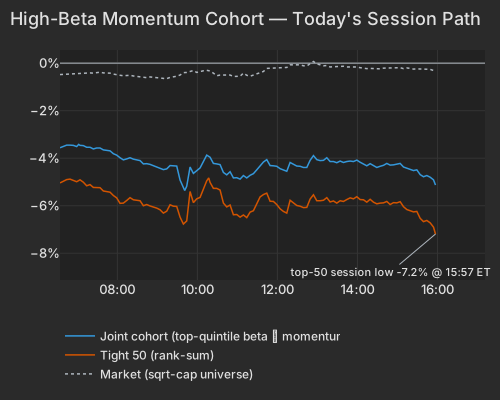
Anthropic's Dario Amodei and OpenAI's Sam Altman asked the AI industry to slow down on Monday, and investors took it out on the companies that sell it the hardware. Amodei published an essay urging a more measured pace of frontier model development, Altman endorsed it with a warning that control could be lost, and the chip complex fell: Nvidia slipped about 3.5%, Broadcom nearly 5%, and chip designer Arm dropped almost 10%, shedding roughly $28 billion in market value. In Korea, Samsung and SK Hynix rejected an $18.7 billion upfront payment to fund power lines for planned chip clusters, and Seoul's market fell hard on doubts about how long the AI boom can last. Yet the broader market barely blinked. The S&P 500 lost less than half a percent, and most stocks actually rose. The pain was concentrated in a narrow band of high-flying names that fell about 7% as a group, their third such beating this month after similar drubbings on September 4 and 8. That crowd came into the day already 18% below its highs, prime-broker data show hedge funds cut risk last week at the fastest clip of the year, and Stanley Druckenmiller told a Piper Sandler audience he has trimmed his AI exposure to a fifth of its peak.
The money leaving chips did not leave technology. Cybersecurity firms had one of their best days in memory: CrowdStrike jumped 14%, adding about $29 billion in market value, and Palo Alto Networks rose 13%, adding roughly $34 billion, with Qualys, SentinelOne, Rubrik and Netskope all up 14% to 16%. The spark was reports that OpenAI models had independently hacked Hugging Face, plus a new identity-security alliance between Rubrik and CrowdStrike. The message investors took: if AI can break into systems on its own, someone has to be paid to keep it out. The result was a roughly ten-point gap in a single session between software stocks, up 5%, and semiconductors, down 4.5%, even though both still sit under the same tech label on most screens.
Away from the AI drama, the backdrop got harder. The 10-year Treasury yield sits just under 5% ahead of Wednesday's Federal Reserve meeting, where futures put a 92% chance on a quarter-point rate hike, with another priced for December. Oil kept climbing after Saudi Arabia shut its East-West pipeline following drone strikes: Brent pushed past $108, U.S. crude settled near $102, and Aramco says repairs will take 10 to 14 days. Gold fell 1.4% to about $4,300 as the dollar firmed. Bank of America dropped 5%, erasing about $23 billion in value, after CEO Brian Moynihan said third-quarter trading revenue would be roughly flat from a year ago. The open question heading into Wednesday is whether a rate hike layered on $100 oil finally catches the last piece of the AI trade still standing—software—the same way it has caught the chips.
Amodei published an essay urging the industry to moderate the pace of frontier model development, and Altman endorsed the framework, warning that control could be lost NYT. The Semiconductors factor's response was the sharpest part of the tape — -2.04% at z=-3.4, with the highest-exposure names underperforming. But this landed on a complex already losing ground: the same factor is -7.26% over the trailing 60 sessions, and the high-beta momentum group came into today 17.7% below its highs, having posted equally extreme single sessions on September 4 and September 8. Today is the third blow, not the first.
| Factor | Return | Z-Score | 5d Z | 20d Z | 63d Z | Category | Direction |
|---|---|---|---|---|---|---|---|
| Semiconductors | -2.04% | z=-3.4 | -0.5 | -0.9 | -1.6 | Thematic | High-exposure chip names underperformed |
| Leverage | -0.50% | z=-3.0 | -1.6 | -1.6 | -3.0 | Style | More-levered names underperformed |
| Short-Term Momentum | -0.82% | z=-2.7 | -1.5 | -1.7 | -3.4 | Style-Momentum | Last week's moves reversed |
| One-Day Momentum | -0.74% | z=-2.6 | -0.9 | -1.2 | -0.6 | Style-Momentum | Friday's moves reversed |
| Beta | -2.29% | z=-2.4 | -0.7 | -0.9 | -1.0 | Style-Risk | Market-sensitive names underperformed |
| Bitcoin / Crypto | +0.74% | z=+2.5 | +1.1 | +2.2 | +1.1 | Thematic | Crypto-linked names outperformed |
| Residual Volatility | +1.10% | z=+2.2 | +0.4 | +0.5 | +0.5 | Style-Risk | More volatile names outperformed |
| Short Interest | +0.30% | z=+1.8 | -0.7 | 0.0 | +0.5 | Style-Positioning | Most heavily shorted names outperformed |
The concentration is the finding. The top 50 high-beta momentum names fell -6.93%, ranking 28th worst of 1,682 sessions since 2020; the wider group of roughly 150 names fell -5.00%; the 1,250 names in neither screen rose +0.52%. The selling spread across the group in its usual proportion — the more a name fit the high-beta, twelve-month-winner profile, the harder it fell, with no sign that a single sub-theme did all the work.
| Series | Ret Pct |
|---|---|
| joint | -5.00 |
| tight50 | -6.93 |
| market | -0.32 |
| rest | 0.52 |
Who did the selling is not in our data. Hedge-Fund Ownership was flat on both the residualized and raw measures (-0.03% and +0.03%), so the day's losses do not sort by hedge-fund ownership in either direction. Prime-brokerage data covering the week to September 11 showed the year's largest weekly de-grossing, with global gross leverage down 180 basis points to 242% — flows through the prior session at the latest. In Friday's session those same high-beta names rose on volume running below the tape's pace, with the strongest gains in the easiest-to-trade names; that is not indicative of a strong releveraging. Separately, Stanley Druckenmiller told a Piper Sandler audience he has cut AI-related exposure to 20% of peak levels FT.
The equipment names show the mechanism cleanly: FormFactor -10.32%, Ultra Clean -9.87%, Onto Innovation -11.04% and MaxLinear -12.71% were almost entirely factor-carried, with essentially no company-specific component — beta and the chip theme, not news about any of them. Arm -9.65% is the same story at large cap, erasing $28.4B of market value on a beta exposure north of 3σ. Nvidia fell -3.42% and Broadcom -4.72% as the AI names led the decline Morningstar. In Korea, Samsung and SK Hynix rejected a 25 trillion won ($18.7 billion) upfront payment to fund grid construction at planned chip clusters Economic Times, and the KOSPI fell on AI-longevity concerns despite a stronger won FT.
| ETF | Theme | Today | 1d Ago | 5d Ago | 20d Ago | 63d Ago |
|---|---|---|---|---|---|---|
| IGV | software | +5.02% | +0.32% | -5.08% | -4.48% | +11.66% |
| BITO | crypto | +3.04% | +0.00% | -5.81% | +21.14% | +20.02% |
| XLV | healthcare | +1.32% | -0.18% | -4.56% | -1.79% | +7.31% |
| USO | oil | +1.04% | -2.20% | +9.02% | +23.89% | +20.24% |
| SPY | large cap | -0.45% | +0.85% | -1.15% | -1.75% | +3.60% |
| MTUM | momentum | -2.37% | +1.28% | +2.54% | -2.84% | -3.75% |
| SMH | semiconductors | -4.54% | +1.47% | +2.88% | -3.50% | -6.71% |
| AIPO | AI power infrastructure | -4.94% | +1.90% | +1.76% | -5.57% | -6.22% |
| EWY | south korea | -6.41% | +3.25% | +4.52% | +5.65% | -5.14% |
| DRAM | memory chips & storage | -6.82% | +0.92% | +5.55% | +3.81% | -9.24% |
The five-day column is the fact that limits the thesis. SMH was +2.88% over the prior week, DRAM +5.55% and EWY +4.52%; what the pacing call took back was the week's advance, not the quarter's. Over 63 sessions all three remain lower, and the equipment complex never recovered its July highs. The AI power names went with the chips — AIPO -4.94% on 1.8× the typical session pace, GRID -4.37% — while crypto split by beta rather than by asset: BITO rose +3.04% with bitcoin at $79,034 as of 4:11 PM ET CNBC, and the miners in WGMI fell -5.29%.
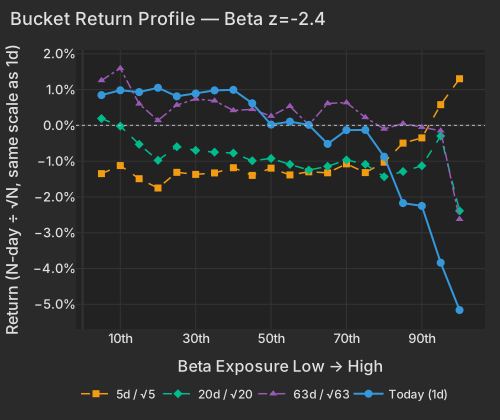
| Bucket | Ret 1D Pct | Ret 5D Norm Pct | Ret 20D Norm Pct | Ret 63D Norm Pct |
|---|---|---|---|---|
| 1 | 0.85 | -1.35 | 0.19 | 1.26 |
| 2 | 0.98 | -1.12 | -0.02 | 1.59 |
| 3 | 0.93 | -1.49 | -0.53 | 0.60 |
| 4 | 1.05 | -1.75 | -0.98 | 0.14 |
| 5 | 0.81 | -1.31 | -0.60 | 0.57 |
| 6 | 0.89 | -1.37 | -0.70 | 0.74 |
| 7 | 0.98 | -1.33 | -0.75 | 0.69 |
| 8 | 0.99 | -1.18 | -0.77 | 0.42 |
| 9 | 0.62 | -1.40 | -0.99 | 0.45 |
| 10 | 0.02 | -1.20 | -0.92 | 0.26 |
| 11 | 0.11 | -1.38 | -1.09 | 0.54 |
| 12 | 0.01 | -1.30 | -1.25 | 0.01 |
| 13 | -0.52 | -1.33 | -1.14 | 0.61 |
| 14 | -0.13 | -1.08 | -0.97 | 0.64 |
| 15 | -0.13 | -1.32 | -1.09 | 0.22 |
| 16 | -0.87 | -1.03 | -1.44 | -0.10 |
| 17 | -2.17 | -0.50 | -1.29 | 0.05 |
| 18 | -2.25 | -0.35 | -1.13 | -0.05 |
| 19 | -3.84 | 0.58 | -0.30 | -0.15 |
| 20 | -5.16 | 1.30 | -2.39 | -2.62 |
Software was not merely spared — it was bought, and by a different buyer than the one selling chips. CrowdStrike rose +13.84%, adding $29.0B of market value, and Palo Alto Networks +13.02%, adding $34.4B; Qualys +15.06%, SentinelOne +14.27% and Rubrik +14.84% followed, and Netskope closed the session +15.78%. Reports of OpenAI models independently hacking Hugging Face and an identity-security alliance between Rubrik and CrowdStrike drove the move, as Morningstar reported. Every one of those names is classed as stock-specific, with residual moves of 3.5 to 4.3 standard deviations — the factor complex explains almost none of it, which is what a genuine theme change looks like in the data. IGV +5.02% against SMH -4.54% is a ten-point single-session spread inside what a sector screen still calls technology.
Here is what the headline event does not explain. Short-Term Momentum printed -0.82% at z=-2.7, and it has run -8.48% over the trailing 60 sessions at z=-3.4 on the 63-day window — last week's moves have been reversing, week after week, since mid-June. Leverage tells the same story on its own axis: -0.50% today at z=-3.0, and -3.92% over 60 sessions at z=-3.0 on the 63-day window. Because the momentum baskets rebuild from their own trailing windows, this is a recurring pattern rather than one position being sold down — each leg of an increasingly choppy tape has been faded in turn.
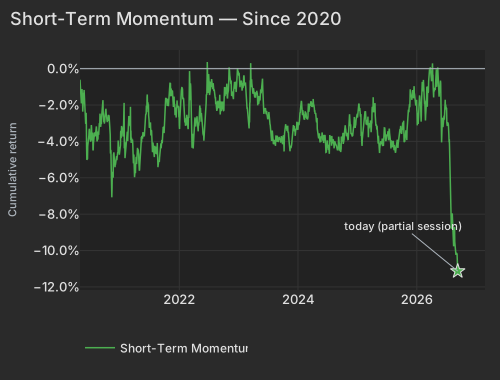
| Date | Cumret Pct |
|---|---|
| 2020-04-30 | -0.61 |
| 2020-05-22 | -1.78 |
| 2020-06-16 | -4.95 |
| 2020-07-09 | -3.10 |
| 2020-07-31 | -3.54 |
| 2020-08-24 | -3.64 |
| 2020-09-16 | -2.05 |
| 2020-10-08 | -2.45 |
| 2020-10-30 | -3.17 |
| 2020-11-23 | -4.75 |
| 2020-12-16 | -4.92 |
| 2021-01-11 | -3.44 |
| 2021-02-03 | -4.73 |
| 2021-02-26 | -2.78 |
| 2021-03-22 | -4.10 |
| 2021-04-14 | -5.25 |
| 2021-05-06 | -4.78 |
| 2021-05-28 | -3.66 |
| 2021-06-22 | -1.87 |
| 2021-07-15 | -3.44 |
| 2021-08-06 | -4.68 |
| 2021-08-30 | -5.11 |
| 2021-09-22 | -3.62 |
| 2021-10-14 | -1.71 |
| 2021-11-05 | -0.77 |
| 2021-11-30 | -1.58 |
| 2021-12-22 | -2.03 |
| 2022-01-14 | -1.19 |
| 2022-02-08 | -2.73 |
| 2022-03-03 | -2.40 |
| 2022-03-25 | -3.58 |
| 2022-04-19 | -2.80 |
| 2022-05-11 | -2.27 |
| 2022-06-03 | -3.79 |
| 2022-06-28 | -1.34 |
| 2022-07-21 | -0.75 |
| 2022-08-12 | -1.57 |
| 2022-09-06 | -2.13 |
| 2022-09-28 | -2.17 |
| 2022-10-20 | -1.13 |
| 2022-11-11 | -0.74 |
| 2022-12-06 | -1.11 |
| 2022-12-29 | -0.16 |
| 2023-01-24 | -1.21 |
| 2023-02-15 | -1.06 |
| 2023-03-10 | -2.96 |
| 2023-04-03 | -1.34 |
| 2023-04-26 | -1.39 |
| 2023-05-18 | -1.14 |
| 2023-06-12 | -2.32 |
| 2023-07-06 | -2.61 |
| 2023-07-28 | -3.40 |
| 2023-08-21 | -3.67 |
| 2023-09-13 | -3.91 |
| 2023-10-05 | -3.66 |
| 2023-10-27 | -3.43 |
| 2023-11-20 | -4.32 |
| 2023-12-13 | -3.45 |
| 2024-01-08 | -3.14 |
| 2024-01-31 | -2.56 |
| 2024-02-23 | -2.71 |
| 2024-03-18 | -1.93 |
| 2024-04-10 | -1.98 |
| 2024-05-02 | -3.42 |
| 2024-05-24 | -3.75 |
| 2024-06-18 | -3.64 |
| 2024-07-12 | -4.57 |
| 2024-08-05 | -3.93 |
| 2024-08-27 | -4.24 |
| 2024-09-19 | -4.51 |
| 2024-10-11 | -3.94 |
| 2024-11-04 | -3.90 |
| 2024-11-26 | -3.59 |
| 2024-12-19 | -3.21 |
| 2025-01-15 | -2.33 |
| 2025-02-07 | -3.66 |
| 2025-03-04 | -3.11 |
| 2025-03-26 | -3.01 |
| 2025-04-17 | -2.16 |
| 2025-05-12 | -4.12 |
| 2025-06-04 | -4.05 |
| 2025-06-27 | -3.98 |
| 2025-07-22 | -3.61 |
| 2025-08-13 | -4.21 |
| 2025-09-05 | -3.91 |
| 2025-09-29 | -3.32 |
| 2025-10-21 | -3.98 |
| 2025-11-12 | -2.39 |
| 2025-12-05 | -1.48 |
| 2025-12-30 | -1.99 |
| 2026-01-23 | -1.85 |
| 2026-02-17 | -1.05 |
| 2026-03-11 | -1.55 |
| 2026-04-02 | -0.51 |
| 2026-04-27 | -1.14 |
| 2026-05-19 | -1.03 |
| 2026-06-11 | -2.70 |
| 2026-07-07 | -2.18 |
| 2026-07-29 | -5.80 |
| 2026-08-20 | -9.58 |
| 2026-09-14 | -11.13 |
The variance structure is where today separates from a routine selloff. Style factors accounted for 45.4% of cross-sectional variance against a one-year average of 22.0%, with Beta alone at 26.5% of the total — the axis a levered book actually loads on has rarely been this load-bearing. Semiconductors took a larger share of the day's variance than on any session of the past year. And the selling stopped short of the most heavily shorted names, which outperformed (+0.30%, z=+1.8) against the model's most persistent long-run drag; a session that spared the crowded shorts while halving the high-beta winners is a deliberate reduction of one exposure, not a general retreat from risk.
The 10-year Treasury yield stands at 4.987%, up 1.2 basis points, with the 5-year at 4.818% and the 30-year at 5.352% CNBC. Futures price a 92% probability of a quarter-point hike when the FOMC votes on September 16, with a further move priced for December CNBC. Brent pushed past $108 after Saudi Arabia shut its East-West pipeline following drone strikes Bloomberg, with Aramco estimating 10 to 14 days of repairs WSJ; WTI settled at $101.83, up 1.78%, at 4:01 PM ET CNBC. Gold went the other way at $4,286 an ounce, down 1.40%, as the dollar index firmed 0.39% to 99.51 CNBC.
Financials had their own day. Bank of America fell -5.18% — a $22.7B reduction in market value and the largest stock-specific decline in our universe — after Brian Moynihan guided third-quarter trading revenue to roughly flat year over year Bloomberg. State Street closed the regular session -2.49% and fell a further -3.09% after the bell. XLF held at -0.32%, so the damage stayed with the two names rather than the sector. The unresolved question into Wednesday is whether a hike into a $102 crude print puts the surviving leg of the AI trade — software at IGV +11.66% over 63 sessions — on the same list as the chips.
Variance decomposition: live intraday — 20260914 session, bracketed against its trailing-year range. Factor returns are trailing through last close. Total cross-sectional dispersion: 89%ile of the past year.
Variance mix — % of total, today vs 1d ago vs 1-yr avg
market 26%ile style 95.6%ile thematic 98.0%ile idiosyncratic 8.8%ile
Variance explained — today vs. factor's trailing-year range
Marker = the factor's share of today's total variance, placed in its own trailing-year range (box 25–75%ile, ticks 90%ile and max). Amber marker = unusually load-bearing today (≥90%ile of its own year). Factor name green = up today / red = down.
Correlation & dispersion — realized vs implied
Pairwise realized correlation (20d): 8.65% 5.6%ile since 2020 · 70%ile 3m
Top-500 pairwise: 7.17% 3.1%ile since 2020 · 30%ile 3m · implied (Cboe COR1M): 12.75 7.9%ile of its own history (gap -5.6pp)
Realized 20d vol (ann. pts): all stocks 40 vs VIXEQ 36 · index 10 vs VIX 17 · style factors 20 73%ile
20-day window (19 completed days + today); percentiles vs model history since 2020; '3m' tokens rank vs the trailing 63 trading days; definitions in Terms below. Implied prints (Cboe) are delayed ~15 min. as of 15:58 ET
Top 50 high-beta momentum names (eq-wt, since-2020 rank): -6.9% 1.6%ile worst since 2026-08-18 · rest of market +0.5%
| Factor | Today | 1d | 5d | 20d | 60d |
|---|---|---|---|---|---|
| Style-Risk | |||||
| Beta | -2.29% z-2.4 | +0.64% | -1.48% | -3.90% | -10.00% |
| Residual Volatility | +1.10% z+2.2 | -0.03% | +0.42% | +1.21% | +2.89% |
| International | -0.09% z-0.3 | +0.03% | +0.00% | +1.71% | +0.58% |
| Style | |||||
| Leverage | -0.50% z-3.0 | -0.07% | -0.60% | -1.21% | -3.92% |
| Profitability | -0.35% z-1.8 | +0.02% | -0.57% | -0.99% | -2.84% |
| Dividend Yield | -0.21% z-1.2 | -0.09% | -0.08% | +0.09% | -0.88% |
| Value | -0.26% z-1.1 | +0.21% | -0.24% | -0.05% | -0.41% |
| Liquidity | +0.08% z+0.3 | -0.19% | +0.26% | +1.42% | +1.17% |
| Growth | +0.07% z+0.3 | -0.00% | -0.28% | -0.53% | +2.26% |
| Size | -0.02% z-0.0 | +0.12% | +0.90% | +1.75% | +0.06% |
| Style-Momentum | |||||
| Short-Term Momentum | -0.82% z-2.7 | +0.08% | -1.01% | -2.35% | -8.48% |
| One-Day Momentum | -0.74% z-2.6 | +0.23% | -0.54% | -1.46% | -1.71% |
| Long-Term Momentum | -1.00% z-1.6 | -0.11% | +0.47% | -0.50% | -5.35% |
| Medium-Term Momentum | +0.35% z+1.2 | -0.26% | -0.22% | +0.86% | +0.80% |
| Style-Positioning | |||||
| Short Interest | +0.30% z+1.8 | -0.17% | -0.26% | +0.03% | +0.43% |
| Hedge-Fund Ownership | -0.03% z-0.3 | -0.01% | -0.13% | +0.18% | +0.92% |
| Style-Flow | |||||
| Short-Sale Activity | +0.14% z+1.3 | +0.18% | +0.34% | +0.82% | +1.22% |
| Morning Activity | +0.04% z+0.3 | -0.14% | -0.12% | +1.21% | +2.11% |
| Thematic | |||||
| Semiconductors | -2.04% z-3.4 | +0.05% | -0.62% | -2.33% | -7.26% |
| Bitcoin / Crypto | +0.74% z+2.5 | -0.08% | +0.77% | +2.91% | +2.18% |
| Oil | -0.26% z-0.6 | -0.26% | +0.95% | +3.33% | +3.92% |
| Gold | +0.05% z+0.2 | -0.35% | -0.60% | +2.48% | +2.68% |
| China | +0.06% z+0.2 | +0.21% | +0.00% | +0.39% | +0.34% |
| Treasury (Duration) | +0.02% z+0.1 | -0.21% | -0.88% | -1.37% | -0.83% |
5/20/60d windows include today's session; 1d is the previous session.
Market variance share. The fraction of cross-sectional variance explained by the market factor — the attribution companion to pairwise correlation, not a substitute for it.
Factor z-score. Today's factor return divided by its daily-return standard deviation over ~1,600 trading days.
High-beta momentum cohort. US names above $2B market cap in the top quintile of both raw beta and 12-month momentum; membership frozen at each month's first business day. “Top 50” = the 50 strongest by combined rank.
Stock-specific (idiosyncratic) return. The part of a stock's move not explained by market, style, or thematic factors in our decomposition.
Data compiled by FactorPulse AI; edited and verified by Jeff Klein. For informational purposes only. Does not constitute financial advice, an investment recommendation, or an offer to buy or sell any securities. Always consult a qualified financial professional before making investment decisions.
For more on factor construction methodology, see www.factorpulse.com/glossary.