An essay from Anthropic chief Dario Amodei urging the AI industry to slow the race toward ever-bigger models, publicly backed by Sam Altman and Elon Musk, knocked the riskiest corner of the AI boom before Wall Street even opened. Memory-chip maker Micron was down about 6%, erasing roughly $70 billion in value, and chip-equipment maker Lam Research fell around 8%, shedding some $31 billion. Overnight in Asia, Japanese tech investor SoftBank dropped more than 10% and Korean chip giants SK Hynix and Samsung Electronics were sold heavily, dragging South Korea's market down more than 5%. Beijing's foreign ministry dismissed the pause talk as "fearmongering," and Washington pushed back on the idea of developers setting their own moratoriums. The hit was concentrated: the broad market was off less than 1%, and the AI names that had simply risen over the past year without being the most volatile were essentially flat.
This is the third such blow in two weeks, not the first — the same group of high-flying stocks closed Friday already about 18% below its high, and last week's bounce in memory chips and semiconductors was erased in a single morning. Veteran investor Stanley Druckenmiller told a Piper Sandler conference he has cut his AI exposure to a fifth of its peak and sees no need for Fed rate cuts. The physical side of the buildout is straining too: Samsung and SK Hynix rejected an $18.7 billion upfront payment proposal for grid infrastructure, and rural communities are turning down new data centers even where they need the tax revenue.
The rest of the market largely shrugged. Software stocks rose about 2%, and drugmaker GSK gained around 4% after lung-cancer trial results that included a 94% response rate in previously untreated patients. Energy was the only sector in the green after Saudi Arabia shut its East-West pipeline following drone strikes, sending U.S. crude up about 4.5% to roughly $105 a barrel and Brent past $108. Gold, notably, offered no shelter, falling nearly 2%. With the 10-year Treasury yield near 5% and markets pricing about a 90% chance of a quarter-point rate hike after August's hot inflation reading, Wednesday's Fed decision arrives with the market's most exuberant stocks already marked down.
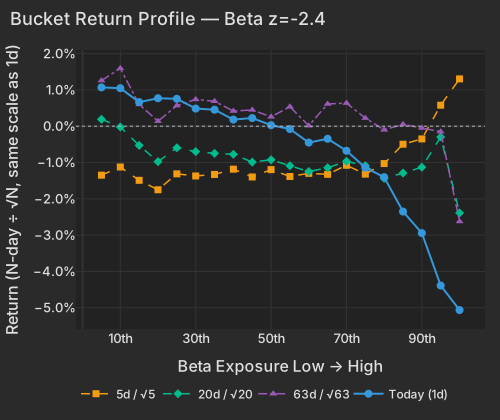
The cross-section is sorting almost perfectly on beta exposure, with the highest-exposure bucket off -5.05%. Micron is -6.42%, erasing $70.6B of market value, and virtually none of that is the stock's own move — the style leg accounts for -6.54% of it. Lam Research is -8.32%, shedding $31.1B, with its stock-specific piece a rounding error. Through the pre-open marks Beta alone carries 59% of cross-sectional variance, a larger share than on any day in the trailing year. Overnight, SoftBank Group fell more than 10% and SK Hynix and Samsung Electronics sold heavily NYT, with EWY at -5.55%; Beijing's foreign ministry called the pause talk "fearmongering" and Washington pushed back on developer-led moratoriums NYT.
| Factor | Return | Z-Score | 5d Z | 20d Z | 63d Z | Category | Direction |
|---|---|---|---|---|---|---|---|
| Beta | -2.31% | z=-2.4 | -0.7 | -0.9 | -1.0 | Style-Risk | Higher-beta names underperformed |
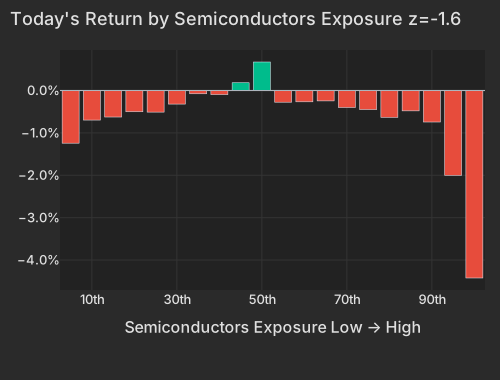
| Semiconductors | -0.98% | z=-1.6 | +0.3 | -0.5 | -1.4 | Thematic | Semis-exposed names underperformed |
| Profitability | -0.26% | z=-1.4 | -1.1 | -1.1 | -2.1 | Style | More profitable names underperformed |
| Short-Term Momentum | -0.37% | z=-1.2 | -0.8 | -1.4 | -3.2 | Style-Momentum | 5-day reversion, a quarter deep |
| Long-Term Momentum | -0.58% | z=-0.9 | +0.6 | -0.0 | -1.0 | Style-Momentum | 12-month winners modestly lower |
| Bitcoin / Crypto | +0.34% | z=+1.1 | +0.5 | +1.9 | +0.9 | Thematic | Crypto-exposed names outperformed |
| Hedge-Fund Ownership | +0.01% | z=+0.1 | -0.3 | +0.5 | +1.3 | Style-Positioning | Flat — no ownership signal today |
| Bucket | Ret 1D Pct | Ret 5D Norm Pct | Ret 20D Norm Pct | Ret 63D Norm Pct |
|---|---|---|---|---|
| 1 | 1.07 | -1.35 | 0.19 | 1.26 |
| 2 | 1.05 | -1.12 | -0.02 | 1.59 |
| 3 | 0.66 | -1.49 | -0.53 | 0.60 |
| 4 | 0.77 | -1.75 | -0.98 | 0.14 |
| 5 | 0.75 | -1.31 | -0.60 | 0.57 |
| 6 | 0.49 | -1.37 | -0.70 | 0.74 |
| 7 | 0.45 | -1.33 | -0.75 | 0.69 |
| 8 | 0.18 | -1.18 | -0.77 | 0.42 |
| 9 | 0.22 | -1.40 | -0.99 | 0.45 |
| 10 | 0.03 | -1.20 | -0.92 | 0.26 |
| 11 | -0.08 | -1.38 | -1.09 | 0.54 |
| 12 | -0.45 | -1.30 | -1.25 | 0.01 |
| 13 | -0.35 | -1.33 | -1.14 | 0.61 |
| 14 | -0.68 | -1.08 | -0.97 | 0.64 |
| 15 | -1.14 | -1.32 | -1.09 | 0.22 |
| 16 | -1.40 | -1.03 | -1.44 | -0.10 |
| 17 | -2.35 | -0.50 | -1.29 | 0.05 |
| 18 | -2.94 | -0.35 | -1.13 | -0.05 |
| 19 | -4.39 | 0.58 | -0.30 | -0.15 |
| 20 | -5.06 | 1.30 | -2.39 | -2.62 |
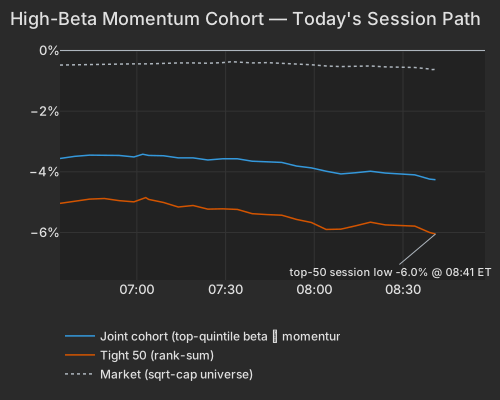
Split the screen and the momentum leg is barely marked. The top 50 high-beta momentum names are at -6.03%, a mark that already ranks among the 50 worst readings since 2020 with the session not yet open; the roughly 150-name version of the high-beta momentum cohort is at -4.27%. Names clearing the high-beta screen alone are at -2.47%, names clearing the 12-month-winners screen alone at -0.03%. The selling concentrated hard in the names that most fit the profile, running at 1.41× the group's normal amplification. Nothing in the ownership lenses attributes the seller — Hedge-Fund Ownership is flat at +0.01% and flat on a raw basis too — so the trade is being sold with the seller unattributed. The one tilt the data does license is retail: the top 50 score +1.14σ on habitual early-session trading.
| Series | Ret Pct |
|---|---|
| joint | -4.27 |
| tight50 | -6.03 |
| market | -0.63 |
| rest | 0.26 |
The five-day column is the tell: every instrument that led the prior week's bounce is giving the whole thing back in one pre-open session, while oil and volatility take the other side.
| ETF | Theme | Today | 1d Ago | 5d Ago | 20d Ago | 63d Ago |
|---|---|---|---|---|---|---|
| DRAM | memory chips & storage | -7.44% | +0.92% | +5.55% | +3.81% | -9.24% |
| EWY | south korea | -5.55% | +3.25% | +4.52% | +5.65% | -5.14% |
| SMH | semiconductors | -5.02% | +1.47% | +2.88% | -3.50% | -6.71% |
| AIPO | AI power infrastructure | -4.35% | +1.90% | +1.76% | -5.57% | -6.22% |
| MTUM | momentum | -2.62% | +1.28% | +2.54% | -2.84% | -3.75% |
| SPY | large cap | -0.74% | +0.85% | -1.15% | -1.75% | +3.60% |
| IGV | software | +2.02% | +0.32% | -5.08% | -4.48% | +11.66% |
| XLE | energy | +1.55% | +0.32% | +0.80% | +6.68% | +14.04% |
| USO | oil | +3.00% | -2.20% | +9.02% | +23.89% | +20.24% |
| VXX | volatility | +3.79% | -4.29% | +2.55% | -7.90% | -28.63% |
That rebound was thin while it was happening: in Friday's session the same names rose on volume below the tape's pace, with the buying strongest in the easiest-to-trade names. The physical side of the buildout is also still tightening — Samsung and SK Hynix rejected an $18.7 billion upfront power payment proposal for grid infrastructure FT, and rural communities are turning down new data-center siting even where the tax base needs it Bloomberg.
This is not a market repricing of AI: SPY is -0.74%, and software is up, with IGV +2.02% and XLV +1.15%. Palo Alto Networks is +5.12%, almost entirely the stock's own move, and today's coverage does not carry the driver. GSK is +4.20% after the Jideytro and Ris-Rez lung-cancer readouts, including a 94% objective response rate in treatment-naive patients Morningstar. Energy is the only sector bid at +0.91%, with USO trading at 1.7× its typical session pace, after Saudi Arabia shut its East-West pipeline following drone strikes and Brent pushed past $108 Bloomberg. WTI is $104.54 as of 8:45 AM ET CNBC. The Oil factor, though, is only +0.09% at z=+0.2 — crude is moving the energy complex, not the cross-section. Gold spot is $4,274.19 at 8:54 AM ET, -1.68%, with the dollar index at 99.65 CNBC; GDX is -3.31%, so the metals are not the haven this morning.
| Bucket | Avg Ret Pct |
|---|---|
| 1 | -1.24 |
| 2 | -0.70 |
| 3 | -0.63 |
| 4 | -0.50 |
| 5 | -0.51 |
| 6 | -0.32 |
| 7 | -0.08 |
| 8 | -0.10 |
| 9 | 0.18 |
| 10 | 0.67 |
| 11 | -0.28 |
| 12 | -0.27 |
| 13 | -0.25 |
| 14 | -0.40 |
| 15 | -0.45 |
| 16 | -0.63 |
| 17 | -0.48 |
| 18 | -0.74 |
| 19 | -2.00 |
| 20 | -4.42 |
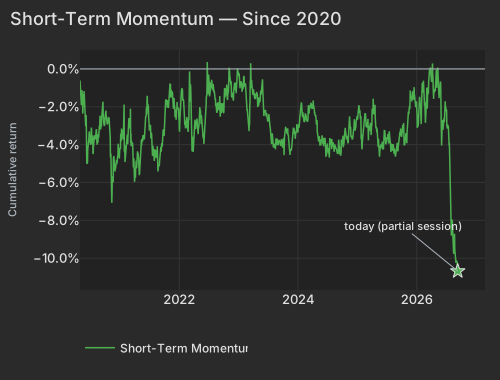
Underneath the headline factor, the fast axis is the durable one. Short-Term Momentum — the 5-day trend factor, one week less one day — is -0.37% today and -8.03% over the past 60 sessions at z=-3.2 on the 63-day window. Its basket rebuilds every week, so a run this persistent says recent movers keep snapping back, leg after leg, rather than one basket being sold down for a quarter. Its exposures correlate 0.27 with the high-beta momentum screen, which makes today's damage and that reversion run the same position seen twice. A run this deep through a documented de-grossing episode — JPMorgan pulled leverage financing from Leopold Aschenbrenner's Situational Awareness after a 67% July drawdown, forcing it to sell public equity holdings to Citadel FT — is indicative of deleveraging and releveraging churn rather than a directional verdict on the names.
| Date | Cumret Pct |
|---|---|
| 2020-04-30 | -0.61 |
| 2020-05-22 | -1.78 |
| 2020-06-16 | -4.95 |
| 2020-07-09 | -3.10 |
| 2020-07-31 | -3.54 |
| 2020-08-24 | -3.64 |
| 2020-09-16 | -2.05 |
| 2020-10-08 | -2.45 |
| 2020-10-30 | -3.17 |
| 2020-11-23 | -4.75 |
| 2020-12-16 | -4.92 |
| 2021-01-11 | -3.44 |
| 2021-02-03 | -4.73 |
| 2021-02-26 | -2.78 |
| 2021-03-22 | -4.10 |
| 2021-04-14 | -5.25 |
| 2021-05-06 | -4.78 |
| 2021-05-28 | -3.66 |
| 2021-06-22 | -1.87 |
| 2021-07-15 | -3.44 |
| 2021-08-06 | -4.68 |
| 2021-08-30 | -5.11 |
| 2021-09-22 | -3.62 |
| 2021-10-14 | -1.71 |
| 2021-11-05 | -0.77 |
| 2021-11-30 | -1.58 |
| 2021-12-22 | -2.03 |
| 2022-01-14 | -1.19 |
| 2022-02-08 | -2.73 |
| 2022-03-03 | -2.40 |
| 2022-03-25 | -3.58 |
| 2022-04-19 | -2.80 |
| 2022-05-11 | -2.27 |
| 2022-06-03 | -3.79 |
| 2022-06-28 | -1.34 |
| 2022-07-21 | -0.75 |
| 2022-08-12 | -1.57 |
| 2022-09-06 | -2.13 |
| 2022-09-28 | -2.17 |
| 2022-10-20 | -1.13 |
| 2022-11-11 | -0.74 |
| 2022-12-06 | -1.11 |
| 2022-12-29 | -0.16 |
| 2023-01-24 | -1.21 |
| 2023-02-15 | -1.06 |
| 2023-03-10 | -2.96 |
| 2023-04-03 | -1.34 |
| 2023-04-26 | -1.39 |
| 2023-05-18 | -1.14 |
| 2023-06-12 | -2.32 |
| 2023-07-06 | -2.61 |
| 2023-07-28 | -3.40 |
| 2023-08-21 | -3.67 |
| 2023-09-13 | -3.91 |
| 2023-10-05 | -3.66 |
| 2023-10-27 | -3.43 |
| 2023-11-20 | -4.32 |
| 2023-12-13 | -3.45 |
| 2024-01-08 | -3.14 |
| 2024-01-31 | -2.56 |
| 2024-02-23 | -2.71 |
| 2024-03-18 | -1.93 |
| 2024-04-10 | -1.98 |
| 2024-05-02 | -3.42 |
| 2024-05-24 | -3.75 |
| 2024-06-18 | -3.64 |
| 2024-07-12 | -4.57 |
| 2024-08-05 | -3.93 |
| 2024-08-27 | -4.24 |
| 2024-09-19 | -4.51 |
| 2024-10-11 | -3.94 |
| 2024-11-04 | -3.90 |
| 2024-11-26 | -3.59 |
| 2024-12-19 | -3.21 |
| 2025-01-15 | -2.33 |
| 2025-02-07 | -3.66 |
| 2025-03-04 | -3.11 |
| 2025-03-26 | -3.01 |
| 2025-04-17 | -2.16 |
| 2025-05-12 | -4.12 |
| 2025-06-04 | -4.05 |
| 2025-06-27 | -3.98 |
| 2025-07-22 | -3.61 |
| 2025-08-13 | -4.21 |
| 2025-09-05 | -3.91 |
| 2025-09-29 | -3.32 |
| 2025-10-21 | -3.98 |
| 2025-11-12 | -2.39 |
| 2025-12-05 | -1.48 |
| 2025-12-30 | -1.99 |
| 2026-01-23 | -1.85 |
| 2026-02-17 | -1.05 |
| 2026-03-11 | -1.55 |
| 2026-04-02 | -0.51 |
| 2026-04-27 | -1.14 |
| 2026-05-19 | -1.03 |
| 2026-06-11 | -2.70 |
| 2026-07-07 | -2.18 |
| 2026-07-29 | -5.80 |
| 2026-08-20 | -9.58 |
| 2026-09-14 | -10.68 |
The pacing call did not start this. The broader high-beta momentum screen closed Friday 17.7% below its high, and its two prior since-2020 extremes were set on September 4 and September 8 — today is the third blow inside two weeks, not the first. Profitability tells the same awkward story for anyone hiding in quality: more profitable names have underperformed for a quarter, z=-2.1 on the 63-day window, because the profitable names here are the semis. Stanley Druckenmiller told a Piper Sandler conference that no Fed cuts are needed and that he has cut AI exposure to 20% of peak levels FT. With the 10-year at 4.985%, up 1bp CNBC, and close to 90% priced for a 25bp hike after the 0.4% MoM August CPI bls.gov print FT, Wednesday's FOMC federalreserve.gov decision arrives with the high-beta end of the market already marked down.
Variance decomposition: live intraday — 20260914 session, bracketed against its trailing-year range. Factor returns are trailing through last close. Total cross-sectional dispersion: 44%ile of the past year.
Variance mix — % of total, today vs 1d ago vs 1-yr avg
market 57%ile style 100.0%ile thematic 62%ile idiosyncratic 0.4%ile
Variance explained — today vs. factor's trailing-year range
Marker = the factor's share of today's total variance, placed in its own trailing-year range (box 25–75%ile, ticks 90%ile and max). Amber marker = unusually load-bearing today (≥90%ile of its own year). Factor name green = up today / red = down.
Correlation & dispersion — realized vs implied
Pairwise realized correlation (20d): 9.25% 6.5%ile since 2020 · 75%ile 3m
Top-500 pairwise: 8.21% 4.7%ile since 2020 · 35%ile 3m · implied (Cboe COR1M): 11.18 5.5%ile of its own history (gap -3.0pp)
Realized 20d vol (ann. pts): all stocks 39 vs VIXEQ 34 · index 11 vs VIX 18 · style factors 20 71%ile
20-day window (19 completed days + today); percentiles vs model history since 2020; '3m' tokens rank vs the trailing 63 trading days; definitions in Terms below. Implied prints (Cboe) are delayed ~15 min. as of 08:41 ET
Top 50 high-beta momentum names (eq-wt, since-2020 rank): -6.0% 2.7%ile worst since 2026-08-18 · rest of market +0.3%
| Factor | Today | 1d | 5d | 20d | 60d |
|---|---|---|---|---|---|
| Style-Risk | |||||
| Beta | -2.31% z-2.4 | +0.64% | -1.50% | -3.92% | -10.01% |
| Residual Volatility | +0.39% z+0.8 | -0.03% | -0.29% | +0.49% | +2.18% |
| International | +0.00% z+0.0 | +0.03% | +0.09% | +1.80% | +0.67% |
| Style | |||||
| Profitability | -0.26% z-1.4 | +0.02% | -0.48% | -0.89% | -2.75% |
| Leverage | -0.17% z-1.0 | -0.07% | -0.27% | -0.89% | -3.59% |
| Liquidity | -0.11% z-0.4 | -0.19% | +0.06% | +1.22% | +0.97% |
| Dividend Yield | -0.05% z-0.3 | -0.09% | +0.08% | +0.26% | -0.71% |
| Size | -0.05% z-0.1 | +0.12% | +0.87% | +1.72% | +0.03% |
| Value | -0.02% z-0.1 | +0.21% | +0.00% | +0.19% | -0.17% |
| Growth | -0.02% z-0.1 | -0.00% | -0.38% | -0.62% | +2.16% |
| Style-Momentum | |||||
| Short-Term Momentum | -0.37% z-1.2 | +0.08% | -0.56% | -1.89% | -8.03% |
| One-Day Momentum | -0.26% z-0.9 | +0.23% | -0.07% | -0.98% | -1.23% |
| Long-Term Momentum | -0.58% z-0.9 | -0.11% | +0.89% | -0.08% | -4.93% |
| Medium-Term Momentum | +0.21% z+0.7 | -0.26% | -0.36% | +0.72% | +0.65% |
| Style-Positioning | |||||
| Short Interest | +0.09% z+0.5 | -0.17% | -0.47% | -0.19% | +0.21% |
| Hedge-Fund Ownership | +0.01% z+0.1 | -0.01% | -0.08% | +0.22% | +0.97% |
| Style-Flow | |||||
| Short-Sale Activity | +0.10% z+0.9 | +0.18% | +0.29% | +0.78% | +1.17% |
| Morning Activity | +0.02% z+0.2 | -0.14% | -0.14% | +1.19% | +2.08% |
| Thematic | |||||
| Semiconductors | -0.98% z-1.6 | +0.05% | +0.44% | -1.27% | -6.20% |
| Bitcoin / Crypto | +0.34% z+1.1 | -0.08% | +0.37% | +2.51% | +1.78% |
| Oil | +0.09% z+0.2 | -0.26% | +1.30% | +3.68% | +4.27% |
| Gold | -0.06% z-0.2 | -0.35% | -0.71% | +2.37% | +2.57% |
| China | +0.04% z+0.1 | +0.21% | -0.02% | +0.37% | +0.31% |
| Treasury (Duration) | +0.03% z+0.1 | -0.21% | -0.87% | -1.37% | -0.82% |
5/20/60d windows include today's session; 1d is the previous session.
Market variance share. The fraction of cross-sectional variance explained by the market factor — the attribution companion to pairwise correlation, not a substitute for it.
Factor z-score. Today's factor return divided by its daily-return standard deviation over ~1,600 trading days.
High-beta momentum cohort. US names above $2B market cap in the top quintile of both raw beta and 12-month momentum; membership frozen at each month's first business day. “Top 50” = the 50 strongest by combined rank.
Stock-specific (idiosyncratic) return. The part of a stock's move not explained by market, style, or thematic factors in our decomposition.
Data compiled by FactorPulse AI; edited and verified by Jeff Klein. For informational purposes only. Does not constitute financial advice, an investment recommendation, or an offer to buy or sell any securities. Always consult a qualified financial professional before making investment decisions.
For more on factor construction methodology, see www.factorpulse.com/glossary.