Oracle told investors it plans to spend more than $90 billion next year building out computing capacity, and Wall Street rewarded the companies that will sell it the hardware rather than Oracle itself. Server makers Dell and Hewlett Packard Enterprise each jumped about 12% to record highs, adding roughly $45 billion in combined market value in a single session. Oracle, which grew revenue 30% last quarter but is carrying $125 billion of debt against its order book, slipped about 2%, giving back the 7% pop it had enjoyed in the first reaction to its results. The hardware frenzy came in the same week OpenAI's Sam Altman said his company was open to slowing the pace of frontier AI development.
The buying came despite an inflation report that should have rattled people. August consumer prices rose 3.4% from a year earlier, more than expected, with gasoline a big contributor, and traders now put roughly 90% odds on a Federal Reserve rate hike at next Wednesday's meeting. The two-year Treasury yield climbed to about 4.6%, yet stocks rose nearly 1% and Wall Street's fear gauge fell. The mood on Main Street was grimmer: the University of Michigan's consumer sentiment survey dropped to its second-lowest reading in 74 years, with households now expecting 4.6% inflation over the next 12 months. Oil eased 2% to about $100 a barrel after a sharp run-up this week, gold rose to roughly $4,350 an ounce, and department-store chain Macy's gained 7.5% after raising its full-year outlook.
The day's clear losers were nuclear startups that still need cash to reach their first dollar of revenue. Reactor developer NuScale plunged 16% after UBS downgraded the stock to Sell, warning that construction won't begin until 2028, that it has no firm customer orders, and that it will burn roughly $700 million getting there. Rival Oklo fell 9% after launching a new $1 billion stock-sale program to replace one it had already used up. Investors weren't turning on electricity as a theme—funds tracking power grids for AI data centers gained about 2%—and both major nuclear funds remain up over the past three months. One caution for the new leaders: over that same quarter, the stocks that led one week have tended to hand it back the next, a pattern Dell and HPE now walk into.
Oracle's guidance came with more than $100 billion of combined backlog and commitments Bloomberg, and the server builders took the money. Dell closed +11.91% and HPE +12.27%, both at all-time highs. Neither move was factor-carried: the style complex contributed about a point to each, and the remainder was the stock's own, with HPE's stock-specific gain the largest in its trailing year.
Oracle itself gave the print back. Its quarter set a $664 billion backlog against $125 billion of debt Bloomberg, and the WSJ reported the shares had risen about 7% in the first reaction to the results WSJ before Friday's session took it off. That discrimination shows up in the variance split: idiosyncratic risk was 74.6% of the cross-section today against a 66.1% one-year average, with the style block at 9.8% against 21.9%. Macy's closed +7.52% after raising its full-year outlook WSJ, and HDFC Bank's ADR closed +6.67% on its own story. And the week's AI safety news ran directly against the hardware bid — Sam Altman said OpenAI is open to slowing frontier development Bloomberg, while SMH closed +1.34%.
| Factor | Return | Z-Score | 5d Z | 20d Z | 63d Z | Category | Direction |
|---|---|---|---|---|---|---|---|
| Short-Sale Activity | +0.18% | z=+1.6 | +0.5 | +1.5 | +0.9 | Style-Flow | yesterday's most short-sold names outperformed |
| Short Interest | -0.19% | z=-1.1 | -2.1 | -0.8 | +0.3 | Style-Positioning | most-shorted names lagged again |
| Beta | +0.64% | z=+0.7 | +1.1 | -0.3 | -0.6 | Style-Risk | high-beta names bid |
| Gold | -0.35% | z=-1.1 | -1.6 | +1.7 | +1.4 | Thematic | gold-levered equities lagged the metal |
| One-Day Momentum | +0.21% | z=+0.7 | -0.4 | -1.1 | -0.4 | Style-Momentum | yesterday's movers extended |
| Medium-Term Momentum | -0.26% | z=-0.9 | -2.1 | +0.2 | +0.0 | Style-Momentum | 20-day winners gave ground |
| Short-Term Momentum | +0.05% | z=+0.2 | -0.2 | -1.3 | -3.2 | Style-Momentum | flat after a quarter of reversion |
| Leverage | -0.04% | z=-0.2 | +0.5 | -1.0 | -2.6 | Style | balance-sheet-heavy names unmoved |
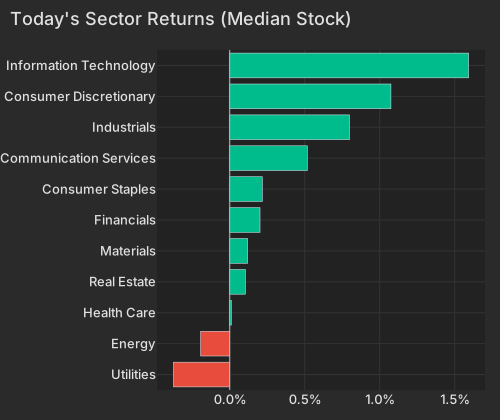
| Sector | Median Ret Pct |
|---|---|
| Utilities | -0.38 |
| Energy | -0.19 |
| Health Care | 0.01 |
| Real Estate | 0.10 |
| Materials | 0.12 |
| Financials | 0.20 |
| Consumer Staples | 0.22 |
| Communication Services | 0.52 |
| Industrials | 0.80 |
| Consumer Discretionary | 1.07 |
| Information Technology | 1.59 |
August CPI printed 3.4% year over year, above forecasts, and market-implied odds of a hike at the September 16 FOMC federalreserve.gov firmed to roughly 90% Bloomberg. The front end absorbed all of it: the 2-year yield rose 8 bps to 4.63% while the 30-year slipped half a basis point to 5.36% CNBC, flattening the curve WSJ. Equities went the other way, SPY +0.85% with VXX -4.21%, and Beta at +0.64% was the largest style move of the session. The high-beta momentum cohort rose +1.69% against +0.48% for everything else, the buying spread across the group in its usual proportion.
The flow internals ran against the model's most reliable effect. Short-Sale Activity paid +0.18% at z=+1.6, a return in the 96th percentile since 2020, meaning yesterday's most heavily short-sold names beat the barely-shorted ones a day later. Short Interest went the conventional way at -0.19%, z=-1.1, with a five-day z of -2.1 — the most-shorted names have been lagging all week.
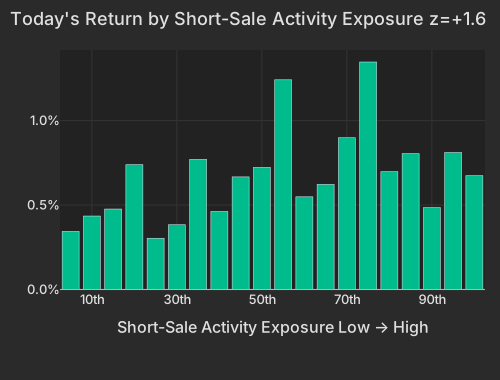
| Bucket | Avg Ret Pct |
|---|---|
| 1 | 0.34 |
| 2 | 0.43 |
| 3 | 0.48 |
| 4 | 0.74 |
| 5 | 0.30 |
| 6 | 0.38 |
| 7 | 0.77 |
| 8 | 0.46 |
| 9 | 0.67 |
| 10 | 0.72 |
| 11 | 1.24 |
| 12 | 0.55 |
| 13 | 0.62 |
| 14 | 0.90 |
| 15 | 1.35 |
| 16 | 0.70 |
| 17 | 0.80 |
| 18 | 0.48 |
| 19 | 0.81 |
| 20 | 0.67 |
Commodities cooled without denting the equity bid. WTI was $100.45 at 4:02 PM ET, -1.98% on the day CNBC, profit-taking after this week's surge WSJ. The Gold factor fell -0.35% at z=-1.1 while spot gold rose +0.76% to $4,348 CNBC: the gold-levered equities lagged the metal itself.
NuScale closed -15.82% after UBS cut the stock to Sell on Friday, citing a build timeline that pushes first construction to 2028, no firm customer orders, and cumulative cash burn of roughly $700 million to get there. The stock's own move was -17.03%, the largest in the universe today, with the day's factor bid working against it. Oklo closed -8.89% after launching a new $1 billion at-the-market share program to replace one it had already exhausted. What got sold was developers who still need capital to reach revenue, not electricity as a theme: GRID rose +2.01% and AIPO +1.97% on the same session that took URA -3.20%.
| ETF | Theme | Today | 1d Ago | 5d Ago | 20d Ago | 63d Ago |
|---|---|---|---|---|---|---|
| GRID | AI power infrastructure | +2.01% | -1.60% | +0.97% | -6.17% | -2.34% |
| AIPO | AI power infrastructure | +1.97% | -2.64% | +1.97% | -7.63% | -3.40% |
| SMH | semiconductors | +1.34% | -2.44% | +1.78% | -4.20% | -1.86% |
| MTUM | momentum | +1.27% | -1.99% | +2.06% | -3.68% | -0.58% |
| SPY | large cap | +0.85% | -0.60% | -0.96% | -1.90% | +4.47% |
| XLU | utilities | -0.28% | -0.98% | -0.35% | -3.01% | -3.36% |
| USO | oil | -2.45% | +5.61% | +12.21% | +24.41% | +17.93% |
| URA | uranium | -3.20% | -3.97% | +1.53% | -0.44% | +6.26% |
| NLR | nuclear power | -4.10% | -4.16% | +0.68% | -0.58% | +2.00% |
| VXX | volatility | -4.21% | +3.17% | +4.77% | -2.93% | -29.02% |
Both nuclear funds are still up over the trailing quarter, URA +6.26% and NLR +2.00% on the 63-day column. One session of funding-risk selling is not a quarter's verdict on the theme.
Short-Term Momentum, the 5-day trend factor, has returned -7.29% over the trailing 60 sessions and sits at z=-3.2 on the 63-day window — the single strongest structural signal in the factor set today, even though the factor itself printed +0.05% in the session. Leverage is the other quarter-long bleed, -3.47% over 60 sessions at z=-2.6. Through the quarter, the names that led one week handed it back the next, which is the pattern Dell and HPE now walk into as the week's new leaders.
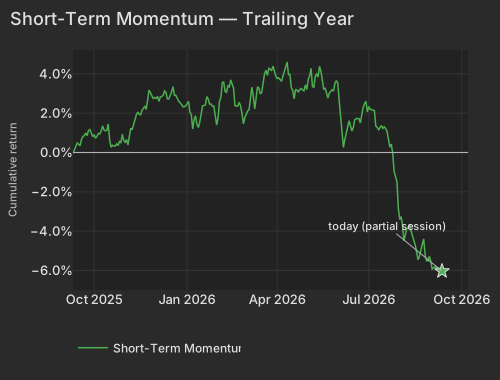
| Date | Cumret Pct |
|---|---|
| 2025-09-10 | -0.04 |
| 2025-09-12 | 0.31 |
| 2025-09-17 | 0.35 |
| 2025-09-19 | 0.81 |
| 2025-09-24 | 0.86 |
| 2025-09-26 | 1.17 |
| 2025-10-01 | 0.91 |
| 2025-10-03 | 0.83 |
| 2025-10-08 | 1.10 |
| 2025-10-10 | 1.14 |
| 2025-10-15 | 1.45 |
| 2025-10-17 | 0.27 |
| 2025-10-22 | 0.33 |
| 2025-10-24 | 0.35 |
| 2025-10-29 | 0.93 |
| 2025-10-31 | 0.52 |
| 2025-11-05 | 0.93 |
| 2025-11-10 | 1.43 |
| 2025-11-12 | 1.92 |
| 2025-11-17 | 1.92 |
| 2025-11-19 | 2.24 |
| 2025-11-24 | 2.59 |
| 2025-11-26 | 3.03 |
| 2025-12-02 | 2.75 |
| 2025-12-04 | 2.59 |
| 2025-12-09 | 2.91 |
| 2025-12-11 | 3.06 |
| 2025-12-16 | 2.88 |
| 2025-12-18 | 3.35 |
| 2025-12-23 | 2.71 |
| 2025-12-26 | 2.45 |
| 2025-12-31 | 2.36 |
| 2026-01-05 | 2.06 |
| 2026-01-08 | 1.67 |
| 2026-01-13 | 1.27 |
| 2026-01-15 | 1.96 |
| 2026-01-21 | 2.84 |
| 2026-01-23 | 2.46 |
| 2026-01-28 | 2.36 |
| 2026-01-30 | 1.40 |
| 2026-02-04 | 2.80 |
| 2026-02-06 | 3.58 |
| 2026-02-11 | 3.39 |
| 2026-02-13 | 3.69 |
| 2026-02-19 | 2.36 |
| 2026-02-23 | 2.56 |
| 2026-02-26 | 1.46 |
| 2026-03-02 | 1.95 |
| 2026-03-05 | 2.77 |
| 2026-03-09 | 2.86 |
| 2026-03-12 | 3.34 |
| 2026-03-17 | 3.06 |
| 2026-03-19 | 4.01 |
| 2026-03-24 | 4.28 |
| 2026-03-26 | 4.17 |
| 2026-03-31 | 3.88 |
| 2026-04-02 | 3.80 |
| 2026-04-08 | 4.09 |
| 2026-04-10 | 4.60 |
| 2026-04-15 | 3.30 |
| 2026-04-17 | 2.73 |
| 2026-04-22 | 3.06 |
| 2026-04-24 | 3.26 |
| 2026-04-29 | 3.44 |
| 2026-05-01 | 3.72 |
| 2026-05-06 | 3.35 |
| 2026-05-08 | 3.89 |
| 2026-05-13 | 4.38 |
| 2026-05-18 | 3.20 |
| 2026-05-20 | 3.07 |
| 2026-05-26 | 3.19 |
| 2026-05-28 | 3.53 |
| 2026-06-02 | 2.62 |
| 2026-06-04 | 1.20 |
| 2026-06-09 | 1.09 |
| 2026-06-11 | 1.61 |
| 2026-06-16 | 1.26 |
| 2026-06-18 | 1.72 |
| 2026-06-24 | 2.01 |
| 2026-06-26 | 2.48 |
| 2026-07-01 | 2.34 |
| 2026-07-06 | 2.15 |
| 2026-07-09 | 1.28 |
| 2026-07-13 | 1.30 |
| 2026-07-16 | 1.31 |
| 2026-07-21 | 0.66 |
| 2026-07-23 | 0.43 |
| 2026-07-28 | -1.31 |
| 2026-07-30 | -2.86 |
| 2026-08-04 | -3.72 |
| 2026-08-06 | -4.21 |
| 2026-08-11 | -3.65 |
| 2026-08-13 | -4.29 |
| 2026-08-18 | -5.13 |
| 2026-08-20 | -5.27 |
| 2026-08-25 | -4.40 |
| 2026-08-27 | -5.50 |
| 2026-09-01 | -5.53 |
| 2026-09-03 | -5.88 |
| 2026-09-09 | -5.88 |
| 2026-09-11 | -6.03 |
The Consumer Price Index bls.gov, released at 8:30 AM ET, showed August headline inflation at a 3.4% annual rate, above expectations, with gasoline a significant contributor; Treasury yields climbed immediately and hike expectations for next week's FOMC firmed Bloomberg.
The Michigan Consumer Survey (Preliminary), released at 10:00 AM ET, fell 7.5% to 47.8 against a 51.4 forecast — the University of Michigan data.sca.isr.umich.edu's second-lowest reading in 74 years — with one-year inflation expectations jumping to 4.6% from 4.0%. The New York Fed Staff Nowcast, released at 12:45 PM ET, held its Q3 GDP bea.gov tracking estimate at 2.3%, unrevised on the week and well below the Atlanta Fed's 4.4% GDPNow estimate as of September 10.
Variance decomposition: live intraday — 20260911 session, bracketed against its trailing-year range. Factor returns are trailing through last close. Total cross-sectional dispersion: 11%ile of the past year.
Variance mix — % of total, today vs 1d ago vs 1-yr avg
market 81%ile style 21%ile thematic 27%ile idiosyncratic 55%ile
Variance explained — today vs. factor's trailing-year range
Marker = the factor's share of today's total variance, placed in its own trailing-year range (box 25–75%ile, ticks 90%ile and max). Amber marker = unusually load-bearing today (≥90%ile of its own year). Factor name green = up today / red = down.
Correlation & dispersion — realized vs implied
Pairwise realized correlation (20d): 9.01% 6.1%ile since 2020 · 73%ile 3m
Top-500 pairwise: 7.77% 4.0%ile since 2020 · 32%ile 3m · implied (Cboe COR1M): 11.02 5.3%ile of its own history (gap -3.2pp)
Realized 20d vol (ann. pts): all stocks 39 vs VIXEQ 35 · index 10 vs VIX 16 · style factors 19 66%ile
20-day window (19 completed days + today); percentiles vs model history since 2020; '3m' tokens rank vs the trailing 63 trading days; definitions in Terms below. Implied prints (Cboe) are delayed ~15 min. as of 15:58 ET
High-beta momentum cohort (eq-wt, since-2020 rank): +1.7% 76%ile · rest of market +0.5%
| Factor | Today | 1d | 5d | 20d | 60d |
|---|---|---|---|---|---|
| Style-Risk | |||||
| Beta | +0.64% z+0.7 | -1.17% | +2.28% | -1.30% | -6.91% |
| International | +0.04% z+0.1 | +0.05% | +0.07% | +1.76% | +0.83% |
| Residual Volatility | -0.04% z-0.1 | -0.20% | -1.07% | -0.05% | +1.79% |
| Style | |||||
| Value | +0.23% z+1.0 | -0.14% | +0.26% | +0.39% | -0.65% |
| Liquidity | -0.16% z-0.6 | +0.08% | +0.61% | +1.91% | +0.68% |
| Dividend Yield | -0.08% z-0.5 | -0.12% | +0.20% | +0.40% | -0.58% |
| Size | +0.14% z+0.4 | +0.27% | +0.72% | +1.46% | +0.22% |
| Leverage | -0.03% z-0.2 | -0.24% | +0.19% | -0.73% | -3.47% |
| Growth | -0.01% z-0.1 | -0.01% | -0.39% | -0.64% | +2.12% |
| Profitability | -0.00% z-0.0 | +0.01% | +0.02% | -0.75% | -2.77% |
| Style-Momentum | |||||
| Medium-Term Momentum | -0.26% z-0.9 | -0.10% | -1.35% | +0.25% | +0.64% |
| One-Day Momentum | +0.21% z+0.7 | -0.18% | -0.24% | -1.41% | -1.00% |
| Long-Term Momentum | -0.13% z-0.2 | -0.28% | +2.08% | +1.04% | -3.45% |
| Short-Term Momentum | +0.05% z+0.2 | -0.20% | -0.15% | -1.74% | -7.29% |
| Style-Positioning | |||||
| Short Interest | -0.19% z-1.1 | +0.04% | -0.81% | -0.61% | +0.22% |
| Hedge-Fund Ownership | -0.03% z-0.3 | -0.09% | -0.04% | +0.31% | +0.89% |
| Style-Flow | |||||
| Short-Sale Activity | +0.18% z+1.6 | +0.14% | +0.11% | +0.71% | +1.05% |
| Morning Activity | -0.12% z-0.9 | -0.12% | -0.27% | +1.15% | +1.92% |
| Thematic | |||||
| Gold | -0.35% z-1.1 | -0.38% | -1.17% | +2.46% | +2.60% |
| Treasury (Duration) | -0.21% z-0.7 | -0.28% | -0.82% | -1.36% | -0.80% |
| Oil | -0.25% z-0.5 | +0.06% | +1.15% | +3.88% | +4.34% |
| China | +0.20% z+0.5 | +0.19% | -0.00% | -0.15% | +0.15% |
| Bitcoin / Crypto | -0.10% z-0.3 | +0.08% | -0.37% | +2.09% | +1.62% |
| Semiconductors | +0.04% z+0.1 | -0.29% | +2.68% | +0.29% | -4.57% |
5/20/60d windows include today's session; 1d is the previous session.
Factor z-score. Today's factor return divided by its daily-return standard deviation over ~1,600 trading days.
High-beta momentum cohort. US names above $2B market cap in the top quintile of both raw beta and 12-month momentum; membership frozen at each month's first business day. “Top 50” = the 50 strongest by combined rank.
Stock-specific (idiosyncratic) return. The part of a stock's move not explained by market, style, or thematic factors in our decomposition.
Data compiled by FactorPulse AI; edited and verified by Jeff Klein. For informational purposes only. Does not constitute financial advice, an investment recommendation, or an offer to buy or sell any securities. Always consult a qualified financial professional before making investment decisions.
For more on factor construction methodology, see www.factorpulse.com/glossary.