A hot inflation report set the tone. Wholesale prices rose 5.4% from a year earlier in August, with diesel up 24%, and traders responded by pricing in roughly 70% odds that the Federal Reserve raises rates at next week's meeting. The two-year Treasury yield jumped to about 4.57%, its sharpest move in the curve, while the ten-year cleared 4.9%. Oil did much of the damage: crude climbed 7% to nearly $103 a barrel as markets braced for a drawn-out Iran conflict and the risk of disruption at the Strait of Hormuz. Municipal bond yields hit their highest since 2011, and bond investors also weighed President Trump's proposed $5,000 payment to adult citizens, a plan priced at up to $1.35 trillion. A steady jobless claims report at 206,000 gave the Fed no reason to hold back. The S&P 500 slipped only about half a percent, and the dollar had its best day in two weeks.
Beneath the calm index, the riskiest corners of the market were sold hard, and it was last week's comeback trades that took the hit: memory chips, South Korea, uranium and gold miners all gave back a week of gains. Chipmaker Micron fell 5%, wiping out roughly $59 billion in market value, and Intel dropped nearly 6%, not because of any chip-specific news but because they are the kind of high-octane stocks investors dump when rates look set to rise. The timing stung. Goldman Sachs prime brokerage data showed hedge funds had just done their biggest week of net buying of U.S. stocks since November 2020, piling into technology at the fastest clip since late 2022. Nomura strategist Charlie McElligott had warned that September seasonality, heavy Treasury issuance and a hawkish Fed could combine badly, and the VIX pushed to the top of its recent range.
Materials were the worst sector, down about 2.5%, on politics rather than rates: a report that the White House is hesitant to go ahead with tariffs on refined copper sent the metal down 3% just days after it hit a record. Copper miners Southern Copper and Freeport-McMoRan each fell around 7%, and BHP lost nearly 5%. Gold slid almost 2% and silver about 5% as the inflation data pointed to tighter policy rather than easier. A few names bucked the tide. Chipmakers Skyworks and Qorvo rose 10% and 7% after management said China's antitrust review of their $22 billion merger is in its final phase. Retailer American Eagle sank 14% after warning of flat margins and slowing growth at its Aerie brand. Oracle fell 5% ahead of its earnings report and was little changed after the bell, while Adobe slipped further in late trading.
Headline producer prices rose 0.4% in August, matching consensus, but the core measure at 0.3% on the month and 4.7% annually ran slightly above forecast. Energy carried the goods advance — final-demand energy up 4.2%, diesel up 24.1%. That was enough to swing next week's meeting: fed funds futures moved to about 70% odds of a 25 bp hike at the September 15–16 FOMC, per the CME FedWatch tool, and the dollar posted its best session in two weeks at 99.084, +0.27%BloombergCNBC.
The front end led the move: the 2-year at 4.571% (+14.4 bps) and the 3-year at 4.670% (+14.9 bps) rose more than the 10-year at 4.954% (+11.4 bps), with the 30-year up 7.8 bps to 5.364% — a bear flattener, not a term-premium eventCNBC. WTI at $102.80 as of 4:01 PM ET, +7.03%, is the inflation input doing the damage, with the market bracing for a prolonged Iran conflict and disruption risk at the Strait of HormuzCNBCNYT. Tax-exempt debt took it worst of all: MUB fell -0.73% at 3.4× its typical session pace, with municipal yields at their highest since 2011Bloomberg. Sitting behind the long end is Trump's proposed $5,000 payment to adult citizens, priced at $1.2–1.35 trillion, which bond investors weighed alongside $100 crude as the 10-year cleared 4.90%NYT.
| Factor | Return | Z-Score | 5d Z | 20d Z | 63d Z | Category | Direction |
|---|---|---|---|---|---|---|---|
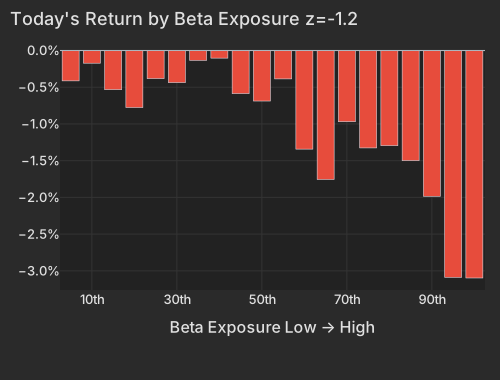
| Beta | -1.16% | -1.2 | +1.0 | -0.5 | -0.3 | Style-Risk | Market-sensitive names lagged |
| Leverage | -0.22% | -1.3 | +0.5 | -0.9 | -2.6 | Style | Levered balance sheets lagged |
| Short-Term Momentum | -0.19% | -0.6 | -0.2 | -1.5 | -3.0 | Style-Momentum | Last week's movers faded |
| Short-Sale Activity | +0.14% | +1.3 | +0.7 | +1.1 | +0.5 | Style-Flow | Yesterday's most short-sold outperformed |
| Gold | -0.38% | -1.2 | -0.3 | +1.8 | +1.5 | Thematic | Gold-exposed names lagged |
| Treasury (Duration) | -0.28% | -0.9 | -1.6 | -1.0 | -0.3 | Thematic | Duration-sensitive names lagged |
| Hedge-Fund Ownership | -0.10% | -0.9 | -0.5 | +0.5 | +1.0 | Style-Positioning | HF-owned names lagged |
The chip complex fell as a high-beta bundle, not as a chip story. SMH dropped -2.31% while the Semiconductors thematic factor was only -0.30% at z=-0.5 — once beta is taken out, semiconductors were an ordinary day. Micron's -4.96%, which erased $59.1 billion of market value, splits into -2.92% of style with beta the largest single contributor and just -0.86% of its own; Intel's -5.73% is two-thirds the same. Realized correlation ran at 16.8% today against 6.6% across the trailing 20 sessions — the index mattered more today than it has in weeks.
| Bucket | Avg Ret Pct |
|---|---|
| 1 | -0.41 |
| 2 | -0.17 |
| 3 | -0.53 |
| 4 | -0.78 |
| 5 | -0.38 |
| 6 | -0.44 |
| 7 | -0.13 |
| 8 | -0.10 |
| 9 | -0.59 |
| 10 | -0.69 |
| 11 | -0.39 |
| 12 | -1.34 |
| 13 | -1.76 |
| 14 | -0.97 |
| 15 | -1.33 |
| 16 | -1.30 |
| 17 | -1.50 |
| 18 | -1.98 |
| 19 | -3.09 |
| 20 | -3.10 |
One counter-signal worth flagging: Short-Sale Activity paid +0.14% at z=+1.3, meaning yesterday's most heavily short-sold names outperformed the barely-shorted ones, with the loss concentrated in the bottom decile at -1.6%. That runs against the model's most statistically reliable effect, and it is the one piece of today's cross-section that does not look like plain risk reduction.
| ETF | Theme | Today | 1d Ago | 5d Ago | 20d Ago | 63d Ago |
|---|---|---|---|---|---|---|
| USO | oil | +5.73% | +2.70% | +6.36% | +17.52% | +14.22% |
| DRAM | memory chips | -5.03% | +0.79% | +11.84% | +21.01% | +2.87% |
| SLV | silver | -5.36% | +2.27% | +4.83% | +3.71% | +2.90% |
| EWY | south korea | -4.15% | +0.46% | +8.52% | +14.08% | +3.66% |
| GDX | gold miners | -3.35% | +1.08% | +5.07% | +10.38% | +28.20% |
| SMH | semiconductors | -2.31% | +0.10% | +5.33% | +0.24% | -2.83% |
| MTUM | momentum | -1.96% | +0.19% | +4.31% | +0.31% | -0.75% |
| TLT | long-term bonds | -1.23% | -0.57% | -0.17% | -0.56% | -3.98% |
| IGV | software | -0.14% | -0.81% | -4.10% | -2.01% | +9.55% |
| SPY | large cap | -0.52% | -0.46% | +0.08% | -1.06% | +3.44% |
The ranking in that table is almost exactly the ranking of the prior week's winners. Beta's own five-session return was +2.25% going into today, and software — which had lagged, IGV -4.10% over five sessions — finished flat at -0.14%. The top 50 high-beta momentum names fell -3.5% against -0.64% for the rest of the universe, a day in the 9.6th percentile since 2020, and the selling spread across the group in its usual proportion rather than concentrating in the most extreme names.
Positioning had moved the other way into it. Goldman Sachs Prime Brokerage data, covering the session ending September 9, showed the largest weekly net buying of U.S. equities since November 2020, roughly 2.1 parts short covering to one part long buying. The same data has U.S. Information Technology bought for a second straight week at the fastest pace since December 2022, with fundamental long/short net leverage still at 49.8%, the 6th percentile. Our direct lens is consistent but mild: Hedge-Fund Ownership was -0.10% at z=-0.9, and -0.08% before residualizing, so the hedge-fund-owned names were hit rather than spared. The high-beta momentum names themselves are not a hedge-fund-owned group — their ownership tilt against the universe is flat, and they skew retail-heavy — so the trade under pressure and the book under pressure are not the same object. Nomura's Charlie McElligott flagged September seasonality, Treasury supply and hawkish policy as a combined risk, with three-month VIX call skew at the 91st percentile; VIX at 17.85 is at the top of its 20-session range of 14.25–16.46.
Underneath the day, the rate-sensitivity axis has been paying for a quarter. Leverage has returned -3.42% over the completed 63-day window, the 0.8th percentile of all overlapping 63-day windows since 2020, at z=-2.6 on that horizon — and it extended today at -0.22%, z=-1.3. Balance-sheet-heavy names have been marked down continuously through a period in which the two-year yield has been climbing, and next Wednesday decides whether that continues.
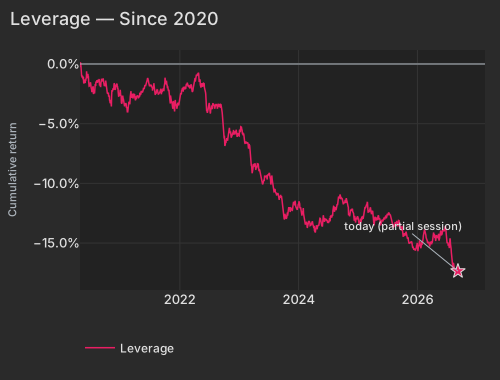
| Date | Cumret Pct |
|---|---|
| 2020-04-28 | 0.17 |
| 2020-05-20 | -1.54 |
| 2020-06-12 | -0.94 |
| 2020-07-07 | -2.04 |
| 2020-07-29 | -1.71 |
| 2020-08-20 | -1.46 |
| 2020-09-14 | -1.38 |
| 2020-10-06 | -1.60 |
| 2020-10-28 | -3.07 |
| 2020-11-19 | -2.11 |
| 2020-12-14 | -1.94 |
| 2021-01-07 | -3.26 |
| 2021-02-01 | -3.39 |
| 2021-02-24 | -3.24 |
| 2021-03-18 | -2.70 |
| 2021-04-12 | -2.79 |
| 2021-05-04 | -2.60 |
| 2021-05-26 | -2.06 |
| 2021-06-18 | -1.22 |
| 2021-07-13 | -1.96 |
| 2021-08-04 | -2.59 |
| 2021-08-26 | -2.45 |
| 2021-09-20 | -2.14 |
| 2021-10-12 | -1.40 |
| 2021-11-03 | -2.96 |
| 2021-11-26 | -3.52 |
| 2021-12-20 | -3.49 |
| 2022-01-12 | -2.47 |
| 2022-02-04 | -2.07 |
| 2022-03-01 | -1.88 |
| 2022-03-23 | -2.15 |
| 2022-04-14 | -0.89 |
| 2022-05-09 | -1.75 |
| 2022-06-01 | -1.65 |
| 2022-06-24 | -3.83 |
| 2022-07-19 | -3.52 |
| 2022-08-10 | -3.40 |
| 2022-09-01 | -3.53 |
| 2022-09-26 | -5.23 |
| 2022-10-18 | -6.21 |
| 2022-11-09 | -5.77 |
| 2022-12-02 | -5.91 |
| 2022-12-27 | -5.79 |
| 2023-01-20 | -5.57 |
| 2023-02-13 | -6.46 |
| 2023-03-08 | -6.80 |
| 2023-03-30 | -8.47 |
| 2023-04-24 | -8.60 |
| 2023-05-16 | -9.56 |
| 2023-06-08 | -9.35 |
| 2023-07-03 | -9.23 |
| 2023-07-26 | -9.75 |
| 2023-08-17 | -10.83 |
| 2023-09-11 | -11.18 |
| 2023-10-03 | -12.79 |
| 2023-10-25 | -12.67 |
| 2023-11-16 | -12.06 |
| 2023-12-11 | -11.74 |
| 2024-01-04 | -11.69 |
| 2024-01-29 | -12.53 |
| 2024-02-21 | -13.31 |
| 2024-03-14 | -13.54 |
| 2024-04-08 | -13.60 |
| 2024-04-30 | -13.58 |
| 2024-05-22 | -13.37 |
| 2024-06-14 | -12.98 |
| 2024-07-10 | -13.21 |
| 2024-08-01 | -12.31 |
| 2024-08-23 | -11.88 |
| 2024-09-17 | -11.06 |
| 2024-10-09 | -11.56 |
| 2024-10-31 | -11.71 |
| 2024-11-22 | -12.26 |
| 2024-12-17 | -13.09 |
| 2025-01-13 | -13.28 |
| 2025-02-05 | -12.81 |
| 2025-02-28 | -11.59 |
| 2025-03-24 | -12.34 |
| 2025-04-15 | -13.26 |
| 2025-05-08 | -12.77 |
| 2025-06-02 | -13.18 |
| 2025-06-25 | -12.89 |
| 2025-07-18 | -12.61 |
| 2025-08-11 | -13.54 |
| 2025-09-03 | -13.50 |
| 2025-09-25 | -13.74 |
| 2025-10-17 | -14.21 |
| 2025-11-10 | -14.76 |
| 2025-12-03 | -15.16 |
| 2025-12-26 | -15.49 |
| 2026-01-21 | -15.23 |
| 2026-02-12 | -13.98 |
| 2026-03-09 | -14.97 |
| 2026-03-31 | -15.05 |
| 2026-04-23 | -14.38 |
| 2026-05-15 | -14.67 |
| 2026-06-09 | -13.89 |
| 2026-07-02 | -14.78 |
| 2026-07-27 | -15.05 |
| 2026-08-18 | -17.09 |
| 2026-09-10 | -17.35 |
Duration inside the equity market tells the same story with a different sort. The Treasury (Duration) factor was -0.28% at z=-0.9 today and -1.12% over five sessions, and the highest-duration bucket fell -1.8%, with biotech names such as ABCL and OMER at the extreme.
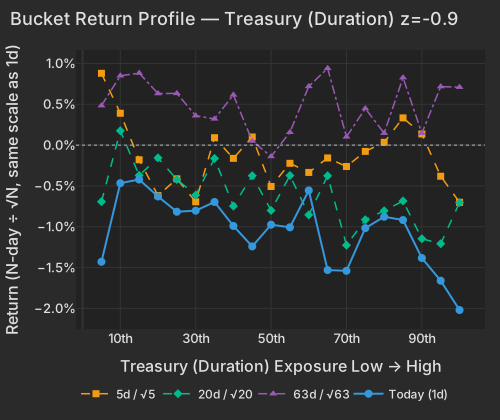
| Bucket | Ret 1D Pct | Ret 5D Norm Pct | Ret 20D Norm Pct | Ret 63D Norm Pct |
|---|---|---|---|---|
| 1 | -1.43 | 0.88 | -0.69 | 0.48 |
| 2 | -0.47 | 0.39 | 0.18 | 0.85 |
| 3 | -0.42 | -0.18 | -0.37 | 0.88 |
| 4 | -0.63 | -0.62 | -0.16 | 0.63 |
| 5 | -0.82 | -0.41 | -0.42 | 0.63 |
| 6 | -0.80 | -0.69 | -0.61 | 0.36 |
| 7 | -0.70 | 0.09 | -0.16 | 0.32 |
| 8 | -0.99 | -0.16 | -0.75 | 0.62 |
| 9 | -1.24 | 0.10 | -0.37 | 0.05 |
| 10 | -0.97 | -0.51 | -0.80 | -0.14 |
| 11 | -1.01 | -0.22 | -0.37 | 0.16 |
| 12 | -0.55 | -0.33 | -0.85 | 0.72 |
| 13 | -1.53 | -0.16 | -0.38 | 0.94 |
| 14 | -1.54 | -0.26 | -1.23 | 0.10 |
| 15 | -1.02 | -0.08 | -0.91 | 0.45 |
| 16 | -0.88 | 0.03 | -0.80 | 0.15 |
| 17 | -0.92 | 0.33 | -0.68 | 0.83 |
| 18 | -1.38 | 0.14 | -1.15 | 0.15 |
| 19 | -1.66 | -0.38 | -1.21 | 0.72 |
| 20 | -2.02 | -0.70 | -0.70 | 0.71 |
The 5-day reversion pattern — Short-Term Momentum in the table — is the other structural marker, at -7.35% over the completed 63-day window and z=-3.0 on that horizon, with today a mild continuation at -0.19%. Each week's movers have been faded in turn since the summer, which is why a one-week rebound in the highest-beta names was never worth much.
Materials was the worst sector at -2.43%, and the cause was policy, not rates. Three-month LME copper fell 3.1% to $14,312 a tonne after a report that the White House is hesitant to proceed with refined-copper tariffs, days after the metal set a record $14,737 on a mining-to-smelting bottleneck that has driven treatment charges to minus $1,300 a tonneEconomic TimesEconomic Times. Southern Copper's -7.21% was almost entirely its own move, -4.91% of it stock-specific; Freeport fell -6.79% and BHP -4.56%.
Precious metals fell for the opposite reason. Spot gold at $4,323.65 was -1.75% and silver's ETF SLV -5.36%, as producer-price momentum pointed toward tightening rather than easingCNBCBloomberg. The Gold factor at -0.38%, z=-1.2, cuts against a 20-day z of +1.8 — one bad session inside a strong month for miners, GDX still +28.20% over 63 days.
Two things sat outside the beta sort. Skyworks rose +9.88% in the session and Qorvo +7.23%, both overwhelmingly stock-specific, as management pointed at the final phase of China's antitrust review of their $22 billion merger in remarks at the Goldman Sachs Communacopia conferenceEconomic Times. Cooper Companies fell -13.98% in the session, the largest stock-specific move on the board by a distance, with no driver in today's coverage — the market marked it down on something we cannot yet source. American Eagle closed -13.77% after guiding to flat operating margins and slowing growth at Aerie, with management conceding "work to do" on the namesake brandThe Wall Street Journal. Oracle closed the regular session -5.27% into its results and is +0.79% in late trading; Adobe closed -2.43% and fell a further -1.42% after the bellBloomberg.
The Producer Price Index the BLS, released at 8:30 AM ET, showed headline wholesale prices up 0.4% on the month in line with the Dow Jones consensus, but core PPI at 0.3% monthly and 4.7% annually came in slightly above forecast, and Treasury yields climbed and crude cleared $100 in the hours afterBloomberg. Initial Claims the BLS, also released at 8:30 AM ET, fell 1,000 to 206,000 for the week ending September 5 against 205,000 expected, with continuing claims at 1.774 million versus a 1.780 million consensus — a labor market giving the Fed no reason to hold back.
Variance decomposition: live intraday — 20260910 session, bracketed against its trailing-year range. Factor returns are trailing through last close. Total cross-sectional dispersion: 18%ile of the past year.
Variance mix — % of total, today vs 1d ago vs 1-yr avg
market 84%ile style 68%ile thematic 32%ile idiosyncratic 24%ile
Variance explained — today vs. factor's trailing-year range
Marker = the factor's share of today's total variance, placed in its own trailing-year range (box 25–75%ile, ticks 90%ile and max). Amber marker = unusually load-bearing today (≥90%ile of its own year). Factor name green = up today / red = down.
Correlation & dispersion — realized vs implied
Pairwise realized correlation (20d): 8.53% 5.2%ile since 2020 · 65%ile 3m
Top-500 pairwise: 7.03% 2.9%ile since 2020 · 29%ile 3m · implied (Cboe COR1M): 14.46 11%ile of its own history (gap -7.4pp)
Realized 20d vol (ann. pts): all stocks 40 vs VIXEQ 36 · index 10 vs VIX 18 · style factors 19 66%ile
20-day window (19 completed days + today); percentiles vs model history since 2020; '3m' tokens rank vs the trailing 63 trading days; definitions in Terms below. Implied prints (Cboe) are delayed ~15 min. as of 15:58 ET
Top 50 high-beta momentum names (eq-wt, since-2020 rank): -3.5% 9.6%ile · rest of market -0.6%
| Factor | Today | 1d | 5d | 20d | 60d |
|---|---|---|---|---|---|
| Style-Risk | |||||
| Beta | -1.16% z-1.2 | -0.09% | +2.25% | -2.22% | -8.50% |
| Residual Volatility | -0.21% z-0.4 | -0.20% | -0.61% | +0.69% | +0.81% |
| International | +0.06% z+0.2 | +0.05% | +0.06% | +1.51% | +0.67% |
| Style | |||||
| Leverage | -0.22% z-1.3 | -0.10% | +0.18% | -0.69% | -3.38% |
| Size | +0.27% z+0.8 | +0.41% | +0.79% | +1.38% | +0.07% |
| Dividend Yield | -0.10% z-0.6 | +0.08% | +0.26% | +0.65% | -0.65% |
| Value | -0.08% z-0.3 | +0.15% | +0.00% | +0.29% | -0.60% |
| Liquidity | +0.07% z+0.3 | -0.06% | +0.60% | +2.51% | +0.50% |
| Growth | -0.01% z-0.1 | -0.04% | -0.36% | -0.42% | +2.27% |
| Profitability | +0.00% z+0.0 | -0.04% | -0.27% | -0.65% | -2.93% |
| Style-Momentum | |||||
| One-Day Momentum | -0.21% z-0.8 | +0.02% | -0.78% | -1.90% | -1.06% |
| Short-Term Momentum | -0.19% z-0.6 | -0.01% | -0.14% | -2.09% | -7.16% |
| Long-Term Momentum | -0.31% z-0.5 | +0.76% | +1.59% | +0.84% | -4.44% |
| Medium-Term Momentum | -0.10% z-0.4 | +0.26% | -0.78% | +0.33% | +0.79% |
| Style-Positioning | |||||
| Hedge-Fund Ownership | -0.10% z-0.9 | -0.00% | -0.12% | +0.24% | +1.01% |
| Short Interest | +0.01% z+0.1 | -0.22% | -0.85% | -0.39% | +0.29% |
| Style-Flow | |||||
| Short-Sale Activity | +0.14% z+1.3 | -0.05% | +0.17% | +0.55% | +0.83% |
| Morning Activity | -0.11% z-0.8 | -0.03% | -0.13% | +1.27% | +2.03% |
| Thematic | |||||
| Gold | -0.38% z-1.2 | +0.09% | -0.19% | +2.68% | +3.53% |
| Treasury (Duration) | -0.28% z-0.9 | -0.17% | -1.12% | -1.44% | -0.48% |
| Semiconductors | -0.30% z-0.5 | +0.36% | +1.98% | -0.12% | -5.81% |
| China | +0.19% z+0.5 | -0.29% | -0.32% | +0.00% | -0.26% |
| Bitcoin / Crypto | +0.08% z+0.2 | +0.14% | +0.20% | +2.60% | +1.42% |
| Oil | +0.07% z+0.1 | +0.62% | +1.14% | +4.00% | +3.71% |
5/20/60d windows include today's session; 1d is the previous session.
Pairwise realized correlation. Index variance net of the weighted idiosyncratic diagonal, over the cross terms — the estimator used for implied-correlation indices. 20-day window unless noted; history since 2020.
Market variance share. The fraction of cross-sectional variance explained by the market factor — the attribution companion to pairwise correlation, not a substitute for it.
Factor z-score. Today's factor return divided by its daily-return standard deviation over ~1,600 trading days.
Conditional importance. A factor's relative share of what a tree-based fit of today's stock returns explains; sums to 100% across factors.
High-beta momentum cohort. US names above $2B market cap in the top quintile of both raw beta and 12-month momentum; membership frozen at each month's first business day. “Top 50” = the 50 strongest by combined rank.
Dispersion (realized). Total cross-sectional volatility net of the market component; high dispersion is the flip side of low correlation.
Stock-specific (idiosyncratic) return. The part of a stock's move not explained by market, style, or thematic factors in our decomposition.
VIXEQ / DSPX / COR1M. Cboe implied indices: single-stock volatility, dispersion, and 1-month implied correlation (top-50 S&P names). Quotes delayed ~15 minutes.
Data compiled by FactorPulse AI; edited and verified by Jeff Klein. For informational purposes only. Does not constitute financial advice, an investment recommendation, or an offer to buy or sell any securities. Always consult a qualified financial professional before making investment decisions.
For more on factor construction methodology, see www.factorpulse.com/glossary.