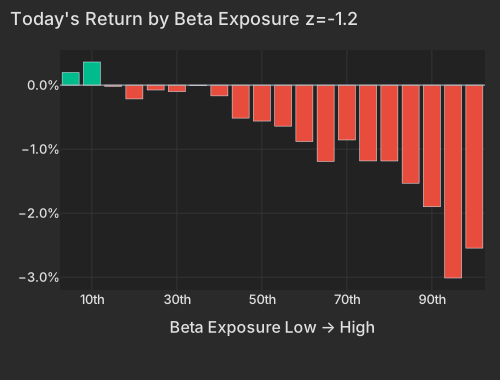
A hotter-than-comfortable inflation report did the sorting on Thursday. Wholesale prices rose 5.4% over the past year, according to the Labor Department, with energy costs up about 4% in August alone and diesel up a startling 24%. That pushed the two-year Treasury yield up a tenth of a point to about 4.5%, and the ten-year to within a whisker of 5%. Stocks responded along a single line: the names that swing hardest with the broader market fell roughly 2.5%, while the S&P 500 slipped about three-quarters of a percent and the steadiest, most defensive corners of the market barely budged. Oil, the same crude driving the inflation numbers, climbed 3.5% to just under $100 a barrel, yet energy stocks fell anyway. Adding to the mood was President Trump's pledge of a $5,000 dividend to adults if Republicans hold Congress, a promise with a price tag estimated at $1.2 trillion to $1.35 trillion.
The losers were last week's winners. Semiconductor stocks, memory-chip makers and South Korean shares, all of which had rallied hard over the past week and month, fell between 3% and 4.5%. Nvidia and Taiwan Semiconductor were each down more than 2%, with little in the way of company-specific news to explain it. Homebuilders dropped another 2.5% and are now off about 10% for the month, as the Treasury yield that anchors mortgage rates keeps climbing. Gold slipped below $4,400 an ounce and gold miners fell about 2.5%, giving back part of a big run. Hedge funds' favorite stocks, including a cluster of Chinese companies listed in New York, took a disproportionate hit even though Goldman Sachs says those funds were already running unusually light on risk. Nomura strategist Charlie McElligott called the backdrop a 'Negative Risk Trinity' of September seasonality, heavy Treasury issuance and an Iran-linked commodity shock, and Bank of America estimates as much as $163 billion of automated selling could follow if the slide deepens.
The biggest individual moves were company stories, not market ones. Contact-lens maker Cooper Companies plunged about 16%, wiping out roughly $1.8 billion in market value, after it missed on revenue, cut its full-year outlook and ended a strategic review by deciding to keep its surgical division. Travel-and-expense software firm Navan fell about 21% despite beating estimates and raising guidance, as a 46% jump in operating costs overshadowed the good news. Copper miner Freeport-McMoRan lost 8% and mining giant BHP dropped more than 5%. Meanwhile, weekly jobless claims held steady at 206,000, offering the Federal Reserve no sign of labor-market weakness to weigh against the inflation report ahead of its meeting next week. Options traders are bracing for more: expected volatility on the S&P 500 rose to its highest level in a month.
The front end moved first. The two-year Treasury yield is up 10.0 bps to 4.527% and the five-year up 10.4 bps to 4.717%CNBC, with the ten-year at 4.926%. The Bureau of Labor Statistics put final-demand energy up 4.2% in August, diesel alone up 24.1% — an inflation print made of the same crude that has WTI at $99.41 as of 9:44 AM ETNYT. Sitting on top of that is Trump's pledge of a $5,000 dividend to adults if Republicans hold Congress, costed at $1.2 trillion to $1.35 trillionNYT.
Equities took it entirely on the beta axis. The decline is a right-tail sort rather than a broad flush: the most market-sensitive names are down -2.55% while SPY is off -0.74% and the low-exposure end is roughly flat. Beta's share of cross-sectional variance sits in the top decile of its own past year — the axis every levered book loads on is doing almost all of the sorting today.
| Factor | Return | Z-Score | 5d Z | 20d Z | 63d Z | Category | Direction |
|---|---|---|---|---|---|---|---|
| Beta | -1.18% | z=-1.2 | +1.03 | -0.52 | -0.33 | Style-Risk | Most market-sensitive names underperformed |
| Hedge-Fund Ownership | -0.12% | z=-1.1 | -0.54 | +0.46 | +1.02 | Style-Positioning | Most hedge-fund-owned names underperformed |
| Treasury (Duration) | -0.31% | z=-1.0 | -1.59 | -1.01 | -0.35 | Thematic | Duration-exposed names underperformed |
| Short-Sale Activity | +0.11% | z=+1.0 | +0.58 | +1.07 | +0.49 | Style-Flow | Yesterday's heavily short-sold names outperformed T+1 |
| Morning Activity | -0.11% | z=-0.9 | -0.5 | +2.3 | +2.0 | Style-Flow | Habitually early-trading names underperformed |
| One-Day Momentum | -0.19% | z=-0.7 | -1.2 | -1.5 | -0.6 | Style-Momentum | Yesterday's winners gave it back |
| Short-Term Momentum | -0.16% | z=-0.5 | -0.16 | -1.51 | -3.03 | Style-Momentum | Last week's leaders reverted |
| Short Interest | -0.06% | z=-0.4 | -2.46 | -0.61 | +0.19 | Style-Positioning | Most-shorted names kept underperforming |
| Bucket | Avg Ret Pct |
|---|---|
| 1 | 0.20 |
| 2 | 0.36 |
| 3 | -0.02 |
| 4 | -0.22 |
| 5 | -0.08 |
| 6 | -0.10 |
| 7 | -0.01 |
| 8 | -0.17 |
| 9 | -0.52 |
| 10 | -0.56 |
| 11 | -0.64 |
| 12 | -0.88 |
| 13 | -1.19 |
| 14 | -0.86 |
| 15 | -1.18 |
| 16 | -1.19 |
| 17 | -1.53 |
| 18 | -1.90 |
| 19 | -3.01 |
| 20 | -2.55 |
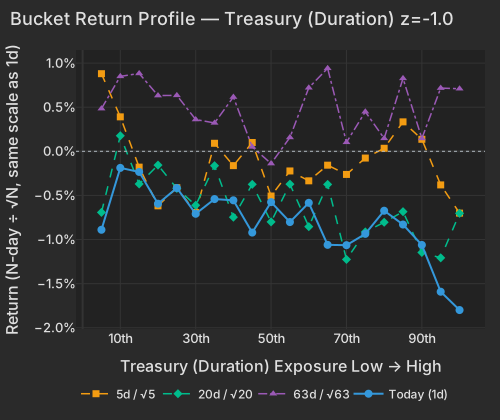
Treasury (Duration) is -0.31% today at z=-1.0, and this is the third week of the same pressure: the factor has taken -1.47% out over 20 sessions with a 5-day z of -1.6. Homebuilders are the clean expression — ITB -2.47% today and -10.14% over 20 sessions, with the ten-year that benchmarks mortgage rates still climbingBloomberg. Metals took the other half of the same trade: spot gold is -0.84% at $4,363 with the dollar index at 99.00CNBC, and SLV is -3.97%.
| Bucket | Ret 1D Pct | Ret 5D Norm Pct | Ret 20D Norm Pct | Ret 63D Norm Pct |
|---|---|---|---|---|
| 1 | -0.89 | 0.88 | -0.69 | 0.48 |
| 2 | -0.19 | 0.39 | 0.18 | 0.85 |
| 3 | -0.23 | -0.18 | -0.37 | 0.88 |
| 4 | -0.59 | -0.62 | -0.16 | 0.63 |
| 5 | -0.42 | -0.41 | -0.42 | 0.63 |
| 6 | -0.71 | -0.69 | -0.61 | 0.36 |
| 7 | -0.54 | 0.09 | -0.16 | 0.32 |
| 8 | -0.56 | -0.16 | -0.75 | 0.62 |
| 9 | -0.92 | 0.10 | -0.37 | 0.05 |
| 10 | -0.58 | -0.51 | -0.80 | -0.14 |
| 11 | -0.80 | -0.22 | -0.37 | 0.16 |
| 12 | -0.58 | -0.33 | -0.85 | 0.72 |
| 13 | -1.06 | -0.16 | -0.38 | 0.94 |
| 14 | -1.06 | -0.26 | -1.23 | 0.10 |
| 15 | -0.94 | -0.08 | -0.91 | 0.45 |
| 16 | -0.67 | 0.03 | -0.80 | 0.15 |
| 17 | -0.83 | 0.33 | -0.68 | 0.83 |
| 18 | -1.06 | 0.14 | -1.15 | 0.15 |
| 19 | -1.59 | -0.38 | -1.21 | 0.72 |
| 20 | -1.80 | -0.70 | -0.70 | 0.71 |
Of the ten weakest ETFs on the board, the two homebuilder funds aside, every one was up over the past five sessions. That is the shape of a market that has been fading its own recent leaders for three months: the 5-day reversion factor — Short-Term Momentum in the table — has run -7.13% over the trailing 60 sessions at z=-3.0 on the 63-day window, and today adds another -0.16% to it.
| ETF | Theme | Today | 1d Ago | 5d Ago | 20d Ago | 63d Ago |
|---|---|---|---|---|---|---|
| USO | oil | +2.38% | +2.70% | +6.36% | +17.52% | +14.22% |
| XLP | consumer staples | +0.71% | -1.15% | -2.58% | -1.94% | -1.25% |
| SPY | large cap | -0.74% | -0.46% | +0.08% | -1.06% | +3.44% |
| QQQ | large cap growth | -1.15% | -0.29% | +1.23% | -0.30% | +1.20% |
| ITB | homebuilders | -2.47% | -0.81% | -2.22% | -10.14% | -6.19% |
| GDX | gold miners | -2.62% | +1.08% | +5.07% | +10.38% | +28.20% |
| SMH | semiconductors | -2.94% | +0.10% | +5.33% | +0.24% | -2.83% |
| EWY | south korea | -3.52% | +0.46% | +8.52% | +14.08% | +3.66% |
| DRAM | memory chips & storage | -4.53% | +0.79% | +11.84% | +21.01% | +2.87% |
| WGMI | crypto miners | -4.92% | -3.89% | +15.87% | +2.57% | -24.24% |
The semiconductor leg is beta, not company news. Entegris is -3.70%, Camtek -3.85% and Sandisk -4.03% with essentially none of it stock-specific; NVDA -2.42% and TSM -2.34% sit in the same bucket, alongside the AI-infrastructure names — NNE, MRAM, AEHR, NVTS — that investors have been marking down on pay-later profitabilityBloomberg. The high-beta momentum cohort is down -2.52% against -0.41% for everything outside it. Crude, meanwhile, is buying nothing in equities: XLE is -0.64% on 2.1× the typical session pace and the Oil factor is flat at z=-0.1.
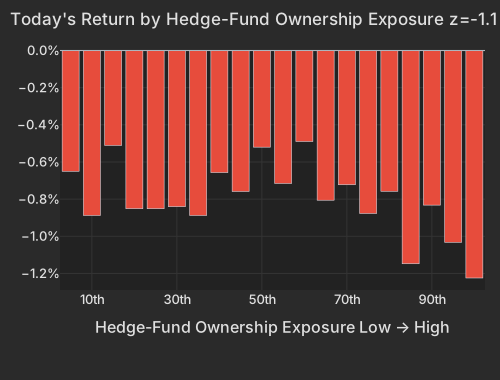
Goldman Sachs Prime Brokerage puts US fundamental long/short net leverage at the 6th percentile and gross at the 20th, covering flows through Wednesday's session at the latest. Our direct lens says those books are wearing today: Hedge-Fund Ownership is -0.12% at z=-1.1 residualized and -0.10% raw, so the most-owned names were hit on their own account and not merely through their beta. The concentration is in China ADRs — SIMO, YMM and ATAT among them, with KWEB -1.15% — and in two AI names down -4.62% as a pair. Nomura's Charlie McElligott frames the setup as a "Negative Risk Trinity" of September seasonality, heavy Treasury issuance and the Iran-linked commodity shock, with Bank of America modelling $163 billion of potential systematic selling in a downturn.
| Bucket | Avg Ret Pct |
|---|---|
| 1 | -0.65 |
| 2 | -0.89 |
| 3 | -0.51 |
| 4 | -0.85 |
| 5 | -0.85 |
| 6 | -0.84 |
| 7 | -0.89 |
| 8 | -0.66 |
| 9 | -0.76 |
| 10 | -0.52 |
| 11 | -0.72 |
| 12 | -0.49 |
| 13 | -0.81 |
| 14 | -0.72 |
| 15 | -0.88 |
| 16 | -0.76 |
| 17 | -1.15 |
| 18 | -0.83 |
| 19 | -1.03 |
| 20 | -1.22 |
One thing is not participating in the de-risking. Short Interest is -0.06% today and -0.92% over the past week, a bottom-1% five-day stretch since 2020 — the most-shorted names keep losing ground, which is the model's largest persistent drag paying and normally arrives with fresh short adds set against fresh longs. Against that, Short-Sale Activity is +0.11% at z=+1.0: yesterday's most heavily short-sold names beat the barely-shorted ones T+1, a one-day result that cuts against the single most reliable effect in the model.
Cooper Companies is down -15.56% after missing on revenue, cutting fiscal-year guidance and ending its strategic review by keeping CooperSurgical, taking $1.8B off its market value. Navan is -20.63% despite beating and raising, with operating expenses up 46% year over year swamping the print, per its second-quarter release. American Eagle is -13.71% with no driver for it in today's coverage. Together with Freeport-McMoRan -8.05% and BHP -5.57%, they are why idiosyncratic risk is 56.3% of today's cross-sectional variance even on a macro-sorted session.
The index leg is nonetheless heavier than it has been: the market factor is running 15.1% of cross-sectional variance so far today, the 65th percentile, against a 20-day stretch where realized pairwise correlation remains pinned near its since-2020 lows at 8.29%, the 4.6th percentile. Implied index volatility is at the top of its 20-session range at 17.74, against a 14.25–16.46 band set between August 14 and yesterday's close. That combination — an index waking up while the 20-day correlation sits at the floor — is what a book hedged with index options finds least comfortable.
The August producer price index the BLS, released at 8:30 AM ET, rose 0.4% month over month in line with consensus, putting the annual rate at 5.4%, with final-demand energy up 4.2% and diesel up 24.1%, according to the Bureau of Labor Statistics. Initial jobless claims the BLS, also released at 8:30 AM ET, fell 1,000 to 206,000 for the week ended September 5 against 205,000 expected, with continuing claims at 1.774 million — no labour-market crack to offset the inflation print ahead of next week's FOMC the Federal Reserve.
Variance decomposition: live intraday — 20260910 session, bracketed against its trailing-year range. Factor returns are trailing through last close. Total cross-sectional dispersion: 4.0%ile of the past year.
Variance mix — % of total, today vs 1d ago vs 1-yr avg
market 76%ile style 84%ile thematic 51%ile idiosyncratic 20%ile
Variance explained — today vs. factor's trailing-year range
Marker = the factor's share of today's total variance, placed in its own trailing-year range (box 25–75%ile, ticks 90%ile and max). Amber marker = unusually load-bearing today (≥90%ile of its own year). Factor name green = up today / red = down.
Correlation & dispersion — realized vs implied
Pairwise realized correlation (20d): 8.29% 4.6%ile since 2020 · 56%ile 3m
Top-500 pairwise: 7.09% 3.0%ile since 2020 · 29%ile 3m · implied (Cboe COR1M): 11.36 5.8%ile of its own history (gap -4.3pp)
Realized 20d vol (ann. pts): all stocks 39 vs VIXEQ 37 · index 10 vs VIX 18 · style factors 19 66%ile
20-day window (19 completed days + today); percentiles vs model history since 2020; '3m' tokens rank vs the trailing 63 trading days; definitions in Terms below. Implied prints (Cboe) are delayed ~15 min. as of 09:41 ET
High-beta momentum cohort (eq-wt, since-2020 rank): -2.5% 12%ile · rest of market -0.4%
| Factor | Today | 1d | 5d | 20d | 60d |
|---|---|---|---|---|---|
| Style-Risk | |||||
| Beta | -1.18% z-1.2 | -0.09% | +2.23% | -2.24% | -8.52% |
| Residual Volatility | +0.15% z+0.3 | -0.20% | -0.26% | +1.05% | +1.16% |
| International | -0.08% z-0.3 | +0.05% | -0.08% | +1.37% | +0.54% |
| Style | |||||
| Value | -0.16% z-0.7 | +0.15% | -0.08% | +0.20% | -0.69% |
| Profitability | -0.11% z-0.6 | -0.04% | -0.37% | -0.76% | -3.04% |
| Size | +0.17% z+0.5 | +0.41% | +0.70% | +1.29% | -0.03% |
| Leverage | -0.04% z-0.2 | -0.10% | +0.36% | -0.51% | -3.20% |
| Dividend Yield | +0.01% z+0.1 | +0.08% | +0.37% | +0.76% | -0.54% |
| Liquidity | +0.02% z+0.1 | -0.06% | +0.55% | +2.46% | +0.45% |
| Growth | +0.00% z+0.0 | -0.04% | -0.34% | -0.40% | +2.28% |
| Style-Momentum | |||||
| One-Day Momentum | -0.19% z-0.7 | +0.02% | -0.76% | -1.88% | -1.04% |
| Short-Term Momentum | -0.16% z-0.5 | -0.01% | -0.11% | -2.06% | -7.13% |
| Medium-Term Momentum | -0.08% z-0.3 | +0.26% | -0.76% | +0.35% | +0.81% |
| Long-Term Momentum | -0.18% z-0.3 | +0.76% | +1.72% | +0.96% | -4.32% |
| Style-Positioning | |||||
| Hedge-Fund Ownership | -0.12% z-1.1 | -0.00% | -0.13% | +0.22% | +1.00% |
| Short Interest | -0.06% z-0.4 | -0.22% | -0.92% | -0.46% | +0.21% |
| Style-Flow | |||||
| Short-Sale Activity | +0.11% z+1.0 | -0.05% | +0.14% | +0.52% | +0.80% |
| Morning Activity | -0.11% z-0.9 | -0.03% | -0.14% | +1.27% | +2.02% |
| Thematic | |||||
| Treasury (Duration) | -0.31% z-1.0 | -0.17% | -1.16% | -1.47% | -0.51% |
| Gold | -0.15% z-0.5 | +0.09% | +0.03% | +2.90% | +3.75% |
| Semiconductors | -0.21% z-0.3 | +0.36% | +2.07% | -0.03% | -5.72% |
| Bitcoin / Crypto | +0.05% z+0.2 | +0.14% | +0.18% | +2.58% | +1.40% |
| Oil | -0.07% z-0.1 | +0.62% | +1.00% | +3.86% | +3.57% |
| China | -0.04% z-0.1 | -0.29% | -0.55% | -0.23% | -0.49% |
5/20/60d windows include today's session; 1d is the previous session.
Pairwise realized correlation. Index variance net of the weighted idiosyncratic diagonal, over the cross terms — the estimator used for implied-correlation indices. 20-day window unless noted; history since 2020.
Market variance share. The fraction of cross-sectional variance explained by the market factor — the attribution companion to pairwise correlation, not a substitute for it.
Factor z-score. Today's factor return divided by its daily-return standard deviation over ~1,600 trading days.
Conditional importance. A factor's relative share of what a tree-based fit of today's stock returns explains; sums to 100% across factors.
High-beta momentum cohort. US names above $2B market cap in the top quintile of both raw beta and 12-month momentum; membership frozen at each month's first business day. “Top 50” = the 50 strongest by combined rank.
Dispersion (realized). Total cross-sectional volatility net of the market component; high dispersion is the flip side of low correlation.
Stock-specific (idiosyncratic) return. The part of a stock's move not explained by market, style, or thematic factors in our decomposition.
VIXEQ / DSPX / COR1M. Cboe implied indices: single-stock volatility, dispersion, and 1-month implied correlation (top-50 S&P names). Quotes delayed ~15 minutes.
Data compiled by FactorPulse AI; edited and verified by Jeff Klein. For informational purposes only. Does not constitute financial advice, an investment recommendation, or an offer to buy or sell any securities. Always consult a qualified financial professional before making investment decisions.
For more on factor construction methodology, see www.factorpulse.com/glossary.