Oil crossed a line the market had watched for weeks on Wednesday, with Brent breaking above $100 a barrel after coordinated Houthi strikes on Saudi Aramco facilities at Jazan, Abha and Najran forced a temporary halt to operations at several southern energy sites. The bond market added its own weight: the Treasury said it would buy back up to $6 billion of 10- to 20-year bonds on Thursday, far larger than its usual operation but well short of what dealers had hoped for, and long-term yields moved the wrong way immediately, with the 10-year climbing to 4.84% even after Scott Bessent had told traders the night before that he is "the house now". Stocks slipped, but unevenly: the S&P 500 lost about 0.4% while the Russell 2000 dropped 1.3%, as the smallest companies took the brunt of higher rates and pricier fuel.
Underneath the index, the selling had a clear pattern: the stocks that had already fallen the most over the past year fell hardest again, while last year's winners eked out a small gain on the back of a handful of biotech names. Aerospace-and-defense stocks were the clearest casualties, dropping sharply on Wednesday after already losing more than a tenth of their value over the past month, and higher crude weighed on European defense names and banks as well; Lucid and a clutch of small nuclear-reactor developers went the same way. Industrials had the weakest typical stock of any sector, with GE and Uber both falling hard, and the largest companies held up far better than the smallest. The oil trade itself is now four weeks old, with the main oil ETF up about 16% over that stretch, and U.S. crude was trading around $96.60 late in the afternoon. Gold climbed to nearly $4,400 an ounce, and gold miners and silver were the only other groups bid.
For all the macro drama, company news rather than the broad tape drove most of the day's individual moves. Meta was the standout winner, adding roughly $96 billion in market value after launching its Muse AI assistant on paid monthly plans, and Cloudflare surged on an analyst upgrade that cited accelerating AI workloads; jeweler Signet jumped 24% and a home-services software company lost nearly a third of its value, the biggest company-specific swings of the year for each. Earnings were less kind: Chewy dropped hard on its morning report, Casey's General Stores did the same the day after its results, and Cooper Companies fell in the regular session and then slid much further after the bell for reasons that had not yet surfaced. The most heavily shorted stocks lagged, and Goldman Sachs reported that hedge funds were running unusually light net positioning through September 8 while selectively adding to memory-chip and semiconductor makers, among the month's few winners. Next up is Friday's August inflation report at 8:30 AM ET, where economists expect a 0.4% headline rise against 0.2% on core, with energy doing much of the work.
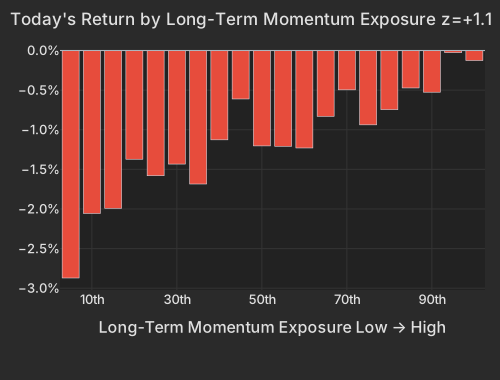
Long-Term Momentum took 4.8% of the day's cross-sectional variance, the largest share of any style factor, and it did so with the highest conditional importance on the board at 0.46. The mechanics matter more than the sign: the bottom-exposure bucket — the worst one-year performers — fell -2.88%, while the strongest one-year winners eked out +1.25% behind a handful of biotech names. Nobody bid the winners; the laggards were dumped. Enovix was down -7.81% on the day and Lucid -6.91%, with roughly half of each move coming from the factor complex rather than anything company-specific.
| Factor | Return | Z-Score | 5d Z | 20d Z | 63d Z | Category | Direction |
|---|---|---|---|---|---|---|---|
| Long-Term Momentum | +0.74% | z=+1.15 | +1.29 | +0.79 | -0.43 | Style-Momentum | 1-year winners over laggards |
| Oil | +0.65% | z=+1.37 | +1.04 | +1.91 | +0.87 | Thematic | oil-exposed names led |
| Size | +0.40% | z=+1.13 | +0.35 | +0.66 | -0.03 | Style | large caps over small |
| Short Interest | -0.23% | z=-1.39 | -1.94 | -0.90 | +0.16 | Style-Positioning | most-shorted names lagged |
| Semiconductors | +0.33% | z=+0.54 | +1.5 | +0.5 | -0.8 | Thematic | chip-exposed names held |
| Short-Sale Activity | -0.04% | z=-0.34 | +1.01 | +1.00 | +0.31 | Style-Flow | barely-shorted over most short-sold |
| Short-Term Momentum | -0.03% | z=-0.09 | -0.54 | -1.65 | -2.88 | Style-Momentum | prior week's movers faded, flat today |
| Hedge-Fund Ownership | -0.00% | z=-0.03 | -0.31 | +0.53 | +1.18 | Style-Positioning | flat |
| Bucket | Avg Ret Pct |
|---|---|
| 1 | -2.87 |
| 2 | -2.06 |
| 3 | -1.99 |
| 4 | -1.37 |
| 5 | -1.58 |
| 6 | -1.43 |
| 7 | -1.68 |
| 8 | -1.13 |
| 9 | -0.61 |
| 10 | -1.20 |
| 11 | -1.21 |
| 12 | -1.23 |
| 13 | -0.83 |
| 14 | -0.50 |
| 15 | -0.94 |
| 16 | -0.75 |
| 17 | -0.47 |
| 18 | -0.53 |
| 19 | -0.03 |
| 20 | -0.13 |
The clearest face of that laggard bucket is the aerospace-and-defense complex, where XAR fell -2.26% and ITA -1.68% on top of 20-day declines of -12.15% and -10.99%. Higher crude weighed on European defense names and banks in the same sessionWSJ, and the speculative energy-adjacent names in the same bucket — NuScale, Nano Nuclear, Enovix — went with it.
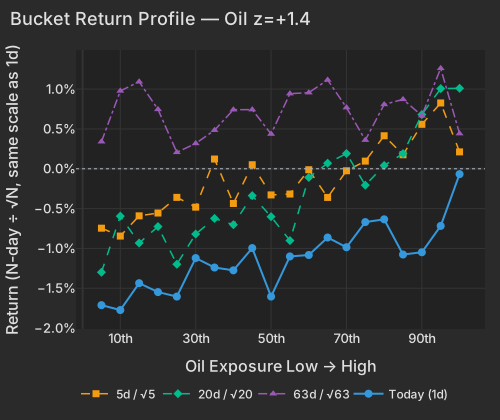
WTI marked $96.64, up 3.88%, at 4:44 PM ETCNBC, with Brent through $100 after coordinated Houthi strikes on Aramco facilities in Jazan, Abha and Najran and a temporary suspension of operations at several southern energy sitesNYTWSJ. The factor answer is real but not new: Oil at +0.65% today sits on +4.05% over 20 sessions, and the exposure sort has sloped the same way for a month. Spot gold at $4,399.53, +1.04%, joined itCNBC, with GDX +1.15% and SLV +2.40% the only other bid worth naming.
| ETF | Theme | Today | 1d Ago | 5d Ago | 20d Ago | 63d Ago |
|---|---|---|---|---|---|---|
| USO | oil | +2.67% | +2.87% | +9.22% | +15.97% | +8.05% |
| XLE | energy | +0.76% | +1.11% | +1.27% | +7.63% | +11.04% |
| GDX | gold miners | +1.15% | -0.86% | -0.10% | +8.75% | +25.09% |
| DRAM | memory chips & storage | +0.88% | +2.36% | +7.38% | +23.19% | +0.96% |
| SPY | large cap | -0.42% | -0.55% | -0.14% | -0.91% | +3.62% |
| IWM | small cap | -1.30% | -0.45% | +0.25% | -1.77% | +3.72% |
| ARKK | innovation growth | -1.74% | -0.16% | +0.60% | +7.01% | +13.44% |
| XAR | defense | -2.26% | +0.14% | -1.27% | -12.15% | -6.58% |
| Bucket | Ret 1D Pct | Ret 5D Norm Pct | Ret 20D Norm Pct | Ret 63D Norm Pct |
|---|---|---|---|---|
| 1 | -1.71 | -0.75 | -1.30 | 0.34 |
| 2 | -1.77 | -0.84 | -0.59 | 0.98 |
| 3 | -1.44 | -0.59 | -0.93 | 1.09 |
| 4 | -1.55 | -0.56 | -0.73 | 0.75 |
| 5 | -1.60 | -0.36 | -1.20 | 0.21 |
| 6 | -1.12 | -0.48 | -0.82 | 0.32 |
| 7 | -1.24 | 0.12 | -0.62 | 0.48 |
| 8 | -1.27 | -0.44 | -0.70 | 0.74 |
| 9 | -1.00 | 0.05 | -0.34 | 0.74 |
| 10 | -1.60 | -0.33 | -0.60 | 0.44 |
| 11 | -1.10 | -0.32 | -0.90 | 0.94 |
| 12 | -1.08 | -0.01 | -0.11 | 0.96 |
| 13 | -0.86 | -0.36 | 0.07 | 1.11 |
| 14 | -0.99 | -0.03 | 0.19 | 0.77 |
| 15 | -0.67 | 0.10 | -0.21 | 0.36 |
| 16 | -0.63 | 0.41 | 0.04 | 0.81 |
| 17 | -1.08 | 0.18 | 0.19 | 0.87 |
| 18 | -1.05 | 0.56 | 0.68 | 0.67 |
| 19 | -0.72 | 0.83 | 1.01 | 1.26 |
| 20 | -0.07 | 0.21 | 1.01 | 0.44 |
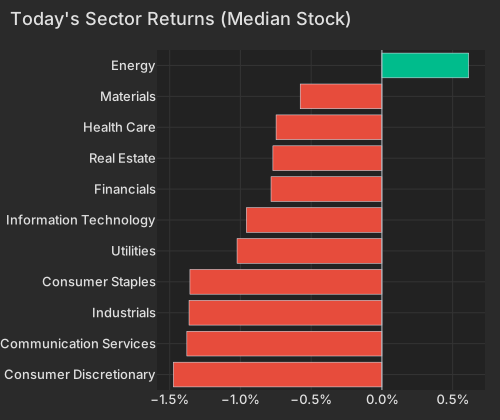
Treasury will repurchase up to $6bn of 10- to 20-year bonds on Thursday, triple the historical $2bn operation but short of the $7bn–$10bn the market wanted, and long yields went the wrong way immediatelyBloomberg. The curve rose across every tenor, the 10-year at 4.843% (+3.9 bps) and the 5-year at 4.618% (+4.5 bps)CNBC, with Scott Bessent having told traders the night before that he is "the house now"FT. In the cross-section that landed as a size sort: the largest-cap bucket gave up just -0.4% against -2.32% for the smallest, and IJR -0.78% and MDY -1.07% trailed a QQQ that lost only -0.28%. Industrials had the weakest median stock of the sectors reported at -1.65%, GE -2.73% and Uber -2.58% inside it.
| Sector | Median Ret Pct |
|---|---|
| Consumer Discretionary | -1.47 |
| Communication Services | -1.38 |
| Industrials | -1.36 |
| Consumer Staples | -1.36 |
| Utilities | -1.02 |
| Information Technology | -0.96 |
| Financials | -0.78 |
| Real Estate | -0.77 |
| Health Care | -0.75 |
| Materials | -0.58 |
| Energy | 0.61 |
The macro sorting was directional, not dominant. The market leg explained 12.4% of cross-sectional variance and the whole style block 9.0% — against a one-year average of 21.9% for style and 41.8% as recently as yesterday's session — leaving 77.3% to single names. Signet closed +24.18% and ServiceTitan -30.00%, both the largest stock-specific moves in their trailing year; The Bancorp closed -22.26%. Cooper Companies closed the regular session -6.37%, then fell a further -13.93% after the bell on a driver that has not yet reached the day's coverage. Meta closed +6.44% on the launch of its Muse agent at $20 and $100 monthly tiers, adding about $96B of market valueForbes, and Cloudflare closed +10.62% after an upgrade citing accelerating AI inference workloadsBloomberg. With the 20-day pairwise realized correlation still pinned near its since-2020 lows at 7.68%, a day like this is what that number looks like from the inside.
None of the risk-appetite gauges broke. The most heavily shorted names underperformed the barely-shorted end — Short Interest -0.23% at z=-1.39, the model's most durable drag paying — and Hedge-Fund Ownership was flat on both the residualized and raw measures (z=-0.03 and z=+0.14), so the names hedge funds concentrate in were neither singled out nor spared. Memory held up with DRAM +0.88% on top of +23.19% over 20 sessions, and the Semiconductors factor printed +0.33%. Goldman Sachs Prime Brokerage put US fundamental long/short net leverage at the 4th percentile of the past year and gross at the 27th, with managers selectively re-grossing into memory and semiconductor names — flows through September 8 at the latestCNBC. Underneath all of it, the 5-day reversion factor — Short-Term Momentum in the table — has run -7.25% over the trailing 60 sessions at z=-2.9 on the 63-day window: the prior week's movers have been faded for three months straight, and today it simply sat out at z=-0.09.
Casey's General Stores closed -14.23% the session after reporting, Chewy -11.15% on its pre-open print, and Sunbelt Rentals +5.79%. The August CPI bls.gov report is due Friday at 8:30 AM ET with consensus at 0.4% on the headline and 0.2% on core, while the New York Fed's one-year inflation expectations held at 3.6%NEWYORKFED. With Brent through $100 and the energy component doing the work in that forecast, the print lands squarely on the one factor axis that has been paying for a month.
Variance decomposition: live intraday — 20260909 session, bracketed against its trailing-year range. Factor returns are trailing through last close. Total cross-sectional dispersion: 27%ile of the past year.
Variance mix — % of total, today vs 1d ago vs 1-yr avg
market 76%ile style 16%ile thematic 24%ile idiosyncratic 62%ile
Variance explained — today vs. factor's trailing-year range
Marker = the factor's share of today's total variance, placed in its own trailing-year range (box 25–75%ile, ticks 90%ile and max). Amber marker = unusually load-bearing today (≥90%ile of its own year). Factor name green = up today / red = down.
Correlation & dispersion — realized vs implied
Pairwise realized correlation (20d): 7.68% 2.8%ile since 2020 · 38%ile 3m
Top-500 pairwise: 6.86% 2.4%ile since 2020 · 24%ile 3m · implied (Cboe COR1M): 11.36 5.8%ile of its own history (gap -4.5pp)
Realized 20d vol (ann. pts): all stocks 40 vs VIXEQ 37 · index 10 vs VIX 16 · style factors 19 68%ile
20-day window (19 completed days + today); percentiles vs model history since 2020; '3m' tokens rank vs the trailing 63 trading days; definitions in Terms below. Implied prints (Cboe) are delayed ~15 min. as of 16:41 ET
High-beta momentum cohort (eq-wt, since-2020 rank): -0.1% 43%ile · rest of market -1.1%
| Factor | Today | 1d | 5d | 20d | 60d |
|---|---|---|---|---|---|
| Style-Risk | |||||
| Residual Volatility | -0.24% z-0.5 | -0.25% | -0.70% | +1.04% | +1.20% |
| International | +0.11% z+0.4 | -0.04% | +0.27% | +1.32% | +0.50% |
| Beta | -0.06% z-0.1 | +1.42% | +3.76% | +0.03% | -4.73% |
| Style | |||||
| Size | +0.40% z+1.1 | +0.12% | +0.28% | +1.05% | +0.44% |
| Value | +0.17% z+0.7 | -0.19% | +0.43% | +0.28% | -0.56% |
| Dividend Yield | +0.09% z+0.5 | +0.27% | +0.28% | +0.96% | -0.73% |
| Leverage | -0.06% z-0.4 | +0.31% | +0.43% | -0.07% | -3.18% |
| Liquidity | -0.09% z-0.3 | +0.34% | +0.70% | +2.96% | +0.70% |
| Growth | -0.06% z-0.2 | -0.30% | -0.35% | -0.38% | +2.66% |
| Profitability | -0.01% z-0.1 | -0.21% | -0.42% | -0.48% | -2.87% |
| Style-Momentum | |||||
| Long-Term Momentum | +0.74% z+1.1 | +1.10% | +1.86% | +2.28% | -4.30% |
| Medium-Term Momentum | +0.24% z+0.8 | -0.48% | -0.33% | +0.24% | +0.67% |
| Short-Term Momentum | -0.03% z-0.1 | -0.05% | -0.37% | -2.25% | -7.25% |
| One-Day Momentum | -0.01% z-0.0 | +0.12% | -0.41% | -1.67% | -0.73% |
| Style-Positioning | |||||
| Short Interest | -0.23% z-1.4 | -0.22% | -0.73% | -0.68% | +0.41% |
| Hedge-Fund Ownership | -0.00% z-0.0 | +0.01% | -0.08% | +0.26% | +1.20% |
| Style-Flow | |||||
| Short-Sale Activity | -0.04% z-0.3 | -0.07% | +0.25% | +0.49% | +0.47% |
| Morning Activity | +0.01% z+0.1 | +0.12% | +0.15% | +1.32% | +1.99% |
| Thematic | |||||
| Oil | +0.65% z+1.4 | +0.79% | +1.11% | +4.05% | +3.17% |
| China | -0.25% z-0.6 | -0.18% | -0.75% | -0.54% | -0.35% |
| Treasury (Duration) | -0.19% z-0.6 | -0.25% | -0.52% | -1.47% | -0.74% |
| Semiconductors | +0.33% z+0.5 | +1.30% | +2.05% | +1.30% | -5.35% |
| Gold | +0.12% z+0.4 | -0.01% | +0.51% | +2.93% | +4.24% |
| Bitcoin / Crypto | +0.11% z+0.3 | -0.11% | +0.06% | +2.53% | +1.76% |
5/20/60d windows include today's session; 1d is the previous session.
Pairwise realized correlation. Index variance net of the weighted idiosyncratic diagonal, over the cross terms — the estimator used for implied-correlation indices. 20-day window unless noted; history since 2020.
Market variance share. The fraction of cross-sectional variance explained by the market factor — the attribution companion to pairwise correlation, not a substitute for it.
Factor z-score. Today's factor return divided by its daily-return standard deviation over ~1,600 trading days.
Conditional importance. A factor's relative share of what a tree-based fit of today's stock returns explains; sums to 100% across factors.
Stock-specific (idiosyncratic) return. The part of a stock's move not explained by market, style, or thematic factors in our decomposition.
Data compiled by FactorPulse AI; edited and verified by Jeff Klein. For informational purposes only. Does not constitute financial advice, an investment recommendation, or an offer to buy or sell any securities. Always consult a qualified financial professional before making investment decisions.
For more on factor construction methodology, see www.factorpulse.com/glossary.