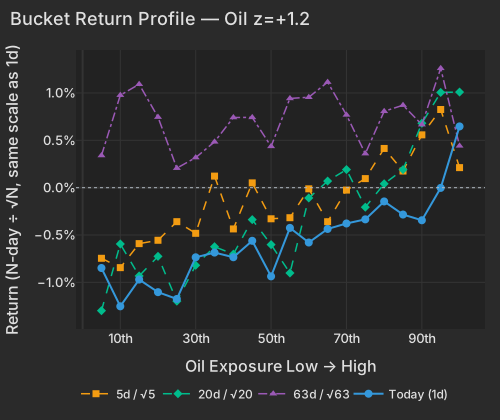
Brent broke $100 for the first time since July after U.S. forces struck five Iranian tankers and reports confirmed hits on Saudi oil facilitiesWSJ. WTI is at $95.68, up +2.85% as of 9:50 ETCNBC. The Oil factor is up +0.59% at z=+1.25, and its 20-day z of +1.88 says today is the newest push on a trade that has been working since early August, not the start of one. USO is up +1.66% at 2.6× the typical session pace, with +15.97% over 20 sessions behind it.
| Bucket | Ret 1D Pct | Ret 5D Norm Pct | Ret 20D Norm Pct | Ret 63D Norm Pct |
|---|---|---|---|---|
| 1 | -0.85 | -0.75 | -1.30 | 0.34 |
| 2 | -1.25 | -0.84 | -0.59 | 0.98 |
| 3 | -0.97 | -0.59 | -0.93 | 1.09 |
| 4 | -1.10 | -0.56 | -0.73 | 0.75 |
| 5 | -1.18 | -0.36 | -1.20 | 0.21 |
| 6 | -0.74 | -0.48 | -0.82 | 0.32 |
| 7 | -0.69 | 0.12 | -0.62 | 0.48 |
| 8 | -0.73 | -0.44 | -0.70 | 0.74 |
| 9 | -0.56 | 0.05 | -0.34 | 0.74 |
| 10 | -0.94 | -0.33 | -0.60 | 0.44 |
| 11 | -0.42 | -0.32 | -0.90 | 0.94 |
| 12 | -0.58 | -0.01 | -0.11 | 0.96 |
| 13 | -0.44 | -0.36 | 0.07 | 1.11 |
| 14 | -0.38 | -0.03 | 0.19 | 0.77 |
| 15 | -0.33 | 0.10 | -0.21 | 0.36 |
| 16 | -0.15 | 0.41 | 0.04 | 0.81 |
| 17 | -0.28 | 0.18 | 0.19 | 0.87 |
| 18 | -0.34 | 0.56 | 0.68 | 0.67 |
| 19 | -0.00 | 0.83 | 1.01 | 1.26 |
| 20 | 0.65 | 0.21 | 1.01 | 0.44 |
Energy's median stock is up +0.86% — Exxon +2.12%, Chevron +2.11%, Equinor +3.46% — while the median stock in Industrials, Financials, Consumer Discretionary and Communication Services all sit near -1%. The rest of the hard-asset complex came with it: spot gold is $4,412.42, up +1.34% at 9:59 ETCNBC, SLV is up +3.37% on 2.2× the usual pace, and the dollar index is at 98.656, -0.13%CNBC.
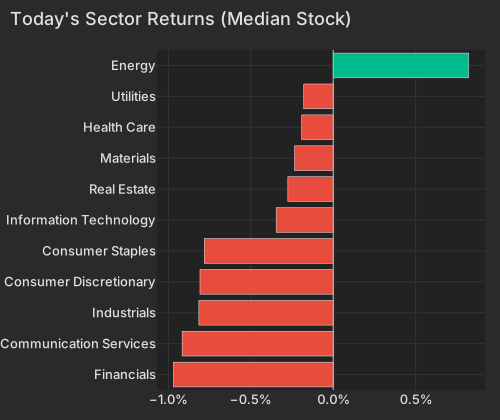
| Sector | Median Ret Pct |
|---|---|
| Financials | -0.97 |
| Communication Services | -0.92 |
| Industrials | -0.82 |
| Consumer Discretionary | -0.81 |
| Consumer Staples | -0.78 |
| Information Technology | -0.35 |
| Real Estate | -0.28 |
| Materials | -0.23 |
| Health Care | -0.19 |
| Utilities | -0.18 |
| Energy | 0.82 |
| Factor | Return | Z-Score | 5d Z | 20d Z | 63d Z | Category | Direction |
|---|---|---|---|---|---|---|---|
| Oil | +0.59% | z=+1.25 | +0.99 | +1.88 | +0.85 | Thematic | oil-exposed names led |
| Long-Term Momentum | +0.72% | z=+1.11 | +1.27 | +0.78 | -0.44 | Style-Momentum | 1-year winners beat laggards |
| Dividend Yield | +0.20% | z=+1.13 | +0.99 | +1.36 | -0.07 | Style | lowest-payout end lagged |
| Semiconductors | +0.46% | z=+0.76 | +1.61 | +0.53 | -0.77 | Thematic | chip-exposed names led |
| Short-Term Momentum | +0.08% | z=+0.27 | -0.38 | -1.57 | -2.84 | Style-Momentum | 63-day reversion run intact |
| Liquidity | +0.03% | z=+0.10 | +1.33 | +2.54 | +0.36 | Style | easiest-to-trade names led for a month |
| Short Interest | -0.06% | z=-0.36 | -1.48 | -0.67 | +0.29 | Style-Positioning | most-shorted names lagged |
| Short-Sale Activity | -0.05% | z=-0.45 | +0.96 | +0.98 | +0.29 | Style-Flow | prior-day short-sale flow paid T+1 |
The aerospace and defense funds are lower on a day the Gulf conflict widened. ITA is down -1.53% and XAR -1.54%, and the 20-day columns — -10.99% and -12.15% — say most of this was priced before the tankers were hit. The same pressure shows inside the 1-year-laggard end of the momentum sort, where the defense names are down -2.53% and the small-reactor group NNE, SMR and OKLO sits alongside them. A Forbes commentary published Wednesday framed mounting Iranian-theater costs as forcing near-term tradeoffs in U.S. defense spending; the market is treating the escalation as a claim on the budget rather than as order flow.
| ETF | Theme | Today | 1d Ago | 5d Ago | 20d Ago | 63d Ago |
|---|---|---|---|---|---|---|
| SLV | silver | +3.37% | -0.75% | -1.26% | -0.07% | -3.59% |
| GDX | gold miners | +1.97% | -0.86% | -0.10% | +8.75% | +25.09% |
| USO | oil | +1.66% | +2.87% | +9.22% | +15.97% | +8.05% |
| XLE | energy | +1.14% | +1.11% | +1.27% | +7.63% | +11.04% |
| XOP | oil E&P | +0.46% | +1.68% | +2.62% | +10.22% | +15.16% |
| SPY | large cap | -0.27% | -0.55% | -0.14% | -0.91% | +3.62% |
| ITA | defense | -1.53% | -0.92% | -2.11% | -10.99% | -1.64% |
| XAR | defense | -1.54% | +0.14% | -1.27% | -12.15% | -6.58% |
SPY is down -0.27% with a war widening in the Gulf. The market leg accounts for 5.1% of today's cross-sectional variance against a one-year average of 9.3%, and 80.2% of it is idiosyncratic. Implied index volatility is 16.14, at the top of a 14.25–16.34 band over the past 20 sessionsCboe. Twenty-day realized pairwise correlation stays at 7.26%, the 2.0th percentile since 2020, and implied 1-month single-stock correlation (Cboe COR1M) at 10.12 sits inside the lowest 4.1% of its own 20-year history — the options market is priced for names to keep going their own way.
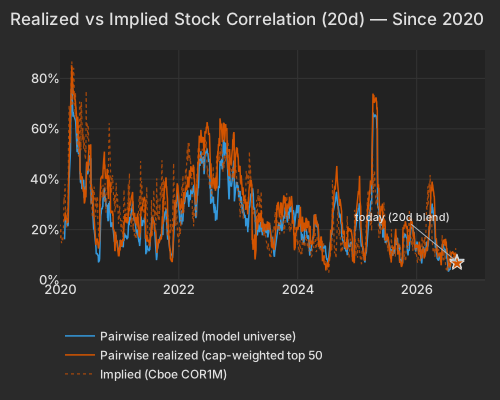
| Series | Today Pct | Prev Close Pct |
|---|---|---|
| pairwise_model | 7.26 | 6.94 |
| pairwise_top500 | 6.66 | 6.77 |
| implied_cor1m |
The day's biggest moves belong to their own stories: Casey's General Stores -18.37% in the session after its report, ServiceTitan -28.12%, Signet +18.15%. Meta is up +5.59% and adding $86.85B of market value after unveiling Muse, its first personal AI agent, on Tuesday — and its market, style and thematic legs are all negative today, leaving the move as the stock's own, in the 98th percentile of its trailing year. UnitedHealth is down -5.19%, erasing $18.85B, after management pointed to persistent medical utilization and elevated claims costsWSJ; XLV is only -0.37% today after -2.52% in the prior session.
Under the commodity story sits the month's most persistent factor signal. Short-Term Momentum — the 5-day trend factor — has run -6.87% over the trailing 63 sessions through the prior close, the 1.6th percentile of overlapping 63-day windows since 2020, at z=-2.84. Each week's leaders have been faded in turn. Goldman Sachs Prime Services put U.S. fundamental long/short net leverage in the 4th percentile as of the September 8 session, with gross at the 27th. That pairing is indicative of hedge-fund deleveraging and releveraging churn rather than a verdict on any theme. Liquidity's 20-day run of +3.08% ranks in the 97.3rd percentile of 20-day windows since 2020 — the easiest-to-trade names have led for a month, which is what putting size back to work looks like.
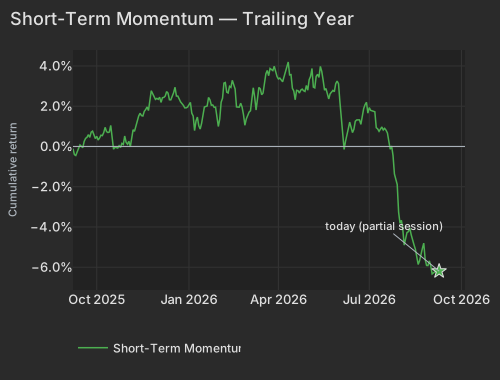
| Date | Cumret Pct |
|---|---|
| 2025-09-08 | -0.11 |
| 2025-09-10 | -0.45 |
| 2025-09-15 | 0.07 |
| 2025-09-17 | -0.06 |
| 2025-09-22 | 0.45 |
| 2025-09-24 | 0.45 |
| 2025-09-29 | 0.59 |
| 2025-10-01 | 0.50 |
| 2025-10-06 | 0.56 |
| 2025-10-08 | 0.69 |
| 2025-10-13 | 0.69 |
| 2025-10-15 | 1.05 |
| 2025-10-20 | -0.04 |
| 2025-10-22 | -0.08 |
| 2025-10-27 | 0.15 |
| 2025-10-29 | 0.52 |
| 2025-11-03 | 0.26 |
| 2025-11-06 | 0.83 |
| 2025-11-10 | 1.02 |
| 2025-11-13 | 1.65 |
| 2025-11-17 | 1.51 |
| 2025-11-20 | 1.96 |
| 2025-11-24 | 2.18 |
| 2025-11-28 | 2.34 |
| 2025-12-02 | 2.34 |
| 2025-12-05 | 2.42 |
| 2025-12-09 | 2.50 |
| 2025-12-12 | 2.32 |
| 2025-12-16 | 2.47 |
| 2025-12-19 | 2.50 |
| 2025-12-23 | 2.31 |
| 2025-12-29 | 1.92 |
| 2025-12-31 | 1.96 |
| 2026-01-06 | 1.51 |
| 2026-01-09 | 1.46 |
| 2026-01-13 | 0.87 |
| 2026-01-16 | 1.96 |
| 2026-01-21 | 2.44 |
| 2026-01-26 | 2.06 |
| 2026-01-28 | 1.95 |
| 2026-02-02 | 1.35 |
| 2026-02-04 | 2.40 |
| 2026-02-09 | 2.70 |
| 2026-02-11 | 2.99 |
| 2026-02-17 | 2.86 |
| 2026-02-19 | 1.96 |
| 2026-02-24 | 1.96 |
| 2026-02-26 | 1.05 |
| 2026-03-03 | 1.71 |
| 2026-03-05 | 2.37 |
| 2026-03-10 | 1.81 |
| 2026-03-13 | 2.86 |
| 2026-03-17 | 2.65 |
| 2026-03-20 | 3.78 |
| 2026-03-24 | 3.88 |
| 2026-03-27 | 3.99 |
| 2026-03-31 | 3.47 |
| 2026-04-06 | 3.21 |
| 2026-04-08 | 3.69 |
| 2026-04-13 | 3.55 |
| 2026-04-15 | 2.89 |
| 2026-04-20 | 2.79 |
| 2026-04-22 | 2.65 |
| 2026-04-27 | 2.77 |
| 2026-04-29 | 3.03 |
| 2026-05-04 | 3.48 |
| 2026-05-06 | 2.95 |
| 2026-05-11 | 3.59 |
| 2026-05-14 | 3.73 |
| 2026-05-18 | 2.80 |
| 2026-05-21 | 2.36 |
| 2026-05-26 | 2.78 |
| 2026-05-29 | 3.25 |
| 2026-06-02 | 2.21 |
| 2026-06-05 | -0.15 |
| 2026-06-09 | 0.68 |
| 2026-06-12 | 0.95 |
| 2026-06-16 | 0.86 |
| 2026-06-22 | 1.32 |
| 2026-06-24 | 1.61 |
| 2026-06-29 | 2.20 |
| 2026-07-01 | 1.93 |
| 2026-07-07 | 1.72 |
| 2026-07-09 | 0.88 |
| 2026-07-14 | 0.97 |
| 2026-07-17 | 0.81 |
| 2026-07-21 | 0.26 |
| 2026-07-24 | -0.45 |
| 2026-07-28 | -1.71 |
| 2026-07-31 | -3.82 |
| 2026-08-04 | -4.12 |
| 2026-08-07 | -4.27 |
| 2026-08-11 | -4.05 |
| 2026-08-14 | -4.88 |
| 2026-08-18 | -5.54 |
| 2026-08-21 | -5.29 |
| 2026-08-25 | -4.80 |
| 2026-08-28 | -5.92 |
| 2026-09-01 | -5.93 |
| 2026-09-04 | -6.22 |
| 2026-09-09 | -6.19 |
Systematic demand is lined up on the other side: BofA has CTAs back to a bias to buy, projecting $35B of equity purchases over the coming week in a flat market. Deutsche Bank marks global CTA positioning at the 83rd percentile, with the Nasdaq-100 at just the 37th. The live threat to that setup is the yen — Treasury Secretary Scott Bessent told an audience in Dallas he has "asymmetric information" and is "the house now," and USD/JPY traded as low as 152.88 today against 164 before the July 31 interventionFT. Today's cross-section does not carry that mechanism: 12-month momentum (Long-Term Momentum in the table) is up +0.72% at z=+1.11 and takes 7.3% of the day's variance, with MTUM +0.62%. The long end is bid into Treasury's 11:00 ET buyback detailFT, the 30-year at 5.248% and down 1.6 bps while the 2-year is firmer at 4.404%CNBC. The Wall Street Journal reported that stronger August payrolls revived pricing for a September hike — which is the tension crude above $100 now feeds into.
Variance decomposition: live intraday — 20260909 session, bracketed against its trailing-year range. Factor returns are trailing through last close. Total cross-sectional dispersion: 5.6%ile of the past year.
Variance mix — % of total, today vs 1d ago vs 1-yr avg
market 52%ile style 34%ile thematic 47%ile idiosyncratic 74%ile
Variance explained — today vs. factor's trailing-year range
Marker = the factor's share of today's total variance, placed in its own trailing-year range (box 25–75%ile, ticks 90%ile and max). Amber marker = unusually load-bearing today (≥90%ile of its own year). Factor name green = up today / red = down.
Correlation & dispersion — realized vs implied
Pairwise realized correlation (20d): 7.26% 2.0%ile since 2020 · 32%ile 3m
Top-500 pairwise: 6.66% 2.0%ile since 2020 · 18%ile 3m · implied (Cboe COR1M): 10.12 4.1%ile of its own history (gap -3.5pp)
Realized 20d vol (ann. pts): all stocks 40 vs VIXEQ 38 · index 9 vs VIX 16 · style factors 19 68%ile
20-day window (19 completed days + today); percentiles vs model history since 2020; '3m' tokens rank vs the trailing 63 trading days; definitions in Terms below. Implied prints (Cboe) are delayed ~15 min. as of 09:58 ET
Top 50 high-beta momentum names (eq-wt, since-2020 rank): +1.3% 67%ile · rest of market -0.7%
| Factor | Today | 1d | 5d | 20d | 60d |
|---|---|---|---|---|---|
| Style-Risk | |||||
| Beta | +0.40% z+0.4 | +1.42% | +4.22% | +0.50% | -4.26% |
| International | +0.06% z+0.2 | -0.04% | +0.22% | +1.27% | +0.44% |
| Residual Volatility | +0.05% z+0.1 | -0.25% | -0.41% | +1.33% | +1.49% |
| Style | |||||
| Dividend Yield | +0.20% z+1.1 | +0.27% | +0.39% | +1.07% | -0.62% |
| Profitability | -0.11% z-0.6 | -0.21% | -0.53% | -0.58% | -2.97% |
| Leverage | +0.08% z+0.5 | +0.31% | +0.57% | +0.07% | -3.04% |
| Size | +0.16% z+0.5 | +0.12% | +0.04% | +0.81% | +0.20% |
| Growth | -0.10% z-0.4 | -0.30% | -0.40% | -0.43% | +2.61% |
| Value | +0.03% z+0.1 | -0.19% | +0.28% | +0.13% | -0.71% |
| Liquidity | +0.03% z+0.1 | +0.34% | +0.81% | +3.08% | +0.82% |
| Style-Momentum | |||||
| Long-Term Momentum | +0.72% z+1.1 | +1.10% | +1.84% | +2.26% | -4.32% |
| Medium-Term Momentum | +0.18% z+0.6 | -0.48% | -0.40% | +0.17% | +0.61% |
| Short-Term Momentum | +0.08% z+0.3 | -0.05% | -0.26% | -2.14% | -7.14% |
| One-Day Momentum | +0.04% z+0.2 | +0.12% | -0.35% | -1.61% | -0.68% |
| Style-Positioning | |||||
| Short Interest | -0.06% z-0.4 | -0.22% | -0.56% | -0.51% | +0.58% |
| Hedge-Fund Ownership | -0.03% z-0.3 | +0.01% | -0.11% | +0.23% | +1.17% |
| Style-Flow | |||||
| Morning Activity | +0.10% z+0.8 | +0.12% | +0.24% | +1.41% | +2.08% |
| Short-Sale Activity | -0.05% z-0.5 | -0.07% | +0.23% | +0.48% | +0.46% |
| Thematic | |||||
| Oil | +0.59% z+1.2 | +0.79% | +1.05% | +3.99% | +3.11% |
| Semiconductors | +0.46% z+0.8 | +1.30% | +2.18% | +1.43% | -5.22% |
| Gold | +0.22% z+0.7 | -0.01% | +0.62% | +3.04% | +4.35% |
| China | -0.20% z-0.5 | -0.18% | -0.70% | -0.48% | -0.29% |
| Treasury (Duration) | +0.07% z+0.2 | -0.25% | -0.26% | -1.21% | -0.48% |
| Bitcoin / Crypto | +0.02% z+0.1 | -0.11% | -0.03% | +2.44% | +1.68% |
5/20/60d windows include today's session; 1d is the previous session.
Pairwise realized correlation. Index variance net of the weighted idiosyncratic diagonal, over the cross terms — the estimator used for implied-correlation indices. 20-day window unless noted; history since 2020.
Factor z-score. Today's factor return divided by its daily-return standard deviation over ~1,600 trading days.
Stock-specific (idiosyncratic) return. The part of a stock's move not explained by market, style, or thematic factors in our decomposition.
VIXEQ / DSPX / COR1M. Cboe implied indices: single-stock volatility, dispersion, and 1-month implied correlation (top-50 S&P names). Quotes delayed ~15 minutes.
Data compiled by FactorPulse AI; edited and verified by Jeff Klein. For informational purposes only. Does not constitute financial advice, an investment recommendation, or an offer to buy or sell any securities. Always consult a qualified financial professional before making investment decisions.
For more on factor construction methodology, see www.factorpulse.com/glossary.