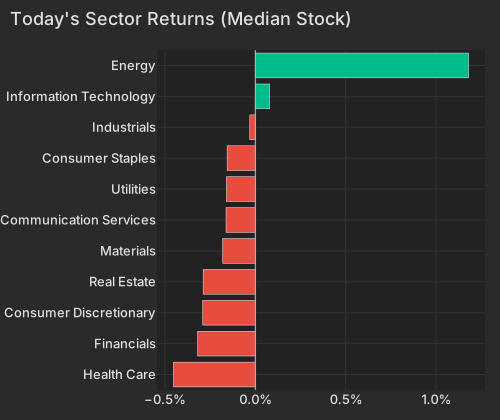
Novartis' HARBOR miss is being priced as a verdict on a modality, not on one asset. The ADR is -12.90% pre-market and the read-through has taken Dyne -27.15% and Ionis -10.59% with it, while Roivant is +20.47% on its own Phase 2 win. Energy's median stock is +1.18% against Health Care's -0.43% — the whole session so far is drug data and crude, with almost nothing coming from the index.
Novartis said in a media release that the Phase III HARBOR study of del-desiran in myotonic dystrophy type 1 failed to meet its primary endpoint of video hand-opening time. The ADR is -12.90% pre-market, $38.5 billion of market capitalisation gone, and the asset came out of the company's $12 billion Avidity Biosciences acquisition. It is the third Phase III setback the company has put out inside a week, following pelacarsen's failure to reduce major adverse cardiac events in Lp(a)HORIZON, reported September 4–7.
The partners are worse. Dyne Therapeutics is -27.15% with no trial of its own today — its antibody-oligonucleotide platform is being marked down by association. Ionis is -10.59%, with up to $650 million of pelacarsen milestone payments now in question. Amgen is -5.88% on the Lp(a) read-across and a BMO downgrade to Market Perform, and Royalty Pharma is -7.49%. The one large offset runs the other way: Roivant is +20.47%, adding $5.2 billion, after subsidiary Pulmovant's PHocus study showed a 56.3% placebo-adjusted reduction in pulmonary vascular resistance.
| Factor | Return | Z-Score | 5d Z | 20d Z | 63d Z | Category | Direction |
|---|---|---|---|---|---|---|---|
| Semiconductors | +0.48% | z=+0.8 | z=+1.2 | z=+0.2 | z=-1.1 | Thematic | Chip-exposed names outperformed |
| One-Day Momentum | +0.21% | z=+0.7 | z=-0.1 | z=-1.1 | z=-0.6 | Style-Momentum | Yesterday's gainers kept outperforming |
| Oil | +0.33% | z=+0.7 | z=+0.4 | z=+1.3 | z=+0.2 | Thematic | Oil-exposed names outperformed |
| Long-Term Momentum | +0.38% | z=+0.6 | +0.7 | +0.2 | -0.9 | Style-Momentum | 12-month winners outperformed |
| Beta | +0.42% | z=+0.4 | z=+0.7 | z=-0.1 | z=-0.7 | Style-Risk | Market-sensitive names outperformed |
| Short Interest | -0.07% | z=-0.4 | z=-0.7 | z=-0.5 | z=+0.6 | Style-Positioning | Most-shorted names underperformed |
| Short-Term Momentum | -0.05% | z=-0.2 | z=-0.9 | z=-1.5 | z=-2.7 | Style-Momentum | Last week's leaders reverted |
| Residual Volatility | -0.09% | z=-0.2 | z=-0.4 | z=+0.7 | z=-0.1 | Style-Risk | Flat — not a driver today |
The bundle's own framing of a broad biotechnology sell-off does not survive contact with the ETF row: XBI is -0.93% and still +27.31% over the trailing 63 sessions, and XLV is -1.07%. The pain is concentrated in Novartis' own book and the names whose valuations rest on the same oligonucleotide chemistry. Elsewhere risk appetite is intact — Beta paid +0.42%, the top 50 high-beta momentum names are +1.43% against -0.24% for the rest of the universe, and the most heavily shorted names underperformed again at z=-0.4, the model's durable positioning drag doing its usual work.
| Sector | Median Ret Pct |
|---|---|
| Health Care | -0.45 |
| Financials | -0.32 |
| Consumer Discretionary | -0.29 |
| Real Estate | -0.29 |
| Materials | -0.18 |
| Communication Services | -0.16 |
| Utilities | -0.16 |
| Consumer Staples | -0.16 |
| Industrials | -0.03 |
| Information Technology | 0.08 |
| Energy | 1.18 |
This is why a $38 billion single-name event barely registers above the sector level. Over the blended 20-day window, the market leg accounts for 5.3% of cross-sectional variance, the 2.5th percentile since 2020, with realized pairwise correlation at 6.84% (1.4th percentile). The options market is priced for the same thing: implied one-month single-stock correlation (Cboe COR1M) sits at 8.6, the 2.2nd percentile of its own 20-year history. Damage this size stays local when nothing is transmitting it.
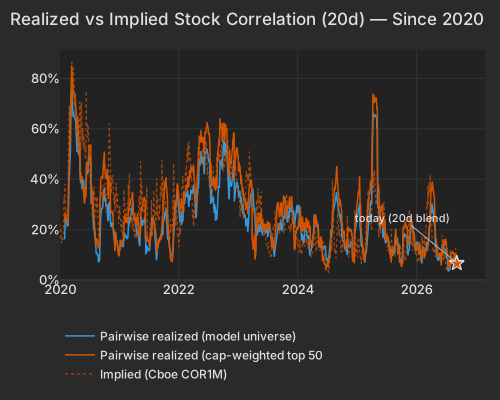
| Series | Today Pct | Prev Close Pct |
|---|---|---|
| pairwise_model | 6.84 | 6.61 |
| pairwise_top500 | 6.50 | 6.76 |
| implied_cor1m |
WTI crude is $93.82 as of 7:30 AM ET, up +2.56%CNBC, with Brent closing in on $100 after reported strikes on Saudi energy sitesBloomberg. The Oil factor is +0.33% at z=+0.7, and on the slower clock at z=+1.3 over 20 days; its 2.6% share of cross-sectional variance is the top decile of the past year, making it the most load-bearing thematic axis on the board. Energy's median stock is +1.18%, with Shell +2.22% and Exxon +1.26%. The same move ended a four-day run in emerging-market assets as oil importers were marked downBloomberg.
What is missing is the hard-asset bid that usually rides alongside a supply scare. Gold spot is unchanged at $4,404.52 as of 7:40 AM ETCNBC, GLD is -0.73% and the Gold factor is -0.12%. The bid is going into the barrel and into rates instead: the 10-Year Treasury yield is 4.80% and the 30-Year 5.27%, each up 2 bpsCNBC, with the belly and long end moving together and TLT -0.28%. The dollar index is easing at 98.93, -0.25%CNBC.
| ETF | Theme | Today | 1d Ago | 5d Ago | 20d Ago | 63d Ago |
|---|---|---|---|---|---|---|
| USO | oil | +2.74% | -0.09% | +9.45% | +20.33% | +6.72% |
| DRAM | memory chips & storage | +1.98% | +6.61% | +6.91% | +17.96% | +6.99% |
| XOP | oil & gas E&P | +1.43% | -0.84% | +2.57% | +14.61% | +14.89% |
| XLE | energy | +1.09% | -0.87% | +2.20% | +11.41% | +11.08% |
| SMH | semiconductors | +0.94% | +2.61% | +2.51% | -2.69% | -0.47% |
| SPY | large cap | -0.32% | -0.39% | +0.11% | -0.40% | +4.43% |
| XBI | biotech growth | -0.93% | -0.35% | +0.88% | +4.09% | +27.31% |
| XLV | healthcare | -1.07% | -1.04% | +0.17% | +3.48% | +12.05% |
| KWEB | china internet | -1.73% | +2.00% | -1.03% | -9.11% | -1.25% |
| FXI | china large cap | -2.02% | +1.53% | +1.04% | -0.80% | +3.25% |
Beneath the day's headlines sits the structural signal a PM should be pricing: Short-Term Momentum has returned -6.53% over the completed 63-day window through the prior close, the bottom 1.6% of overlapping windows since 2020 at z=-2.7. Today it is doing nothing — -0.05% at z=-0.2 — so this is a run neither extending nor breaking. The one-day lookback points the other way, with yesterday's gainers continuing to outperform at z=+0.7. Continuation over a day and reversion over a week, held together for months, is the fingerprint of a market that keeps repricing each fresh mover and then taking it back.
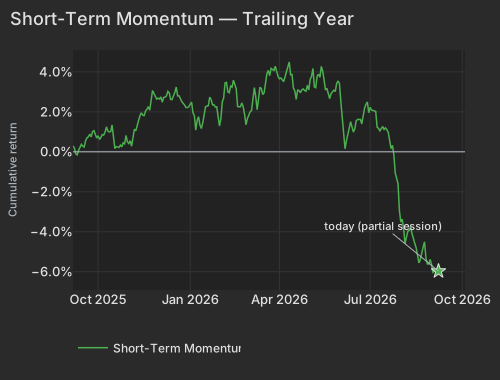
| Date | Cumret Pct |
|---|---|
| 2025-09-05 | 0.30 |
| 2025-09-09 | -0.11 |
| 2025-09-12 | 0.21 |
| 2025-09-16 | 0.28 |
| 2025-09-19 | 0.70 |
| 2025-09-23 | 0.88 |
| 2025-09-26 | 1.06 |
| 2025-09-30 | 0.69 |
| 2025-10-03 | 0.72 |
| 2025-10-07 | 0.84 |
| 2025-10-10 | 1.04 |
| 2025-10-14 | 1.01 |
| 2025-10-17 | 0.16 |
| 2025-10-21 | 0.22 |
| 2025-10-24 | 0.25 |
| 2025-10-28 | 0.40 |
| 2025-10-31 | 0.41 |
| 2025-11-05 | 0.82 |
| 2025-11-07 | 1.05 |
| 2025-11-12 | 1.81 |
| 2025-11-14 | 1.83 |
| 2025-11-19 | 2.13 |
| 2025-11-21 | 2.08 |
| 2025-11-26 | 2.92 |
| 2025-12-01 | 2.69 |
| 2025-12-04 | 2.49 |
| 2025-12-08 | 2.73 |
| 2025-12-11 | 2.95 |
| 2025-12-15 | 2.61 |
| 2025-12-18 | 3.24 |
| 2025-12-22 | 2.80 |
| 2025-12-26 | 2.34 |
| 2025-12-30 | 2.22 |
| 2026-01-05 | 1.95 |
| 2026-01-08 | 1.56 |
| 2026-01-12 | 1.33 |
| 2026-01-15 | 1.85 |
| 2026-01-20 | 2.31 |
| 2026-01-23 | 2.35 |
| 2026-01-27 | 2.24 |
| 2026-01-30 | 1.29 |
| 2026-02-03 | 2.49 |
| 2026-02-06 | 3.47 |
| 2026-02-10 | 2.96 |
| 2026-02-13 | 3.58 |
| 2026-02-18 | 2.26 |
| 2026-02-23 | 2.45 |
| 2026-02-25 | 1.88 |
| 2026-03-02 | 1.85 |
| 2026-03-04 | 2.07 |
| 2026-03-09 | 2.75 |
| 2026-03-12 | 3.23 |
| 2026-03-16 | 2.87 |
| 2026-03-19 | 3.90 |
| 2026-03-23 | 3.81 |
| 2026-03-26 | 4.07 |
| 2026-03-30 | 4.01 |
| 2026-04-02 | 3.69 |
| 2026-04-07 | 3.74 |
| 2026-04-10 | 4.49 |
| 2026-04-14 | 3.87 |
| 2026-04-17 | 2.62 |
| 2026-04-21 | 3.07 |
| 2026-04-24 | 3.15 |
| 2026-04-28 | 3.03 |
| 2026-05-01 | 3.62 |
| 2026-05-05 | 4.17 |
| 2026-05-08 | 3.78 |
| 2026-05-13 | 4.28 |
| 2026-05-15 | 3.59 |
| 2026-05-20 | 2.96 |
| 2026-05-22 | 2.91 |
| 2026-05-28 | 3.42 |
| 2026-06-01 | 3.41 |
| 2026-06-04 | 1.09 |
| 2026-06-08 | 0.55 |
| 2026-06-11 | 1.51 |
| 2026-06-15 | 0.99 |
| 2026-06-18 | 1.62 |
| 2026-06-23 | 1.40 |
| 2026-06-26 | 2.38 |
| 2026-06-30 | 1.95 |
| 2026-07-06 | 2.04 |
| 2026-07-08 | 1.23 |
| 2026-07-13 | 1.19 |
| 2026-07-16 | 1.20 |
| 2026-07-20 | 0.97 |
| 2026-07-23 | 0.32 |
| 2026-07-27 | -1.07 |
| 2026-07-30 | -2.96 |
| 2026-08-03 | -3.37 |
| 2026-08-06 | -4.32 |
| 2026-08-10 | -3.94 |
| 2026-08-13 | -4.40 |
| 2026-08-17 | -4.81 |
| 2026-08-20 | -5.38 |
| 2026-08-24 | -4.77 |
| 2026-08-27 | -5.61 |
| 2026-08-31 | -5.39 |
| 2026-09-03 | -5.99 |
| 2026-09-08 | -5.97 |
Single-stock volatility is what makes that persist: implied single-stock volatility (Cboe VIXEQ) is 35.8, the 72nd percentile of its own history, while implied index volatility (VIX) is 15.79 and sits at the top of a narrow 20-session range of 14.25–16.34. Names are moving; the index is not.
The memory-chip bid from OpenAI's Astra deployment is still working two sessions on, with DRAM +1.98% and the Semiconductors factor +0.48% at z=+0.8 and z=+1.2 over five daysWSJ. Micron +1.40% and Sandisk +1.24% are being carried by the day's beta and 12-month-winner complex rather than by anything of their own. Against that, Baidu is -7.60% after China's Supreme People's Court published a 24-article opinion putting platforms on the hook for deepfakes and AI-generated falsehoodsNYT, which took KWEB -1.73% and FXI -2.02% with it.
Oracle is +4.93% pre-market and adding $23.2 billion of market value ahead of results on Thursday after the close.
The New York Fed's Survey of Consumer Expectations is due at 11:00 AM ET, with consensus looking for one-year inflation expectations to edge up to roughly 3.63% from July's 3.6%. The risk the desk cares about is energy extrapolation — gasoline at these crude prices unanchoring the short horizon and bleeding into longer ones — with CME FedWatch pricing a September 15–16 hike near 60%.
Variance decomposition: live intraday — 20260908 session, bracketed against its trailing-year range. Factor returns are trailing through last close. Total cross-sectional dispersion: 2.4%ile of the past year.
Variance mix — % of total, today vs 1d ago vs 1-yr avg
market 16%ile style 34%ile thematic 77%ile idiosyncratic 82%ile
Variance explained — today vs. factor's trailing-year range
Marker = the factor's share of today's total variance, placed in its own trailing-year range (box 25–75%ile, ticks 90%ile and max). Amber marker = unusually load-bearing today (≥90%ile of its own year). Factor name green = up today / red = down.
Correlation & dispersion — realized vs implied
Pairwise realized correlation (20d): 6.84% 1.4%ile since 2020 · 30%ile 3m
Top-500 pairwise: 6.50% 1.8%ile since 2020 · 13%ile 3m · implied (Cboe COR1M): 8.60 2.2%ile of its own history (gap -2.1pp)
Realized 20d vol (ann. pts): all stocks 39 vs VIXEQ 36 · index 9 vs VIX 16 · style factors 18 65%ile
20-day window (19 completed days + today); percentiles vs model history since 2020; '3m' tokens rank vs the trailing 63 trading days; definitions in Terms below. Implied prints (Cboe) are delayed ~15 min. as of 07:21 ET
Top 50 high-beta momentum names (eq-wt, since-2020 rank): +1.4% 68%ile · rest of market -0.2%
| Factor | Today | 1d | 5d | 20d | 60d |
|---|---|---|---|---|---|
| Style-Risk | |||||
| Beta | +0.42% z+0.4 | +1.48% | +1.48% | -0.44% | -5.36% |
| Residual Volatility | -0.09% z-0.2 | -0.38% | -0.45% | +1.46% | +1.21% |
| International | +0.01% z+0.0 | -0.04% | +0.57% | +1.03% | +0.48% |
| Style | |||||
| Profitability | +0.07% z+0.4 | +0.27% | -0.16% | -0.23% | -2.50% |
| Leverage | +0.06% z+0.4 | +0.25% | +0.35% | -0.04% | -3.31% |
| Liquidity | +0.10% z+0.3 | +0.41% | +0.85% | +2.96% | +0.32% |
| Dividend Yield | +0.05% z+0.3 | +0.06% | +0.04% | +0.84% | -0.84% |
| Size | -0.08% z-0.2 | -0.21% | -0.03% | +0.08% | -0.21% |
| Value | -0.02% z-0.1 | +0.22% | +0.55% | +0.50% | -0.45% |
| Growth | -0.01% z-0.0 | -0.02% | -0.04% | -0.15% | +2.65% |
| Style-Momentum | |||||
| One-Day Momentum | +0.21% z+0.7 | -0.41% | -0.09% | -1.41% | -0.82% |
| Long-Term Momentum | +0.38% z+0.6 | +0.62% | +0.98% | +0.63% | -5.24% |
| Medium-Term Momentum | -0.06% z-0.2 | -0.78% | -0.62% | +0.29% | +0.51% |
| Short-Term Momentum | -0.05% z-0.2 | +0.06% | -0.59% | -2.04% | -7.48% |
| Style-Positioning | |||||
| Short Interest | -0.07% z-0.4 | -0.23% | -0.27% | -0.41% | +0.84% |
| Hedge-Fund Ownership | -0.04% z-0.4 | +0.07% | -0.18% | +0.19% | +1.23% |
| Style-Flow | |||||
| Morning Activity | -0.01% z-0.1 | -0.13% | +0.16% | +1.15% | +1.79% |
| Short-Sale Activity | +0.00% z+0.0 | -0.09% | +0.38% | +0.73% | +0.54% |
| Thematic | |||||
| Semiconductors | +0.48% z+0.8 | +1.26% | +1.64% | +0.58% | -6.02% |
| Oil | +0.33% z+0.7 | -0.07% | +0.41% | +2.81% | +2.23% |
| Gold | -0.12% z-0.4 | -0.52% | +0.13% | +2.68% | +4.13% |
| Treasury (Duration) | +0.08% z+0.2 | +0.08% | +0.22% | -0.82% | -0.29% |
| Bitcoin / Crypto | +0.04% z+0.1 | -0.38% | -0.06% | +2.31% | +1.69% |
| China | +0.05% z+0.1 | +0.07% | -0.12% | -0.05% | +0.12% |
5/20/60d windows include today's session; 1d is the previous session.
Pairwise realized correlation. Index variance net of the weighted idiosyncratic diagonal, over the cross terms — the estimator used for implied-correlation indices. 20-day window unless noted; history since 2020.
Market variance share. The fraction of cross-sectional variance explained by the market factor — the attribution companion to pairwise correlation, not a substitute for it.
Factor z-score. Today's factor return divided by its daily-return standard deviation over ~1,600 trading days.
High-beta momentum cohort. US names above $2B market cap in the top quintile of both raw beta and 12-month momentum; membership frozen at each month's first business day. “Top 50” = the 50 strongest by combined rank.
VIXEQ / DSPX / COR1M. Cboe implied indices: single-stock volatility, dispersion, and 1-month implied correlation (top-50 S&P names). Quotes delayed ~15 minutes.
Data compiled by FactorPulse AI; edited and verified by Jeff Klein. For informational purposes only. Does not constitute financial advice, an investment recommendation, or an offer to buy or sell any securities. Always consult a qualified financial professional before making investment decisions.
For more on factor construction methodology, see www.factorpulse.com/glossary.