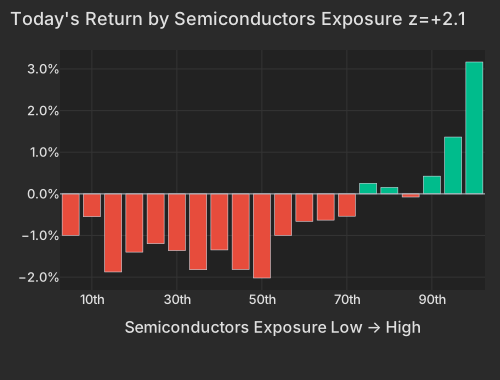
The Dow shed 628 points and the market factor barely participated — the index leg explained 4.31% of cross-sectional variance today against a 9.31% one-year average. Two named shocks did the damage: a Novartis clinical setback that erased $41.13B from the stock, and WTI crude at $93.98, up +2.73%, after strikes halted Saudi Aramco's Jazan refinery. Underneath both, Semiconductors returned +1.28% at z=+2.1 and Beta paid +1.43%.
Strip the two shocks out and the session was a risk-appetite day. Beta took 14.9% of the day's cross-sectional variance, the largest single style axis, and the names carrying it were carried by the factor rather than by their own stories: AXT rose +12.93%, MaxLinear +9.01% and Lumentum +10.97%, with almost none of it company-specific. Thematic variance ran at 10.7 vol points, the 96th percentile since 2020 — oil and semiconductors, the two axes the cross-section reorganized around.
| Factor | Return | Z-Score | 5d Z | 20d Z | 63d Z | Category | Direction |
|---|---|---|---|---|---|---|---|
| Semiconductors | +1.28% | z=+2.1 | +1.8 | +0.5 | -1.0 | Thematic | High-exposure names outperformed |
| Leverage | +0.31% | z=+1.9 | +1.6 | +0.3 | -2.1 | Style | More-levered names outperformed |
| Long-Term Momentum | +1.08% | z=+1.7 | +1.2 | +0.5 | -0.7 | Style-Momentum | 1-year winners outperformed |
| Medium-Term Momentum | -0.48% | z=-1.7 | -1.6 | -0.1 | -0.1 | Style-Momentum | 20-day winners underperformed |
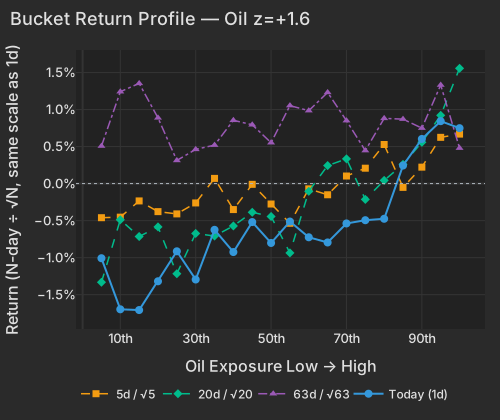
| Oil | +0.77% | z=+1.6 | +0.8 | +1.5 | +0.3 | Thematic | Oil-exposed names outperformed |
| Short Interest | -0.27% | z=-1.6 | -1.2 | -0.8 | +0.4 | Style-Positioning | Most-shorted names underperformed |
| Dividend Yield | +0.28% | z=+1.6 | +0.7 | +1.4 | -0.4 | Style | High-yield names outperformed |
| Beta | +1.43% | z=+1.5 | +1.2 | +0.1 | -0.5 | Style-Risk | High-beta names outperformed |
| Bucket | Avg Ret Pct |
|---|---|
| 1 | -1.00 |
| 2 | -0.55 |
| 3 | -1.88 |
| 4 | -1.40 |
| 5 | -1.20 |
| 6 | -1.36 |
| 7 | -1.82 |
| 8 | -1.35 |
| 9 | -1.82 |
| 10 | -2.02 |
| 11 | -1.00 |
| 12 | -0.66 |
| 13 | -0.63 |
| 14 | -0.54 |
| 15 | 0.25 |
| 16 | 0.15 |
| 17 | -0.08 |
| 18 | 0.43 |
| 19 | 1.36 |
| 20 | 3.17 |
Novartis closed -13.84% after a clinical setback that cast doubt on the cholesterol-drug race, and Amgen closed -10.13%, giving up $23.43BWSJ. The read-through ran down the pipeline peers — Dyne Therapeutics -15.70%, Structure Therapeutics -14.63% — and XLV fell -2.44%, roughly a fifth of the sector's +12.05% 63-day gain in one session.
Idiosyncratic variance took 63.5% of the cross-section today, and Howmet Aerospace is the other side of that: it closed -11.16%, shedding $12.28B with essentially no factor content in the move. The market is repricing Howmet on its own; the driver has not yet reached the coverage in front of us. ServiceTitan closed the regular session -7.22% and fell a further -13.96% in late trading after posting fiscal second-quarter revenue of $292.8 million against third-quarter guidance below consensus, per the company's own results release.
A U.S. projectile struck an Iranian tanker four miles off Kharg Island, and Houthi drone and missile salvos halted Saudi Aramco's 400,000-barrel-a-day Jazan refinery while injuring 73 peopleBloomberg. Brent touched an intraday $99.04 before hovering near $97.73 by 4:00 PM ETBloomberg. The Oil factor's +0.77% ranks in the 98.9th percentile since 2020 — but USO is +20.33% over 20 sessions and the factor's 20-day z is +1.5, so this is the newest blow on a trade that has been paying for a month, not a fresh one.
| Bucket | Ret 1D Pct | Ret 5D Norm Pct | Ret 20D Norm Pct | Ret 63D Norm Pct |
|---|---|---|---|---|
| 1 | -1.01 | -0.46 | -1.33 | 0.51 |
| 2 | -1.70 | -0.45 | -0.49 | 1.24 |
| 3 | -1.71 | -0.23 | -0.71 | 1.35 |
| 4 | -1.32 | -0.38 | -0.58 | 0.89 |
| 5 | -0.91 | -0.41 | -1.22 | 0.31 |
| 6 | -1.30 | -0.26 | -0.67 | 0.46 |
| 7 | -0.62 | 0.07 | -0.71 | 0.52 |
| 8 | -0.92 | -0.35 | -0.57 | 0.85 |
| 9 | -0.52 | -0.01 | -0.39 | 0.79 |
| 10 | -0.80 | -0.28 | -0.44 | 0.55 |
| 11 | -0.51 | -0.54 | -0.94 | 1.05 |
| 12 | -0.73 | -0.07 | -0.10 | 0.98 |
| 13 | -0.80 | -0.15 | 0.24 | 1.23 |
| 14 | -0.54 | 0.10 | 0.33 | 0.85 |
| 15 | -0.49 | 0.21 | -0.21 | 0.45 |
| 16 | -0.48 | 0.53 | 0.04 | 0.88 |
| 17 | 0.24 | -0.05 | 0.26 | 0.87 |
| 18 | 0.60 | 0.22 | 0.56 | 0.75 |
| 19 | 0.84 | 0.62 | 0.92 | 1.33 |
| 20 | 0.75 | 0.67 | 1.56 | 0.48 |
The curve took the inflation risk at the front, not the back: the 2-year at 4.396% and the 3-year at 4.47% each rose about 2 basis points while the 30-year at 5.245% was unchangedCNBC. That is near-term policy risk being priced, not a term-premium event — and CVC Marathon's Bruce Richards argued equities can absorb a 25 basis-point increaseBloomberg.
The other bid was for the electricity behind the models. NextEra and the DOE closed a $1.9 billion loan to restart the Duane Arnold nuclear plant in Iowa for AI-driven load growthWSJ, and FuelCell Energy closed +18.57% after reporting before the open. Bitcoin miners went with them: WGMI rose +5.35% while bitcoin sat at $78,576, -0.92% at 4:15 PM ETCNBC, after a $320 million hack of a blockchain used by several exchangesBloomberg — those names are being paid for gigawatt-scale power assets, not for the coin. On the chip side, DRAM's +17.96% over 20 sessions is the memory trade GPT-6 Astra reignited last week still runningWSJ.
| ETF | Theme | Today | 1d Ago | 5d Ago | 20d Ago | 63d Ago |
|---|---|---|---|---|---|---|
| WGMI | crypto miners | +5.35% | +3.15% | +11.19% | -1.90% | -22.91% |
| URA | uranium | +3.22% | +0.79% | +1.08% | +2.56% | +1.66% |
| NLR | nuclear power | +3.15% | +0.64% | +1.55% | +1.81% | -1.77% |
| USO | oil | +2.97% | -0.09% | +9.45% | +20.33% | +6.72% |
| DRAM | memory chips & storage | +2.31% | +6.61% | +6.91% | +17.96% | +6.99% |
| SMH | semiconductors | +1.29% | +2.61% | +2.51% | -2.69% | -0.47% |
| XLF | financials | -1.29% | -0.79% | -0.00% | +0.87% | +11.09% |
| KWEB | china | -2.40% | +2.00% | -1.03% | -9.11% | -1.25% |
| XLV | healthcare | -2.44% | -1.04% | +0.17% | +3.48% | +12.05% |
| ITB | homebuilders | -2.98% | +0.31% | -2.59% | -7.15% | +1.09% |
Beta has run -4.35% over the trailing 60 sessions, so today's +1.43% is the second session of a bounce inside a drawdown rather than a new trend. Leverage tells the sharper version: +0.31% at z=+1.9 against a 63-day z of -2.1, a three-month drag reversing — and it came from the bottom bucket falling -1.36%, with Freshworks, First Hawaiian and LiveRamp among the least-levered names sold, not from the levered names ripping. The top 50 high-beta momentum names ran +4.5%, the 94.7th percentile of sessions since 2020, while the group in neither screen fell -1.34%; the buying concentrated hard in the names that most fit that profile. In Friday's session the group's volume ran below the tape's pace.
The breadth says how narrow this is. Small caps fell -0.76%, financials -1.29%, minimum-volatility -1.02%, and 20-day momentum — Medium-Term Momentum in the table — paid -0.48% at z=-1.7, meaning last month's winners were sold while the year's winners took +1.08%. Implied index volatility rose to 15.48 from 14.53. Hedge-Fund Ownership was flat on both the residualized and raw reads, at +0.03% and +0.02%, so none of the day's selling maps to hedge-fund-owned names. The most heavily shorted names underperformed those with little short interest, -0.27% at z=-1.6 — the model's most durable drag paying through a down index.
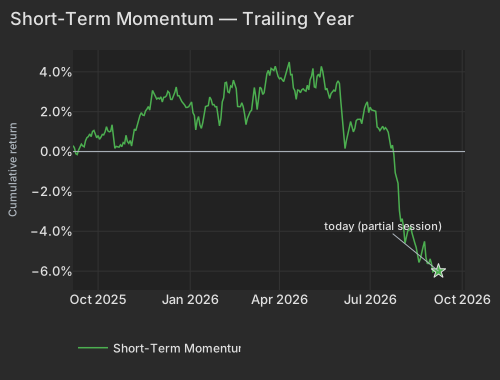
Behind all of it, the fast horizons have been reverting for a quarter: Short-Term Momentum's completed 63-day run through Friday's close is -6.55% at z=-2.7, in the bottom 2% of 63-day windows. Realized 20-day pairwise correlation remains pinned at 6.92%, the bottom 2% since 2020. A 628-point index move is what happens when a handful of large names break in opposite directions and the index leg is this small.
| Date | Cumret Pct |
|---|---|
| 2025-09-05 | 0.30 |
| 2025-09-09 | -0.11 |
| 2025-09-12 | 0.21 |
| 2025-09-16 | 0.28 |
| 2025-09-19 | 0.70 |
| 2025-09-23 | 0.88 |
| 2025-09-26 | 1.06 |
| 2025-09-30 | 0.69 |
| 2025-10-03 | 0.72 |
| 2025-10-07 | 0.84 |
| 2025-10-10 | 1.04 |
| 2025-10-14 | 1.01 |
| 2025-10-17 | 0.16 |
| 2025-10-21 | 0.22 |
| 2025-10-24 | 0.25 |
| 2025-10-28 | 0.40 |
| 2025-10-31 | 0.41 |
| 2025-11-05 | 0.82 |
| 2025-11-07 | 1.05 |
| 2025-11-12 | 1.81 |
| 2025-11-14 | 1.83 |
| 2025-11-19 | 2.13 |
| 2025-11-21 | 2.08 |
| 2025-11-26 | 2.92 |
| 2025-12-01 | 2.69 |
| 2025-12-04 | 2.49 |
| 2025-12-08 | 2.73 |
| 2025-12-11 | 2.95 |
| 2025-12-15 | 2.61 |
| 2025-12-18 | 3.24 |
| 2025-12-22 | 2.80 |
| 2025-12-26 | 2.34 |
| 2025-12-30 | 2.22 |
| 2026-01-05 | 1.95 |
| 2026-01-08 | 1.56 |
| 2026-01-12 | 1.33 |
| 2026-01-15 | 1.85 |
| 2026-01-20 | 2.31 |
| 2026-01-23 | 2.35 |
| 2026-01-27 | 2.24 |
| 2026-01-30 | 1.29 |
| 2026-02-03 | 2.49 |
| 2026-02-06 | 3.47 |
| 2026-02-10 | 2.96 |
| 2026-02-13 | 3.58 |
| 2026-02-18 | 2.26 |
| 2026-02-23 | 2.45 |
| 2026-02-25 | 1.88 |
| 2026-03-02 | 1.85 |
| 2026-03-04 | 2.07 |
| 2026-03-09 | 2.75 |
| 2026-03-12 | 3.23 |
| 2026-03-16 | 2.87 |
| 2026-03-19 | 3.90 |
| 2026-03-23 | 3.81 |
| 2026-03-26 | 4.07 |
| 2026-03-30 | 4.01 |
| 2026-04-02 | 3.69 |
| 2026-04-07 | 3.74 |
| 2026-04-10 | 4.49 |
| 2026-04-14 | 3.87 |
| 2026-04-17 | 2.62 |
| 2026-04-21 | 3.07 |
| 2026-04-24 | 3.15 |
| 2026-04-28 | 3.03 |
| 2026-05-01 | 3.62 |
| 2026-05-05 | 4.17 |
| 2026-05-08 | 3.78 |
| 2026-05-13 | 4.28 |
| 2026-05-15 | 3.59 |
| 2026-05-20 | 2.96 |
| 2026-05-22 | 2.91 |
| 2026-05-28 | 3.42 |
| 2026-06-01 | 3.41 |
| 2026-06-04 | 1.09 |
| 2026-06-08 | 0.55 |
| 2026-06-11 | 1.51 |
| 2026-06-15 | 0.99 |
| 2026-06-18 | 1.62 |
| 2026-06-23 | 1.40 |
| 2026-06-26 | 2.38 |
| 2026-06-30 | 1.95 |
| 2026-07-06 | 2.04 |
| 2026-07-08 | 1.23 |
| 2026-07-13 | 1.19 |
| 2026-07-16 | 1.20 |
| 2026-07-20 | 0.97 |
| 2026-07-23 | 0.32 |
| 2026-07-27 | -1.07 |
| 2026-07-30 | -2.96 |
| 2026-08-03 | -3.37 |
| 2026-08-06 | -4.32 |
| 2026-08-10 | -3.94 |
| 2026-08-13 | -4.40 |
| 2026-08-17 | -4.81 |
| 2026-08-20 | -5.38 |
| 2026-08-24 | -4.77 |
| 2026-08-27 | -5.61 |
| 2026-08-31 | -5.39 |
| 2026-09-03 | -5.99 |
| 2026-09-08 | -6.00 |
The New York Fed's Survey of Consumer Expectations, released at 11:00 AM ET, showed median one-year inflation expectations unchanged at 3.6% and the five-year at 3.0%, with the three-year easing to 3.2%. The labor read was the harder number: 44.4% of respondents expect higher unemployment in a year, the highest share since April 2020, even as reported personal job security stayed high and willingness to quit rose to 19.5%.
Variance decomposition: live intraday — 20260908 session, bracketed against its trailing-year range. Factor returns are trailing through last close. Total cross-sectional dispersion: 67%ile of the past year.
Variance mix — % of total, today vs 1d ago vs 1-yr avg
market 50%ile style 79%ile thematic 87%ile idiosyncratic 28%ile
Variance explained — today vs. factor's trailing-year range
Marker = the factor's share of today's total variance, placed in its own trailing-year range (box 25–75%ile, ticks 90%ile and max). Amber marker = unusually load-bearing today (≥90%ile of its own year). Factor name green = up today / red = down.
Correlation & dispersion — realized vs implied
Pairwise realized correlation (20d): 6.92% 1.5%ile since 2020 · 30%ile 3m
Top-500 pairwise: 6.44% 1.8%ile since 2020 · 13%ile 3m · implied (Cboe COR1M): 9.37 3.1%ile of its own history (gap -2.9pp)
Realized 20d vol (ann. pts): all stocks 40 vs VIXEQ 38 · index 9 vs VIX 15 · style factors 19 67%ile
20-day window (19 completed days + today); percentiles vs model history since 2020; '3m' tokens rank vs the trailing 63 trading days; definitions in Terms below. Implied prints (Cboe) are delayed ~15 min. as of 15:58 ET
Top 50 high-beta momentum names (eq-wt, since-2020 rank): +4.5% 94.7%ile · rest of market -1.3%
| Factor | Today | 1d | 5d | 20d | 60d |
|---|---|---|---|---|---|
| Style-Risk | |||||
| Beta | +1.43% z+1.5 | +1.48% | +2.49% | +0.57% | -4.35% |
| Residual Volatility | -0.24% z-0.5 | -0.38% | -0.60% | +1.31% | +1.06% |
| International | -0.02% z-0.1 | -0.04% | +0.54% | +1.00% | +0.45% |
| Style | |||||
| Leverage | +0.31% z+1.9 | +0.25% | +0.60% | +0.21% | -3.06% |
| Dividend Yield | +0.28% z+1.6 | +0.06% | +0.26% | +1.06% | -0.62% |
| Growth | -0.32% z-1.3 | -0.02% | -0.35% | -0.46% | +2.34% |
| Liquidity | +0.34% z+1.3 | +0.41% | +1.10% | +3.21% | +0.57% |
| Profitability | -0.22% z-1.1 | +0.27% | -0.45% | -0.52% | -2.79% |
| Value | -0.17% z-0.7 | +0.22% | +0.40% | +0.34% | -0.61% |
| Size | +0.12% z+0.3 | -0.21% | +0.16% | +0.27% | -0.02% |
| Style-Momentum | |||||
| Medium-Term Momentum | -0.48% z-1.7 | -0.78% | -1.03% | -0.12% | +0.09% |
| Long-Term Momentum | +1.08% z+1.7 | +0.62% | +1.68% | +1.32% | -4.54% |
| One-Day Momentum | +0.13% z+0.5 | -0.41% | -0.17% | -1.49% | -0.90% |
| Short-Term Momentum | -0.08% z-0.3 | +0.06% | -0.61% | -2.07% | -7.51% |
| Style-Positioning | |||||
| Short Interest | -0.27% z-1.6 | -0.23% | -0.46% | -0.60% | +0.65% |
| Hedge-Fund Ownership | +0.03% z+0.3 | +0.07% | -0.11% | +0.26% | +1.30% |
| Style-Flow | |||||
| Morning Activity | +0.14% z+1.1 | -0.13% | +0.30% | +1.29% | +1.93% |
| Short-Sale Activity | -0.04% z-0.4 | -0.09% | +0.33% | +0.68% | +0.49% |
| Thematic | |||||
| Semiconductors | +1.28% z+2.1 | +1.26% | +2.45% | +1.39% | -5.22% |
| Oil | +0.77% z+1.6 | -0.07% | +0.86% | +3.26% | +2.68% |
| Treasury (Duration) | -0.22% z-0.7 | +0.08% | -0.08% | -1.12% | -0.59% |
| Bitcoin / Crypto | -0.13% z-0.4 | -0.38% | -0.23% | +2.14% | +1.52% |
| China | -0.17% z-0.4 | +0.07% | -0.33% | -0.26% | -0.09% |
| Gold | +0.01% z+0.0 | -0.52% | +0.25% | +2.81% | +4.26% |
5/20/60d windows include today's session; 1d is the previous session.
Pairwise realized correlation. Index variance net of the weighted idiosyncratic diagonal, over the cross terms — the estimator used for implied-correlation indices. 20-day window unless noted; history since 2020.
Market variance share. The fraction of cross-sectional variance explained by the market factor — the attribution companion to pairwise correlation, not a substitute for it.
Factor z-score. Today's factor return divided by its daily-return standard deviation over ~1,600 trading days.
Conditional importance. A factor's relative share of what a tree-based fit of today's stock returns explains; sums to 100% across factors.
High-beta momentum cohort. US names above $2B market cap in the top quintile of both raw beta and 12-month momentum; membership frozen at each month's first business day. “Top 50” = the 50 strongest by combined rank.
Stock-specific (idiosyncratic) return. The part of a stock's move not explained by market, style, or thematic factors in our decomposition.
Data compiled by FactorPulse AI; edited and verified by Jeff Klein. For informational purposes only. Does not constitute financial advice, an investment recommendation, or an offer to buy or sell any securities. Always consult a qualified financial professional before making investment decisions.
For more on factor construction methodology, see www.factorpulse.com/glossary.