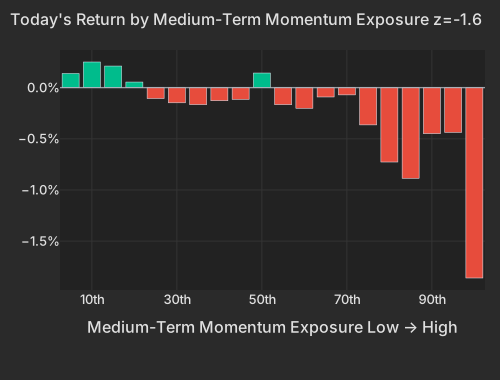
August payrolls at 162,000 against a 53,000 consensus pushed the 2-Year yield up 5.9 basis points, and the equity exposures that led the past month are the ones paying for it. The Gold factor is at -0.51% with z=-1.6 after a month that carried it to z=+2.4, and Bitcoin/Crypto is at -0.32%. The selling is not broad: SMH is up +1.19%, and the damage sorts almost exactly along the list of the past month's best performers.
The Bureau of Labor Statistics put August payrolls at 162,000 with the unemployment rate steady at 4.1%, the strongest monthly gain since March and roughly triple the Dow Jones consensus of 53,000. The curve responded at the front, not the back: the 2-Year yield is at 4.393%, up 5.9 basis points, the 1-Year up 5.5, while the 30-Year sits at 5.244% and has not budged. CNBC The dollar index is at 99.231, up +0.33%. CNBC Spot gold is $4,402.89 at 9:00 AM ET, down -1.56%. CNBC Bitcoin is $79,419 at 9:01 AM ET, off -2.62%. CNBC
| Factor | Return | Z-Score | 5d Z | 20d Z | 63d Z | Category | Direction |
|---|---|---|---|---|---|---|---|
| Gold | -0.51% | -1.6 | +0.7 | +2.4 | +1.3 | Thematic | Gold-exposed names hit |
| Medium-Term Momentum | -0.47% | -1.6 | -0.1 | +0.9 | +0.3 | Style-Momentum | Past month's winners gave back |
| Bitcoin / Crypto | -0.32% | -1.0 | +0.7 | +1.8 | +0.7 | Thematic | Crypto-exposed names hit |
| One-Day Momentum | -0.28% | -1.0 | -0.5 | -1.2 | -0.9 | Style-Momentum | Yesterday's movers reversed |
| Morning Activity | -0.11% | -0.9 | +1.0 | +2.8 | +1.8 | Style-Flow | Morning-heavy names lagged |
| Semiconductors | +0.41% | +0.7 | +0.7 | -0.3 | -1.2 | Thematic | Chip-exposed names bid |
| Beta | +0.17% | +0.2 | -0.0 | -0.8 | -0.7 | Style-Risk | High-beta names slightly ahead |
| Leverage | +0.08% | +0.5 | -0.1 | -1.0 | -2.6 | Style | Levered names steady after a quarter of drag |
The transmission runs through Medium-Term Momentum, which ranks every name on its one-month move stripped of the last week. It is at -0.47% with z=-1.6, and the loss is concentrated at the top of the exposure range: the highest-ranked bucket, the strongest one-month winners, is down 1.9% while the low end is flat. That bucket is a list of specific names — Coeur Mining, Hecla, Fortuna Silver, BitMine — gold and silver producers and crypto-linked balance sheets. The factor is carrying 8.6% of today's cross-sectional variance, a larger share than on any session in the past year, which is the part that matters for a book: the axis the market is sorting on this morning is the one that scored the past month's leaders.
| Bucket | Avg Ret Pct |
|---|---|
| 1 | 0.14 |
| 2 | 0.25 |
| 3 | 0.21 |
| 4 | 0.05 |
| 5 | -0.11 |
| 6 | -0.15 |
| 7 | -0.17 |
| 8 | -0.13 |
| 9 | -0.11 |
| 10 | 0.14 |
| 11 | -0.17 |
| 12 | -0.20 |
| 13 | -0.09 |
| 14 | -0.07 |
| 15 | -0.36 |
| 16 | -0.73 |
| 17 | -0.89 |
| 18 | -0.45 |
| 19 | -0.44 |
| 20 | -1.86 |
The prior-session column is the tell. Gold miners and bitcoin proxies rallied hard into yesterday's close and are handing most of it back before this morning's open; the metals complex is doing it across spot, the trust and the equities at once.
| ETF | Theme | Today | 1d Ago | 5d Ago | 20d Ago | 63d Ago |
|---|---|---|---|---|---|---|
| GDX | gold miners | -3.25% | +3.95% | -2.12% | +20.94% | +17.47% |
| BITO | crypto | -3.09% | +5.87% | +2.13% | +26.55% | +27.28% |
| SLV | silver | -2.58% | +2.51% | -3.54% | +8.42% | -9.60% |
| GLD | gold | -1.73% | +1.85% | -2.93% | +5.27% | -0.26% |
| USO | oil | -1.28% | +0.67% | +9.29% | +19.53% | +3.91% |
| IGV | software | -1.22% | +3.41% | -3.05% | +7.57% | +6.89% |
| DRAM | memory chips | +1.40% | -0.39% | -1.48% | +8.85% | -14.78% |
| SMH | semiconductors | +1.19% | +0.39% | -3.56% | -3.30% | -11.94% |
Inside the equity cross-section the hit is precise rather than wide. The Gold factor's damage is confined to the highest-exposure names: Newmont is down -3.26%, taking $4.67B off its market value, and Materials is the weakest sector by median stock at -1.28%. Nothing in the low-exposure part of the range is moving with them.
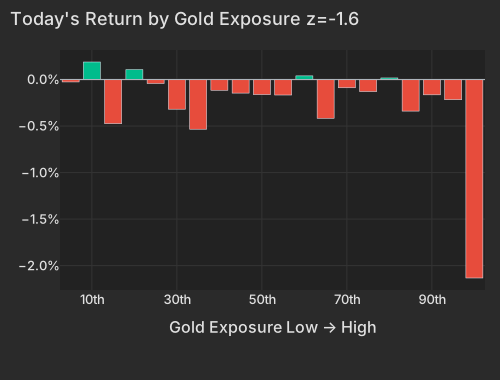
| Bucket | Avg Ret Pct |
|---|---|
| 1 | -0.03 |
| 2 | 0.19 |
| 3 | -0.47 |
| 4 | 0.11 |
| 5 | -0.04 |
| 6 | -0.32 |
| 7 | -0.53 |
| 8 | -0.12 |
| 9 | -0.15 |
| 10 | -0.16 |
| 11 | -0.17 |
| 12 | 0.04 |
| 13 | -0.42 |
| 14 | -0.09 |
| 15 | -0.13 |
| 16 | 0.02 |
| 17 | -0.34 |
| 18 | -0.16 |
| 19 | -0.22 |
| 20 | -2.13 |
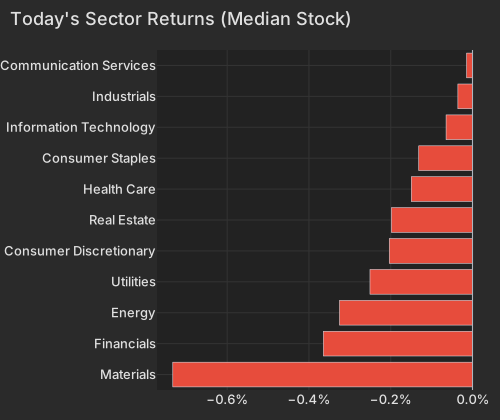
| Sector | Median Ret Pct |
|---|---|
| Materials | -0.73 |
| Financials | -0.36 |
| Energy | -0.33 |
| Utilities | -0.25 |
| Consumer Discretionary | -0.20 |
| Real Estate | -0.20 |
| Health Care | -0.15 |
| Consumer Staples | -0.13 |
| Information Technology | -0.06 |
| Industrials | -0.04 |
| Communication Services | -0.01 |
This is not a general reduction in risk. Semiconductors is the strongest thematic factor at +0.41%, memory-chip names are bid with DRAM up +1.40%, Beta is fractionally positive at +0.17%, and MTUM is up +0.18%. A hawkish labor print that genuinely scared equity risk would not leave the highest-beta part of the market flat and the chip complex leading.
And one session does not retire the trade it interrupted. GDX is still up +20.94% over 20 sessions, the Gold factor's 20-day z-score is +2.4, and Bloomberg reported that the world's largest money managers have been rebuilding gold positions as a hedge against macro risk, with the covered period unstated. Bloomberg The give-back is a day old; the position it sits inside is a month old.
The more durable rates signal is not in gold at all — it is in Leverage, which has sold off -3.58% over the past 60 sessions at z=-2.6 on the 63-day horizon, near the bottom edge of its since-2020 range. Balance-sheet-heavy names have been losing to clean ones for a full quarter while the front of the curve has been grinding higher, and today's 5-to-6 basis point move in the one-to-three-year sector is more of the same pressure on anyone who has to roll debt. The factor is +0.08% this morning, which is noise against that run, not a turn.
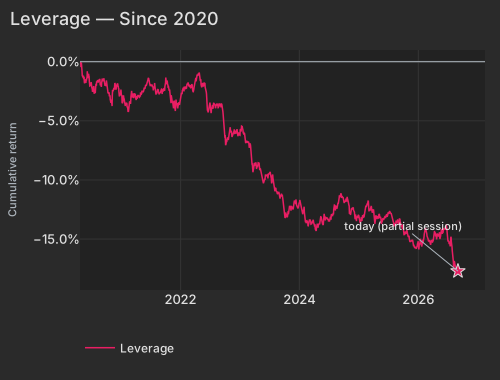
| Date | Cumret Pct |
|---|---|
| 2020-04-23 | -0.09 |
| 2020-05-15 | -1.47 |
| 2020-06-09 | -1.05 |
| 2020-07-01 | -1.72 |
| 2020-07-24 | -2.48 |
| 2020-08-17 | -1.59 |
| 2020-09-09 | -1.65 |
| 2020-10-01 | -2.00 |
| 2020-10-23 | -2.85 |
| 2020-11-16 | -2.37 |
| 2020-12-09 | -1.87 |
| 2021-01-04 | -2.86 |
| 2021-01-27 | -3.75 |
| 2021-02-19 | -3.88 |
| 2021-03-15 | -2.69 |
| 2021-04-07 | -2.90 |
| 2021-04-29 | -2.94 |
| 2021-05-21 | -2.38 |
| 2021-06-15 | -1.57 |
| 2021-07-08 | -2.00 |
| 2021-07-30 | -2.44 |
| 2021-08-23 | -2.71 |
| 2021-09-15 | -2.55 |
| 2021-10-07 | -1.89 |
| 2021-10-29 | -2.91 |
| 2021-11-22 | -3.71 |
| 2021-12-15 | -3.95 |
| 2022-01-07 | -2.63 |
| 2022-02-01 | -2.24 |
| 2022-02-24 | -2.00 |
| 2022-03-18 | -2.48 |
| 2022-04-11 | -1.45 |
| 2022-05-04 | -1.64 |
| 2022-05-26 | -1.90 |
| 2022-06-21 | -4.29 |
| 2022-07-14 | -3.92 |
| 2022-08-05 | -3.93 |
| 2022-08-29 | -3.52 |
| 2022-09-21 | -4.43 |
| 2022-10-13 | -6.80 |
| 2022-11-04 | -5.74 |
| 2022-11-29 | -5.72 |
| 2022-12-21 | -6.30 |
| 2023-01-17 | -5.49 |
| 2023-02-08 | -6.66 |
| 2023-03-03 | -7.00 |
| 2023-03-27 | -9.12 |
| 2023-04-19 | -8.73 |
| 2023-05-11 | -9.27 |
| 2023-06-05 | -9.89 |
| 2023-06-28 | -9.51 |
| 2023-07-21 | -9.55 |
| 2023-08-14 | -10.94 |
| 2023-09-06 | -11.58 |
| 2023-09-28 | -12.38 |
| 2023-10-20 | -13.06 |
| 2023-11-13 | -12.59 |
| 2023-12-06 | -11.82 |
| 2023-12-29 | -12.21 |
| 2024-01-24 | -12.90 |
| 2024-02-15 | -13.56 |
| 2024-03-11 | -13.43 |
| 2024-04-03 | -13.68 |
| 2024-04-25 | -13.83 |
| 2024-05-17 | -13.29 |
| 2024-06-11 | -13.42 |
| 2024-07-05 | -13.52 |
| 2024-07-29 | -12.91 |
| 2024-08-20 | -12.34 |
| 2024-09-12 | -11.34 |
| 2024-10-04 | -11.95 |
| 2024-10-28 | -11.68 |
| 2024-11-19 | -12.42 |
| 2024-12-12 | -13.21 |
| 2025-01-07 | -13.58 |
| 2025-01-31 | -13.03 |
| 2025-02-25 | -11.96 |
| 2025-03-19 | -12.35 |
| 2025-04-10 | -13.49 |
| 2025-05-05 | -13.23 |
| 2025-05-28 | -13.43 |
| 2025-06-20 | -12.90 |
| 2025-07-15 | -12.68 |
| 2025-08-06 | -13.92 |
| 2025-08-28 | -13.48 |
| 2025-09-22 | -13.94 |
| 2025-10-14 | -14.54 |
| 2025-11-05 | -14.80 |
| 2025-11-28 | -15.05 |
| 2025-12-22 | -15.79 |
| 2026-01-15 | -15.19 |
| 2026-02-09 | -14.81 |
| 2026-03-04 | -14.88 |
| 2026-03-26 | -15.14 |
| 2026-04-20 | -14.51 |
| 2026-05-12 | -14.66 |
| 2026-06-04 | -14.48 |
| 2026-06-29 | -14.07 |
| 2026-07-22 | -15.00 |
| 2026-08-13 | -16.87 |
| 2026-09-04 | -17.71 |
One flow tilt is worth flagging for anyone running an international or retail-heavy sleeve: Morning Activity, which sorts names on their habitual trailing-20-day morning trading intensity, has run to z=+2.8 on the 20-day horizon with a completed +1.58% over that window. Those names — the pre-known cohort that skews retail and international — are giving back -0.11% today at z=-0.9, alongside the metals and crypto proxies they overlap with. Toyota's ADR is down -2.22%, off $5.29B of market value.
Away from the macro print, this morning's biggest marks are pure single-name repricings. Lululemon is indicated down -19.68% after cutting its full-year outlook for the second time this year on weak North American comparable sales. WSJ The credit-scoring complex is being marked down as a group — Fair Isaac -16.30%, TransUnion -11.23%, Equifax -10.84% — and the day's entire factor complex accounts for under a point of each of those moves; Seeking Alpha reported Friday morning that FHFA Director Bill Pulte directed Fannie Mae and Freddie Mac to let all lenders use the VantageScore credit-scoring system. Last night's software reporters split hard: Guidewire -15.41% and UiPath -11.29% against Samsara +14.60%, with Asana down -13.11%.
That the largest moves keep landing name by name rather than through the index is the standing condition, not today's news: 20-day realized pairwise correlation remains at 6.82%, in the bottom 1.3% since 2020, and implied one-month single-stock correlation (Cboe COR1M) sits at 9.54, in the lowest 3.4% of its own 20-year history. The payroll print gave the market one common driver this morning; it lasted about as long as the front end took to reprice.
The Employment Situation, released at 8:30 AM ET, showed nonfarm payrolls bls.gov up 162,000 against a 53,000 consensus with the unemployment rate unchanged at 4.1% — the strongest month since March, driven by food services, drinking places and local government education, with the information sector shedding jobs. The immediate reaction was a front-end-led yield move, a firmer dollar and a sharp reversal in gold, silver and crypto-linked equities.
The NY Fed's Global Supply Chain Pressure Index is due at 10:00 AM ET, with consensus at 0.79 for August after the index retreated from its 1.84 peak in April 2026. The New York Fed Staff Nowcast follows at 12:45 PM ET; its last Q3 reading was 2.2% as of August 28, well below the Atlanta Fed's 4.7% GDPNow estimate, and the size of that gap is the thing to watch in the update.
Variance decomposition: live intraday — 20260904 session, bracketed against its trailing-year range. Factor returns are trailing through last close. Total cross-sectional dispersion: 2.0%ile of the past year.
Variance mix — % of total, today vs 1d ago vs 1-yr avg
market 50%ile style 62%ile thematic 53%ile idiosyncratic 49%ile
Variance explained — today vs. factor's trailing-year range
Marker = the factor's share of today's total variance, placed in its own trailing-year range (box 25–75%ile, ticks 90%ile and max). Amber marker = unusually load-bearing today (≥90%ile of its own year). Factor name green = up today / red = down.
Correlation & dispersion — realized vs implied
Pairwise realized correlation (20d): 6.82% 1.3%ile since 2020 · 29%ile 3m
Top-500 pairwise: 6.41% 1.7%ile since 2020 · 13%ile 3m · implied (Cboe COR1M): 9.54 3.4%ile of its own history (gap -3.1pp)
Realized 20d vol (ann. pts): all stocks 39 vs VIXEQ 35 · index 9 vs VIX 14 · style factors 18 64%ile
20-day window (19 completed days + today); percentiles vs model history since 2020; '3m' tokens rank vs the trailing 63 trading days; definitions in Terms below. Implied prints (Cboe) are delayed ~15 min. as of 08:58 ET
Top 50 high-beta momentum names (eq-wt, since-2020 rank): +0.8% 59%ile · rest of market -0.3%
| Factor | Today | 1d | 5d | 20d | 60d |
|---|---|---|---|---|---|
| Style-Risk | |||||
| Residual Volatility | -0.25% z-0.5 | +0.43% | +0.14% | +2.08% | +1.13% |
| International | -0.09% z-0.3 | +0.03% | +0.56% | +1.11% | +0.68% |
| Beta | +0.17% z+0.2 | +0.60% | -0.08% | -3.30% | -3.96% |
| Style | |||||
| Growth | +0.12% z+0.5 | +0.02% | -0.03% | +0.30% | +2.46% |
| Leverage | +0.08% z+0.5 | -0.06% | -0.02% | -0.77% | -3.58% |
| Profitability | +0.06% z+0.3 | -0.29% | -0.55% | -1.03% | -2.45% |
| Liquidity | +0.07% z+0.2 | -0.15% | +0.73% | +2.30% | -0.28% |
| Size | +0.02% z+0.1 | +0.21% | +0.39% | +0.73% | -0.11% |
| Dividend Yield | -0.01% z-0.1 | -0.04% | +0.14% | +0.54% | -0.89% |
| Value | -0.00% z-0.0 | -0.09% | +0.19% | +0.35% | -0.76% |
| Style-Momentum | |||||
| Medium-Term Momentum | -0.47% z-1.6 | +0.31% | -0.05% | +1.14% | +1.10% |
| One-Day Momentum | -0.28% z-1.0 | -0.30% | -0.33% | -1.52% | -1.20% |
| Long-Term Momentum | +0.18% z+0.3 | -0.59% | +0.36% | +0.08% | -4.98% |
| Short-Term Momentum | -0.06% z-0.2 | +0.05% | -0.43% | -2.07% | -7.22% |
| Style-Positioning | |||||
| Short Interest | +0.04% z+0.2 | -0.20% | +0.04% | +0.08% | +1.02% |
| Hedge-Fund Ownership | +0.02% z+0.2 | -0.09% | -0.31% | +0.14% | +0.96% |
| Style-Flow | |||||
| Morning Activity | -0.11% z-0.9 | +0.01% | +0.28% | +1.58% | +1.99% |
| Short-Sale Activity | +0.03% z+0.3 | +0.24% | +0.39% | +0.76% | +0.56% |
| Thematic | |||||
| Gold | -0.51% z-1.6 | +0.62% | +0.48% | +3.43% | +4.21% |
| Bitcoin / Crypto | -0.32% z-1.0 | +0.47% | +0.45% | +2.46% | +1.63% |
| Semiconductors | +0.41% z+0.7 | -0.65% | +0.89% | -0.94% | -6.05% |
| Treasury (Duration) | -0.14% z-0.4 | -0.52% | -0.09% | -1.02% | -0.41% |
| Oil | -0.07% z-0.1 | -0.27% | +0.79% | +3.65% | +1.19% |
| China | +0.05% z+0.1 | -0.11% | -0.30% | -0.11% | -0.30% |
5/20/60d windows include today's session; 1d is the previous session.
Pairwise realized correlation. Index variance net of the weighted idiosyncratic diagonal, over the cross terms — the estimator used for implied-correlation indices. 20-day window unless noted; history since 2020.
Factor z-score. Today's factor return divided by its daily-return standard deviation over ~1,600 trading days.
Conditional importance. A factor's relative share of what a tree-based fit of today's stock returns explains; sums to 100% across factors.
VIXEQ / DSPX / COR1M. Cboe implied indices: single-stock volatility, dispersion, and 1-month implied correlation (top-50 S&P names). Quotes delayed ~15 minutes.
Data compiled by FactorPulse AI; edited and verified by Jeff Klein. For informational purposes only. Does not constitute financial advice, an investment recommendation, or an offer to buy or sell any securities. Always consult a qualified financial professional before making investment decisions.
For more on factor construction methodology, see www.factorpulse.com/glossary.