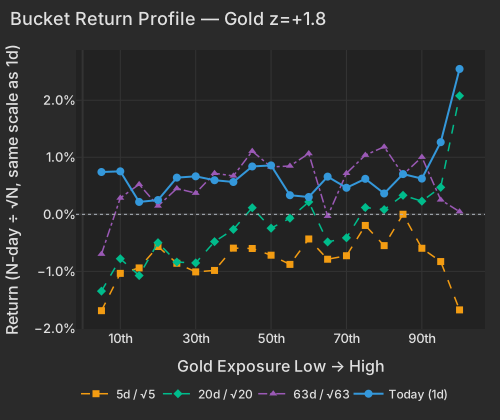
Christopher Waller's signal that he would hold rates in September pulled the front end of the Treasury curve lower and took the dollar with it. The equity response landed in hard assets and speculative growth rather than in duration: Gold ran +0.60% at z=+1.8 on top of a 20-day move already at the 99th percentile since 2020, and Bitcoin / Crypto added +0.48% at z=+1.6. The names carrying the most Treasury duration exposure underperformed the ones carrying the least.
Fed Governor Christopher Waller said he would support holding the federal funds rate steady at the September 15–16 FOMC the Federal Reserve meeting if disinflation continuesFederal Reserve, and the front of the curve took him at his word — the 2-year yield fell 4.4 bps to 4.342% while the 30-year gave up just 1.5 bps to 5.252%CNBC. The dollar index dropped -0.606% to 98.99CNBC, and spot gold rose more than 2% toward $4,474/oz as September hike odds recededThe Wall Street Journal. Inside the cross-section, the dovish turn paid the metal complex and the crypto proxies and shorted the duration trade.
| Factor | Return | Z-Score | 5d Z | 20d Z | 63d Z | Category | Direction |
|---|---|---|---|---|---|---|---|
| Short-Sale Activity | +0.28% | z=+2.6 | +2.5 | +1.4 | +0.3 | Style-Flow | Continuation |
| Gold | +0.60% | z=+1.8 | +0.6 | +3.2 | +1.5 | Thematic | Continuation |
| Bitcoin / Crypto | +0.48% | z=+1.6 | +1.3 | +2.0 | +1.0 | Thematic | Continuation |
| Treasury (Duration) | -0.49% | z=-1.5 | -0.4 | -0.6 | +0.0 | Thematic | Continuation |
| Short Interest | -0.21% | z=-1.3 | -0.1 | +0.2 | +0.8 | Style-Positioning | Counter-trend |
| Hedge-Fund Ownership | -0.12% | z=-1.1 | -1.5 | +0.1 | +1.2 | Style-Positioning | Counter-trend |
| Beta | +0.60% | z=+0.6 | -0.9 | -0.6 | -1.2 | Style-Risk | Counter-trend |
The gold leg did not start this afternoon. Gold's completed 20-day return is +4.60% at z=+3.2 — the 99.2nd percentile of all 20-day windows since 2020 — and the equity expression is running well ahead of the metal: GDX is +16.67% over 20 sessions against GLD's +3.37%, the miners' fixed-cost structure doing exactly what it does when the gold price grinds up. The physical side keeps supplying reasons: De Nederlandsche Bank relocated 86 metric tons from New York and Ottawa to London, citing geopolitical unrest, and GDX booked its heaviest monthly inflows since FebruaryThe Wall Street Journal. Today's cross-section was the miners themselves — the eleven gold miners in the top-exposure bucket averaged +4.51%, with Equinox (EQX), SSR Mining (SSRM) and Eldorado (EGO) at the front.
| Bucket | Ret 1D Pct | Ret 5D Norm Pct | Ret 20D Norm Pct | Ret 63D Norm Pct |
|---|---|---|---|---|
| 1 | 0.74 | -1.69 | -1.35 | -0.70 |
| 2 | 0.75 | -1.04 | -0.78 | 0.29 |
| 3 | 0.22 | -0.94 | -1.07 | 0.53 |
| 4 | 0.25 | -0.56 | -0.50 | 0.15 |
| 5 | 0.64 | -0.86 | -0.84 | 0.45 |
| 6 | 0.67 | -1.01 | -0.85 | 0.37 |
| 7 | 0.60 | -0.98 | -0.48 | 0.72 |
| 8 | 0.57 | -0.59 | -0.26 | 0.67 |
| 9 | 0.84 | -0.60 | 0.12 | 1.11 |
| 10 | 0.86 | -0.72 | -0.24 | 0.83 |
| 11 | 0.34 | -0.88 | -0.07 | 0.85 |
| 12 | 0.30 | -0.43 | 0.22 | 1.07 |
| 13 | 0.66 | -0.79 | -0.48 | -0.03 |
| 14 | 0.47 | -0.73 | -0.41 | 0.72 |
| 15 | 0.62 | -0.20 | 0.12 | 1.04 |
| 16 | 0.37 | -0.55 | 0.08 | 1.18 |
| 17 | 0.71 | 0.00 | 0.33 | 0.70 |
| 18 | 0.63 | -0.60 | 0.23 | 1.00 |
| 19 | 1.26 | -0.83 | 0.47 | 0.25 |
| 20 | 2.55 | -1.68 | 2.08 | 0.05 |
The five-day frame argues the other way. GDX is -4.68% over five sessions and Gold's five-day z is only +0.57 — the 20-day extreme was set before this week, and today restarts a move that had stalled.
Treasury (Duration) at z=-1.5 is the residual that a duration-relief narrative cannot absorb: the factor carried 22.8% of conditional importance and its variance printed at the 97th percentile of its own history, so this is the axis the cross-section was loading on, and it went the wrong way. The mechanism is in the curve. Waller's comments repriced the September meeting, not the term structure — the 10-year eased only 2.2 bps to 4.772%CNBC — and long-duration equity lives at the long end. JPMorgan analysts said Thursday that the rise in the ten-year yield is increasingly term-premium driven rather than policy driven, which is the same point from the rates side. So TLT managed +0.14%, utilities +0.72% and real estate +1.20%, while the bottom-exposure bucket rose +1.80% on speculative AI- and defense-linked small caps — the two defense names in that bucket averaged +3.65%. Beta's +0.60% at z=+0.62 is a one-day dent in a factor still -6.03% over 60 days.
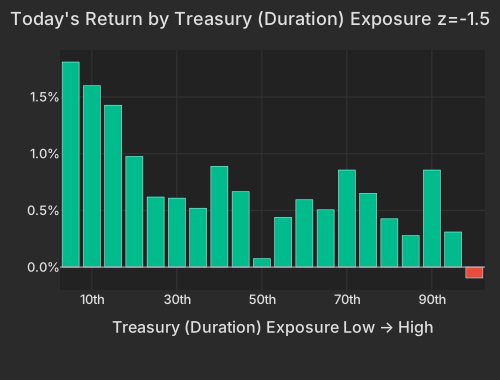
| Bucket | Avg Ret Pct |
|---|---|
| 1 | 1.81 |
| 2 | 1.60 |
| 3 | 1.43 |
| 4 | 0.98 |
| 5 | 0.62 |
| 6 | 0.61 |
| 7 | 0.52 |
| 8 | 0.89 |
| 9 | 0.67 |
| 10 | 0.07 |
| 11 | 0.44 |
| 12 | 0.59 |
| 13 | 0.51 |
| 14 | 0.86 |
| 15 | 0.65 |
| 16 | 0.43 |
| 17 | 0.28 |
| 18 | 0.86 |
| 19 | 0.31 |
| 20 | -0.10 |
Bitcoin / Crypto at z=+1.6 extends a 20-day z=+2.0, and the token moved with it — Bitcoin traded near $81,500 late in the session, back above $80,000 from roughly $77,900 this morning, even as U.S. spot ETF flows had turned choppy after two sessions of sizable outflowsBloomberg. The equities repriced harder: Strategy (MSTR) +16.82% with roughly a third of that carried by the factor complex rather than its own story, Coinbase (COIN) +9.70%, and Robinhood (HOOD) closing the session +16.63%. BITO rose +5.53% and the miners in WGMI +8.77%, a number that still leaves that fund -39.84% over 63 sessions. Hargreaves Lansdown's listing of nine crypto ETNs opened access to two million UK clientsFinancial Times — a distribution change that outlives today's print.
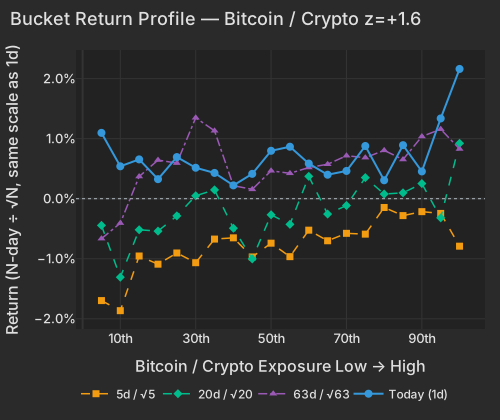
| Bucket | Ret 1D Pct | Ret 5D Norm Pct | Ret 20D Norm Pct | Ret 63D Norm Pct |
|---|---|---|---|---|
| 1 | 1.10 | -1.70 | -0.44 | -0.67 |
| 2 | 0.54 | -1.87 | -1.31 | -0.41 |
| 3 | 0.65 | -0.95 | -0.52 | 0.37 |
| 4 | 0.33 | -1.09 | -0.54 | 0.64 |
| 5 | 0.69 | -0.90 | -0.29 | 0.59 |
| 6 | 0.52 | -1.07 | 0.05 | 1.35 |
| 7 | 0.43 | -0.67 | 0.15 | 1.13 |
| 8 | 0.22 | -0.65 | -0.49 | 0.22 |
| 9 | 0.41 | -0.97 | -1.00 | 0.16 |
| 10 | 0.80 | -0.74 | -0.27 | 0.46 |
| 11 | 0.87 | -0.97 | -0.43 | 0.42 |
| 12 | 0.59 | -0.52 | 0.37 | 0.52 |
| 13 | 0.40 | -0.70 | -0.26 | 0.57 |
| 14 | 0.46 | -0.58 | -0.11 | 0.72 |
| 15 | 0.88 | -0.59 | 0.35 | 0.68 |
| 16 | 0.31 | -0.15 | 0.08 | 0.80 |
| 17 | 0.89 | -0.28 | 0.10 | 0.65 |
| 18 | 0.45 | -0.22 | 0.25 | 1.04 |
| 19 | 1.34 | -0.25 | -0.32 | 1.16 |
| 20 | 2.16 | -0.79 | 0.92 | 0.83 |
Short-Sale Activity printed +0.28% at z=+2.6, the 99.3rd percentile since 2020 and the strongest reading since May 6; the completed five-day run of +0.62% ranks in the 99.8th percentile of all five-day windows. Yesterday's most heavily short-sold names have beaten the barely-shorted ones for a week running — a squeeze-like outcome against the single most statistically reliable effect in the model, whose durable baseline is the opposite sign. Standing positions tell a different story: Short Interest fell -0.21% at z=-1.3, the crowded short side underperforming as it usually does, with no relief there at all. One-day flow getting run over while accumulated short exposure keeps paying is the signature of fast money being chased out of fresh trades, not of anyone covering a book.
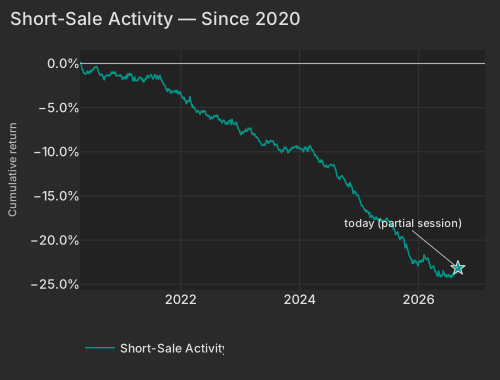
| Date | Cumret Pct |
|---|---|
| 2020-04-22 | 0.07 |
| 2020-05-14 | -1.02 |
| 2020-06-08 | -1.06 |
| 2020-06-30 | -0.97 |
| 2020-07-23 | -0.46 |
| 2020-08-14 | -1.06 |
| 2020-09-08 | -1.41 |
| 2020-09-30 | -1.41 |
| 2020-10-22 | -1.24 |
| 2020-11-13 | -1.05 |
| 2020-12-08 | -1.37 |
| 2020-12-31 | -1.41 |
| 2021-01-26 | -1.56 |
| 2021-02-18 | -1.33 |
| 2021-03-12 | -1.93 |
| 2021-04-06 | -1.84 |
| 2021-04-28 | -1.65 |
| 2021-05-20 | -2.06 |
| 2021-06-14 | -1.44 |
| 2021-07-07 | -1.38 |
| 2021-07-29 | -1.30 |
| 2021-08-20 | -1.56 |
| 2021-09-14 | -2.09 |
| 2021-10-06 | -2.94 |
| 2021-10-28 | -3.30 |
| 2021-11-19 | -3.10 |
| 2021-12-14 | -3.02 |
| 2022-01-06 | -3.65 |
| 2022-01-31 | -4.39 |
| 2022-02-23 | -4.35 |
| 2022-03-17 | -4.87 |
| 2022-04-08 | -5.54 |
| 2022-05-03 | -5.60 |
| 2022-05-25 | -5.34 |
| 2022-06-17 | -5.99 |
| 2022-07-13 | -6.18 |
| 2022-08-04 | -5.96 |
| 2022-08-26 | -6.36 |
| 2022-09-20 | -6.48 |
| 2022-10-12 | -6.63 |
| 2022-11-03 | -6.43 |
| 2022-11-28 | -6.78 |
| 2022-12-20 | -7.28 |
| 2023-01-13 | -7.76 |
| 2023-02-07 | -7.64 |
| 2023-03-02 | -7.48 |
| 2023-03-24 | -8.03 |
| 2023-04-18 | -8.36 |
| 2023-05-10 | -9.02 |
| 2023-06-02 | -9.26 |
| 2023-06-27 | -8.92 |
| 2023-07-20 | -8.82 |
| 2023-08-11 | -9.19 |
| 2023-09-05 | -9.82 |
| 2023-09-27 | -9.74 |
| 2023-10-19 | -9.92 |
| 2023-11-10 | -9.75 |
| 2023-12-05 | -9.44 |
| 2023-12-28 | -9.51 |
| 2024-01-23 | -9.83 |
| 2024-02-14 | -9.54 |
| 2024-03-08 | -9.43 |
| 2024-04-02 | -10.16 |
| 2024-04-24 | -10.69 |
| 2024-05-16 | -11.02 |
| 2024-06-10 | -11.77 |
| 2024-07-03 | -11.55 |
| 2024-07-26 | -11.58 |
| 2024-08-19 | -12.68 |
| 2024-09-11 | -12.80 |
| 2024-10-03 | -13.20 |
| 2024-10-25 | -13.70 |
| 2024-11-18 | -13.82 |
| 2024-12-11 | -14.54 |
| 2025-01-06 | -15.40 |
| 2025-01-30 | -16.42 |
| 2025-02-24 | -16.69 |
| 2025-03-18 | -17.40 |
| 2025-04-09 | -17.44 |
| 2025-05-02 | -17.64 |
| 2025-05-27 | -17.82 |
| 2025-06-18 | -17.63 |
| 2025-07-14 | -18.12 |
| 2025-08-05 | -18.59 |
| 2025-08-27 | -19.12 |
| 2025-09-19 | -19.71 |
| 2025-10-13 | -20.68 |
| 2025-11-04 | -21.53 |
| 2025-11-26 | -22.62 |
| 2025-12-19 | -22.42 |
| 2026-01-14 | -22.39 |
| 2026-02-06 | -21.63 |
| 2026-03-03 | -21.99 |
| 2026-03-25 | -23.18 |
| 2026-04-17 | -23.54 |
| 2026-05-11 | -23.66 |
| 2026-06-03 | -23.51 |
| 2026-06-26 | -24.24 |
| 2026-07-21 | -24.15 |
| 2026-08-12 | -23.81 |
| 2026-09-03 | -23.16 |
All of this is happening under an index that will not move together. Idiosyncratic variance took 73.2% of the cross-section against a one-year average of 66.3%, and the 20-day pairwise realized correlation sits at 7.32%, the 2.0th percentile since 2020 — a level that has been in place for weeks rather than news made today. The faster gauge is the one worth watching: the five-day blend at 14.27% ranks in the top fifth of the past three months, and implied one-month single-stock correlation (Cboe COR1M) is 9.54, the bottom 3.4% of its 20-year history.
Ciena closed -10.72% and gave up $5.4 billion of market value after reporting record fiscal Q3 revenue of $1.67 billion, up 37% year on year, with backlog at a record $8.5 billion; its own release and management commentary named component supply as the ceiling on growth. Snowflake closed +16.58%, adding $16.8 billion, after product revenue accelerated to 37% growth and full-year guidance went to $6.07 billionBloomberg — IGV +2.88% carried the read across software. Then the after-close prints split violently: Lululemon closed +1.48% and fell a further -19.69% in late trading, with MarketWatch reporting Thursday that its sales drop deepens questions about the turnaround; Guidewire closed +4.90% and dropped -19.53% after hours despite fiscal 2026 revenue of $1.48 billion, up 23%; Samsara closed +5.29% and added +12.83% on Q2 revenue of $508.4 million, up 30%, and raised full-year guidance. Broadcom closed -2.78% into its own after-close report, shedding $48.6 billion — that is pre-print positioning, not reaction.
Consumer Staples was the one negative sector median on the board at -0.73%. Campbell's closed -7.36% after cutting its quarterly dividend 36% to accelerate debt paydown and guiding fiscal 2027 EPS below the StreetBloomberg, and Tyson fell -7.14% after The Wall Street Journal reported it cut annual revenue guidance on cattle supply pressure. NetApp sold off despite record quarterly revenue as free cash flow contractedthe SEC. In insurance the moves were entirely name-level: Principal Financial rose +7.23% on reported interest from Samsung Life in a minority stake, its largest stock-specific move in a trailing year, while Corebridge fell -8.75%.
Waller conditioned his vote on the August CPI the BLS due September 11, and the services data does not obviously support him: the ISM Prices Paid index rose to 72.6, above 70 for the fifth time in six months and its highest in nearly four yearsThe Wall Street Journal. Crude added a fourth straight advance with diesel near record highs on Persian Gulf transit fearsNYT — and yet energy equities sat it out, XLE -0.72% against +13.59% over 20 sessions. A tape that will buy gold miners and crypto proxies on a dovish signal but not the oil complex on a fourth day of geopolitical supply risk is telling you which part of the inflation story it is willing to fund.
The ISM Non-Manufacturing report, released at 10:00 AM ET, showed the headline index at 55.4 in August against a 54.2 consensus, with business activity at 61.7 and new orders at 60.9 — the strongest demand reading in six months — while employment stayed in contraction at 47.8 for a second monthThe Wall Street Journal. Initial Claims the BLS, released at 8:30 AM ET, came in at 206,000 versus 205,000 expected, with continuing claims up 8,000 to 1.779 million — layoffs still rare, hiring still frozen.
Variance decomposition: live intraday — 20260903 session, bracketed against its trailing-year range. Factor returns are trailing through last close. Total cross-sectional dispersion: 43%ile of the past year.
Variance mix — % of total, today vs 1d ago vs 1-yr avg
market 76%ile style 28%ile thematic 86%ile idiosyncratic 49%ile
Variance explained — today vs. factor's trailing-year range
Marker = the factor's share of today's total variance, placed in its own trailing-year range (box 25–75%ile, ticks 90%ile and max). Amber marker = unusually load-bearing today (≥90%ile of its own year). Factor name green = up today / red = down.
Correlation & dispersion — realized vs implied
Pairwise realized correlation (20d): 7.32% 2.0%ile since 2020 · 30%ile 3m
Top-500 pairwise: 6.34% 1.7%ile since 2020 · 14%ile 3m · implied (Cboe COR1M): 9.54 3.4%ile of its own history (gap -3.2pp)
Realized 20d vol (ann. pts): all stocks 41 vs VIXEQ 35 · index 10 vs VIX 14 · style factors 18 66%ile
20-day window (19 completed days + today); percentiles vs model history since 2020; '3m' tokens rank vs the trailing 63 trading days; definitions in Terms below. Implied prints (Cboe) are delayed ~15 min. as of 16:41 ET
High-beta momentum cohort (eq-wt, since-2020 rank): +1.1% 67%ile · rest of market +0.5%
| Factor | Today | 1d | 5d | 20d | 60d |
|---|---|---|---|---|---|
| Style-Risk | |||||
| Residual Volatility | +0.38% z+0.8 | -0.26% | +0.24% | +2.91% | +1.43% |
| Beta | +0.59% z+0.6 | +0.32% | -2.04% | -2.45% | -6.03% |
| International | +0.03% z+0.1 | +0.21% | +0.88% | +1.15% | +0.69% |
| Style | |||||
| Profitability | -0.28% z-1.5 | -0.18% | -0.38% | -1.55% | -2.52% |
| Liquidity | -0.24% z-0.9 | +0.18% | +0.62% | +2.31% | -0.08% |
| Value | -0.14% z-0.6 | +0.33% | +0.55% | +0.07% | -1.23% |
| Size | +0.21% z+0.6 | -0.24% | +0.94% | +0.20% | -0.38% |
| Leverage | -0.02% z-0.1 | -0.01% | -0.08% | -1.09% | -3.66% |
| Dividend Yield | -0.01% z-0.1 | -0.09% | +0.01% | +0.67% | -0.59% |
| Growth | -0.01% z-0.1 | +0.01% | -0.17% | +0.14% | +2.42% |
| Style-Momentum | |||||
| One-Day Momentum | -0.34% z-1.2 | +0.20% | -0.57% | -1.33% | -0.92% |
| Medium-Term Momentum | +0.26% z+0.9 | +0.37% | +0.23% | +1.57% | +1.40% |
| Long-Term Momentum | -0.57% z-0.9 | -0.01% | -0.41% | -0.82% | -4.67% |
| Short-Term Momentum | -0.01% z-0.0 | -0.40% | -0.43% | -1.73% | -7.02% |
| Style-Positioning | |||||
| Short Interest | -0.21% z-1.3 | +0.14% | -0.03% | +0.16% | +0.88% |
| Hedge-Fund Ownership | -0.11% z-1.0 | -0.06% | -0.36% | +0.04% | +0.93% |
| Style-Flow | |||||
| Short-Sale Activity | +0.28% z+2.6 | +0.20% | +0.62% | +0.69% | +0.50% |
| Morning Activity | +0.01% z+0.1 | +0.15% | +0.44% | +1.89% | +1.99% |
| Thematic | |||||
| Gold | +0.59% z+1.8 | +0.30% | +0.41% | +4.60% | +4.26% |
| Bitcoin / Crypto | +0.49% z+1.6 | -0.03% | +0.90% | +2.71% | +2.20% |
| Treasury (Duration) | -0.49% z-1.5 | +0.35% | -0.30% | -0.85% | -0.34% |
| Semiconductors | -0.62% z-1.0 | -0.20% | -0.23% | -1.94% | -6.69% |
| Oil | -0.24% z-0.5 | +0.01% | +0.88% | +3.58% | +1.93% |
| China | -0.09% z-0.2 | -0.28% | -0.10% | +0.21% | +0.09% |
5/20/60d windows include today's session; 1d is the previous session.
Pairwise realized correlation. Index variance net of the weighted idiosyncratic diagonal, over the cross terms — the estimator used for implied-correlation indices. 20-day window unless noted; history since 2020.
Market variance share. The fraction of cross-sectional variance explained by the market factor — the attribution companion to pairwise correlation, not a substitute for it.
Factor z-score. Today's factor return divided by its daily-return standard deviation over ~1,600 trading days.
Conditional importance. A factor's relative share of what a tree-based fit of today's stock returns explains; sums to 100% across factors.
High-beta momentum cohort. US names above $2B market cap in the top quintile of both raw beta and 12-month momentum; membership frozen at each month's first business day. “Top 50” = the 50 strongest by combined rank.
Dispersion (realized). Total cross-sectional volatility net of the market component; high dispersion is the flip side of low correlation.
Stock-specific (idiosyncratic) return. The part of a stock's move not explained by market, style, or thematic factors in our decomposition.
VIXEQ / DSPX / COR1M. Cboe implied indices: single-stock volatility, dispersion, and 1-month implied correlation (top-50 S&P names). Quotes delayed ~15 minutes.
Data compiled by FactorPulse AI; edited and verified by Jeff Klein. For informational purposes only. Does not constitute financial advice, an investment recommendation, or an offer to buy or sell any securities. Always consult a qualified financial professional before making investment decisions.
For more on factor construction methodology, see www.factorpulse.com/glossary.