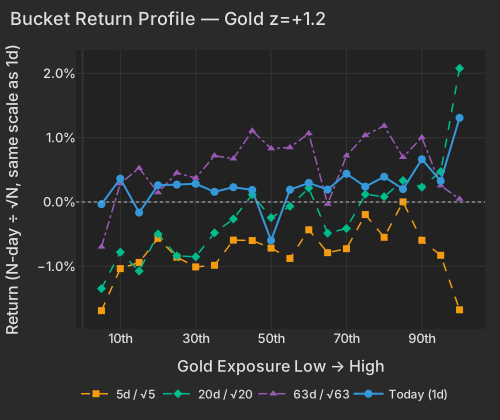
Gold is the one factor lining names up this morning: +0.41% at z=+1.3 with 25.6% of conditional importance, and it is the newest leg of a run worth +4.41% over 20 sessions. The dollar index at 99.127, down -0.47%, and a 2-year Treasury yield 2.3 bps lower are the mechanism; a +2.12% weighted move in the gold miners sitting in the top exposure bucket is the confirmation. The complication is in the same instruments: those miners fell -4.68% over the past five sessions, so this is a rebound inside a stalled advance.
The move runs cleanly up the exposure ladder rather than sitting in a handful of names. The highest-exposure Gold bucket returned +1.31%, and the eleven gold miners inside it moved +2.12% on a weighted basis. Materials is the strongest sector with a +0.91% median stock, carried by Newmont +2.08%, Agnico Eagle +2.46% and Gold Fields +3.71%.
| Factor | Return | Z-Score | 5d Z | 20d Z | 63d Z | Category | Direction |
|---|---|---|---|---|---|---|---|
| Gold | +0.41% | z=+1.3 | +0.3 | +3.0 | +1.5 | Thematic | High-exposure names outperformed |
| Profitability | -0.24% | z=-1.3 | -0.8 | -1.8 | -1.4 | Style | More profitable names underperformed |
| Morning Activity | +0.12% | z=+0.9 | +1.9 | +3.6 | +1.8 | Style-Flow | Habitually morning-heavy names outperformed |
| Short Interest | -0.15% | z=-0.9 | +0.1 | +0.3 | +0.8 | Style-Positioning | Most-shorted names underperformed |
| Residual Volatility | +0.26% | z=+0.5 | +0.1 | +1.3 | -0.4 | Style-Risk | More volatile names outperformed |
| Short-Sale Activity | +0.06% | z=+0.5 | +1.6 | +1.0 | +0.0 | Style-Flow | Yesterday's most short-sold names outperformed T+1 |
| Hedge-Fund Ownership | -0.05% | z=-0.5 | -1.2 | +0.2 | +1.3 | Style-Positioning | Hedge-fund-owned names underperformed |
| Bucket | Ret 1D Pct | Ret 5D Norm Pct | Ret 20D Norm Pct | Ret 63D Norm Pct |
|---|---|---|---|---|
| 1 | -0.03 | -1.69 | -1.35 | -0.70 |
| 2 | 0.36 | -1.04 | -0.78 | 0.29 |
| 3 | -0.16 | -0.94 | -1.07 | 0.53 |
| 4 | 0.26 | -0.56 | -0.50 | 0.15 |
| 5 | 0.27 | -0.86 | -0.84 | 0.45 |
| 6 | 0.28 | -1.01 | -0.85 | 0.37 |
| 7 | 0.16 | -0.98 | -0.48 | 0.72 |
| 8 | 0.23 | -0.59 | -0.26 | 0.67 |
| 9 | 0.19 | -0.60 | 0.12 | 1.11 |
| 10 | -0.60 | -0.72 | -0.24 | 0.83 |
| 11 | 0.19 | -0.88 | -0.07 | 0.85 |
| 12 | 0.30 | -0.43 | 0.22 | 1.07 |
| 13 | 0.19 | -0.79 | -0.48 | -0.03 |
| 14 | 0.44 | -0.73 | -0.41 | 0.72 |
| 15 | 0.24 | -0.20 | 0.12 | 1.04 |
| 16 | 0.39 | -0.55 | 0.08 | 1.18 |
| 17 | 0.20 | 0.00 | 0.33 | 0.70 |
| 18 | 0.66 | -0.60 | 0.23 | 1.00 |
| 19 | 0.33 | -0.83 | 0.47 | 0.25 |
| 20 | 1.31 | -1.68 | 2.08 | 0.05 |
The mechanism is priced in currencies and in the front end of the curve. The dollar index sits at 99.127, down -0.47%CNBC, and every tenor from three months to thirty years is lower, with the 2-year at 4.363% and the 10-year at 4.772%CNBC. Behind that is August ADP adpemploymentreport.com private payrolls of just 38,000, which cooled mid-September rate expectations and carried bullion back above $4,400CNBC. Crude has steadied alongside it after President Trump characterized planned strikes on Iran as short-durationBloomberg, leaving oil and energy instruments firm without a fresh escalation bid.
| ETF | Theme | Today | 1d Ago | 5d Ago | 20d Ago | 63d Ago |
|---|---|---|---|---|---|---|
| GDX | gold miners | +1.88% | +3.13% | -4.68% | +16.67% | +14.86% |
| GLD | gold bullion | +1.15% | +1.52% | -4.40% | +3.37% | -1.25% |
| USO | oil | +1.35% | +0.11% | +10.84% | +22.87% | +0.21% |
| XLE | energy | +0.66% | +0.51% | +4.28% | +13.59% | +10.88% |
| IGV | software | +1.29% | -2.60% | +1.01% | +2.08% | +3.21% |
| SMH | semiconductors | -1.03% | +0.96% | -0.95% | -3.37% | -13.70% |
| DRAM | memory chips & storage | -1.85% | +2.09% | -0.32% | +4.60% | -19.37% |
| EWY | south korea | -1.33% | +1.74% | -0.18% | +5.75% | -16.01% |
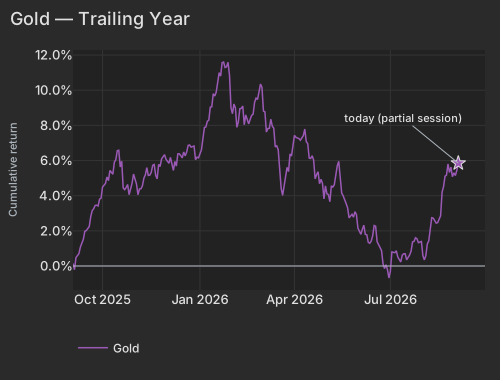
This is not a one-day bid. The Gold factor has returned +4.41% over the past 20 sessions, the 98.7th percentile of all such windows since 2020, and the miners have added +16.67% over the same stretch. What the trailing columns also show is where it stopped: GDX gave back -4.68% last week and GLD -4.40%, while the factor itself managed only +0.23% across those five sessions. Today reverses part of that setback; the month-long slope is intact but it has been flat for a week.
| Date | Cumret Pct |
|---|---|
| 2025-09-03 | 0.14 |
| 2025-09-05 | 0.48 |
| 2025-09-10 | 1.08 |
| 2025-09-12 | 1.52 |
| 2025-09-17 | 2.13 |
| 2025-09-19 | 2.80 |
| 2025-09-24 | 3.44 |
| 2025-09-26 | 3.41 |
| 2025-10-01 | 4.49 |
| 2025-10-03 | 4.70 |
| 2025-10-08 | 5.43 |
| 2025-10-10 | 5.22 |
| 2025-10-15 | 6.56 |
| 2025-10-17 | 5.63 |
| 2025-10-22 | 4.35 |
| 2025-10-24 | 4.64 |
| 2025-10-29 | 4.70 |
| 2025-11-03 | 4.67 |
| 2025-11-05 | 4.38 |
| 2025-11-10 | 4.99 |
| 2025-11-12 | 5.60 |
| 2025-11-17 | 5.32 |
| 2025-11-19 | 5.77 |
| 2025-11-24 | 5.78 |
| 2025-11-26 | 6.09 |
| 2025-12-02 | 5.92 |
| 2025-12-04 | 6.18 |
| 2025-12-09 | 5.95 |
| 2025-12-11 | 6.37 |
| 2025-12-16 | 6.15 |
| 2025-12-18 | 6.27 |
| 2025-12-23 | 6.88 |
| 2025-12-26 | 6.83 |
| 2025-12-31 | 6.15 |
| 2026-01-06 | 7.88 |
| 2026-01-08 | 8.23 |
| 2026-01-13 | 9.05 |
| 2026-01-15 | 9.67 |
| 2026-01-21 | 10.81 |
| 2026-01-23 | 11.60 |
| 2026-01-28 | 11.59 |
| 2026-01-30 | 9.01 |
| 2026-02-04 | 8.99 |
| 2026-02-06 | 8.19 |
| 2026-02-11 | 9.10 |
| 2026-02-13 | 8.59 |
| 2026-02-19 | 8.57 |
| 2026-02-23 | 9.31 |
| 2026-02-26 | 9.91 |
| 2026-03-02 | 10.17 |
| 2026-03-05 | 7.62 |
| 2026-03-10 | 8.35 |
| 2026-03-12 | 7.84 |
| 2026-03-17 | 6.62 |
| 2026-03-19 | 4.42 |
| 2026-03-24 | 4.99 |
| 2026-03-26 | 5.37 |
| 2026-03-31 | 6.96 |
| 2026-04-02 | 7.32 |
| 2026-04-08 | 7.28 |
| 2026-04-10 | 7.79 |
| 2026-04-15 | 6.13 |
| 2026-04-17 | 6.27 |
| 2026-04-22 | 5.19 |
| 2026-04-24 | 4.68 |
| 2026-04-29 | 3.82 |
| 2026-05-01 | 4.11 |
| 2026-05-06 | 4.56 |
| 2026-05-11 | 5.21 |
| 2026-05-13 | 5.96 |
| 2026-05-18 | 3.99 |
| 2026-05-20 | 3.55 |
| 2026-05-26 | 2.94 |
| 2026-05-28 | 3.09 |
| 2026-06-02 | 1.97 |
| 2026-06-04 | 2.09 |
| 2026-06-09 | 1.78 |
| 2026-06-11 | 1.29 |
| 2026-06-16 | 2.30 |
| 2026-06-18 | 1.38 |
| 2026-06-24 | 0.13 |
| 2026-06-26 | 0.07 |
| 2026-07-01 | -0.29 |
| 2026-07-06 | 0.76 |
| 2026-07-09 | 0.37 |
| 2026-07-14 | 0.70 |
| 2026-07-16 | 0.35 |
| 2026-07-21 | 0.84 |
| 2026-07-23 | 1.40 |
| 2026-07-28 | 1.33 |
| 2026-07-30 | 1.39 |
| 2026-08-04 | 0.59 |
| 2026-08-06 | 1.44 |
| 2026-08-11 | 2.72 |
| 2026-08-13 | 2.44 |
| 2026-08-18 | 2.86 |
| 2026-08-20 | 4.52 |
| 2026-08-25 | 5.80 |
| 2026-08-27 | 5.62 |
| 2026-09-01 | 5.15 |
| 2026-09-03 | 5.85 |
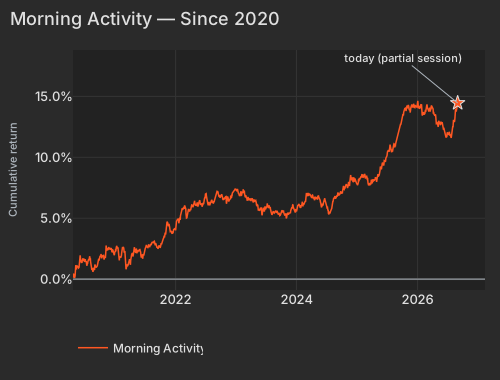
The most extreme multi-week signal in the model this morning is not thematic. Morning Activity — the standing tilt toward names that habitually run volume-heavy mornings, a group skewing retail and international — sits at z=+3.6 over 20 days, the 99.7th percentile of 20-day windows since 2020, and adds another z=+0.9 today. The exposure was fixed from trailing data before the bell, so what this measures is a month of one identifiable set of names outperforming, not anything about this session's trading.
| Date | Cumret Pct |
|---|---|
| 2020-04-22 | 0.24 |
| 2020-05-14 | 1.10 |
| 2020-06-08 | 1.53 |
| 2020-06-30 | 1.42 |
| 2020-07-23 | 1.49 |
| 2020-08-14 | 0.82 |
| 2020-09-08 | 1.02 |
| 2020-09-30 | 1.59 |
| 2020-10-22 | 1.88 |
| 2020-11-13 | 2.52 |
| 2020-12-08 | 2.54 |
| 2020-12-31 | 2.22 |
| 2021-01-26 | 1.61 |
| 2021-02-18 | 2.58 |
| 2021-03-12 | 0.99 |
| 2021-04-06 | 1.53 |
| 2021-04-28 | 2.62 |
| 2021-05-20 | 2.34 |
| 2021-06-14 | 1.96 |
| 2021-07-07 | 2.75 |
| 2021-07-29 | 2.76 |
| 2021-08-20 | 3.03 |
| 2021-09-14 | 2.65 |
| 2021-10-06 | 2.90 |
| 2021-10-28 | 3.64 |
| 2021-11-19 | 4.34 |
| 2021-12-14 | 3.81 |
| 2022-01-06 | 4.54 |
| 2022-01-31 | 4.86 |
| 2022-02-23 | 5.76 |
| 2022-03-17 | 5.41 |
| 2022-04-08 | 6.13 |
| 2022-05-03 | 6.03 |
| 2022-05-25 | 6.37 |
| 2022-06-17 | 6.27 |
| 2022-07-13 | 6.45 |
| 2022-08-04 | 6.27 |
| 2022-08-26 | 6.56 |
| 2022-09-20 | 6.84 |
| 2022-10-12 | 6.73 |
| 2022-11-03 | 6.78 |
| 2022-11-28 | 6.55 |
| 2022-12-20 | 7.23 |
| 2023-01-13 | 7.13 |
| 2023-02-07 | 7.00 |
| 2023-03-02 | 6.85 |
| 2023-03-24 | 6.55 |
| 2023-04-18 | 6.35 |
| 2023-05-10 | 5.98 |
| 2023-06-02 | 5.70 |
| 2023-06-27 | 5.97 |
| 2023-07-20 | 6.00 |
| 2023-08-11 | 5.40 |
| 2023-09-05 | 5.43 |
| 2023-09-27 | 5.25 |
| 2023-10-19 | 5.40 |
| 2023-11-10 | 5.45 |
| 2023-12-05 | 5.78 |
| 2023-12-28 | 5.62 |
| 2024-01-23 | 6.05 |
| 2024-02-14 | 6.22 |
| 2024-03-08 | 6.81 |
| 2024-04-02 | 6.76 |
| 2024-04-24 | 6.70 |
| 2024-05-16 | 6.74 |
| 2024-06-10 | 6.22 |
| 2024-07-03 | 6.03 |
| 2024-07-26 | 5.59 |
| 2024-08-19 | 6.61 |
| 2024-09-11 | 7.11 |
| 2024-10-03 | 7.09 |
| 2024-10-25 | 7.60 |
| 2024-11-18 | 7.80 |
| 2024-12-11 | 7.99 |
| 2025-01-06 | 7.77 |
| 2025-01-30 | 8.44 |
| 2025-02-24 | 8.25 |
| 2025-03-18 | 7.85 |
| 2025-04-09 | 8.19 |
| 2025-05-02 | 8.03 |
| 2025-05-27 | 9.20 |
| 2025-06-18 | 9.72 |
| 2025-07-14 | 10.55 |
| 2025-08-05 | 10.54 |
| 2025-08-27 | 11.24 |
| 2025-09-19 | 12.56 |
| 2025-10-13 | 13.71 |
| 2025-11-04 | 14.02 |
| 2025-11-26 | 14.21 |
| 2025-12-19 | 14.30 |
| 2026-01-14 | 14.15 |
| 2026-02-06 | 13.51 |
| 2026-03-03 | 14.30 |
| 2026-03-25 | 14.11 |
| 2026-04-17 | 13.40 |
| 2026-05-11 | 12.92 |
| 2026-06-03 | 12.81 |
| 2026-06-26 | 11.68 |
| 2026-07-21 | 11.89 |
| 2026-08-12 | 12.94 |
| 2026-09-03 | 14.46 |
It matters because there is no index leg to hide behind. The 20-day blended pairwise realized correlation is 7.36%, the 2.0th percentile since 2020, and implied one-month single-stock correlation (Cboe COR1M) is 10.58, inside the lowest 4.4% of its twenty-year history — levels that have been pinned down there for weeks rather than set today. For a book, that means the axes that do line names up are the whole risk story: Gold this session, Morning Activity for a month, and very little from the market itself.
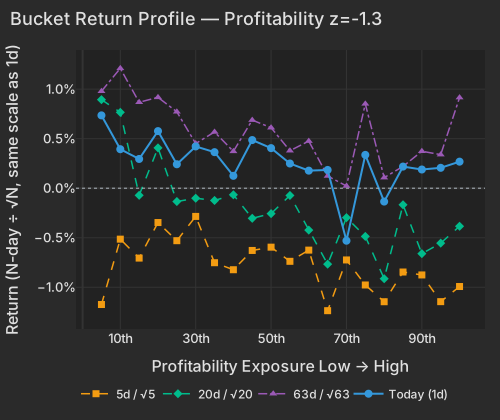
Snowflake is up +22.99% after beating on product revenue and raising its full-year forecastBloomberg, adding $23.3B of market value. That gap also colors a style print: Profitability is -0.24% at z=-1.3 and the return is entirely a left-tail affair, with the least-profitable bucket at +0.74%. Snowflake carries a -3.5σ exposure to that factor and is the loudest single voice inside the bucket, which argues for reading today's Profitability number as one guidance beat rather than a fresh verdict on earnings quality.
| Bucket | Ret 1D Pct | Ret 5D Norm Pct | Ret 20D Norm Pct | Ret 63D Norm Pct |
|---|---|---|---|---|
| 1 | 0.74 | -1.17 | 0.89 | 0.98 |
| 2 | 0.39 | -0.51 | 0.77 | 1.21 |
| 3 | 0.30 | -0.71 | -0.07 | 0.87 |
| 4 | 0.58 | -0.35 | 0.41 | 0.92 |
| 5 | 0.24 | -0.53 | -0.13 | 0.77 |
| 6 | 0.42 | -0.28 | -0.10 | 0.45 |
| 7 | 0.36 | -0.75 | -0.12 | 0.57 |
| 8 | 0.12 | -0.82 | -0.07 | 0.37 |
| 9 | 0.49 | -0.63 | -0.30 | 0.69 |
| 10 | 0.40 | -0.59 | -0.26 | 0.61 |
| 11 | 0.25 | -0.74 | -0.07 | 0.38 |
| 12 | 0.18 | -0.62 | -0.42 | 0.48 |
| 13 | 0.18 | -1.24 | -0.77 | 0.12 |
| 14 | -0.53 | -0.72 | -0.30 | 0.02 |
| 15 | 0.34 | -0.98 | -0.49 | 0.85 |
| 16 | -0.13 | -1.15 | -0.91 | 0.11 |
| 17 | 0.22 | -0.85 | -0.17 | 0.22 |
| 18 | 0.19 | -0.88 | -0.66 | 0.37 |
| 19 | 0.21 | -1.15 | -0.55 | 0.34 |
| 20 | 0.27 | -0.99 | -0.38 | 0.91 |
At the other end, Ultragenyx is -47.46%, erasing $1.28B, after its Phase 3 Aspire study in Angelman syndrome missed every primary and secondary endpointBloomberg. HPE is -4.66% after lifting its full-year sales forecast on AI server demand while margins fell short of the highest expectationsBloomberg, and Campbell's is -5.86% despite a fiscal fourth-quarter adjusted EPS beatBloomberg. NetApp is -9.25% with nothing in today's coverage attached to it — the market is marking the name down on its own, and the driver is not yet visible. Broadcom is -3.49%, shedding $60.65B before tonight's report.
One more piece of the international leg: South Korean lawmakers filed a bill to protect minority shareholders in restructurings, with POSCO named among the conglomerates facing sharper capital-allocation scrutinyBloomberg. EWY is -1.33% while POSCO's US listing is +6.45%, almost all of it the stock's own move — the index and the name are pricing the same headline in opposite directions.
Initial Claims the BLS are due at 8:30 AM ET; consensus, per Reuters and major platforms, is 205,000 for the week ending August 29 against 203,000 prior, in a labor market still characterized as low-hire and low-fire. The ISM Non-Manufacturing index follows at 10:00 AM ET, with consensus at 54.2–54.3 versus July's 54.1 — the two lines that matter are July's employment sub-index at 47.4, already in contraction, and prices paid at 70.3.
Variance decomposition: live intraday — 20260903 session, bracketed against its trailing-year range. Factor returns are trailing through last close. Total cross-sectional dispersion: 2.8%ile of the past year.
Variance mix — % of total, today vs 1d ago vs 1-yr avg
market 35%ile style 24%ile thematic 61%ile idiosyncratic 85%ile
Variance explained — today vs. factor's trailing-year range
Marker = the factor's share of today's total variance, placed in its own trailing-year range (box 25–75%ile, ticks 90%ile and max). Amber marker = unusually load-bearing today (≥90%ile of its own year). Factor name green = up today / red = down.
Correlation & dispersion — realized vs implied
Pairwise realized correlation (20d): 7.36% 2.0%ile since 2020 · 32%ile 3m
Top-500 pairwise: 4.86% 0.2%ile since 2020 · 1.6%ile 3m · implied (Cboe COR1M): 10.58 4.4%ile of its own history (gap -5.7pp)
Realized 20d vol (ann. pts): all stocks 40 vs VIXEQ 36 · index 9 vs VIX 15 · style factors 18 65%ile
20-day window (19 completed days + today); percentiles vs model history since 2020; '3m' tokens rank vs the trailing 63 trading days; definitions in Terms below. Implied prints (Cboe) are delayed ~15 min. as of 07:58 ET
Top 50 high-beta momentum names (eq-wt, since-2020 rank): -0.6% 37%ile · rest of market +0.3%
| Factor | Today | 1d | 5d | 20d | 60d |
|---|---|---|---|---|---|
| Style-Risk | |||||
| Residual Volatility | +0.26% z+0.5 | -0.26% | +0.11% | +2.79% | +1.30% |
| Beta | -0.18% z-0.2 | +0.32% | -2.81% | -3.22% | -6.80% |
| International | +0.03% z+0.1 | +0.21% | +0.88% | +1.15% | +0.69% |
| Style | |||||
| Profitability | -0.24% z-1.3 | -0.18% | -0.34% | -1.51% | -2.48% |
| Leverage | -0.11% z-0.6 | -0.01% | -0.17% | -1.19% | -3.76% |
| Liquidity | -0.16% z-0.6 | +0.18% | +0.70% | +2.39% | -0.01% |
| Value | -0.08% z-0.3 | +0.33% | +0.61% | +0.14% | -1.17% |
| Dividend Yield | -0.05% z-0.3 | -0.09% | -0.03% | +0.64% | -0.63% |
| Growth | -0.03% z-0.1 | +0.01% | -0.19% | +0.12% | +2.40% |
| Size | -0.03% z-0.1 | -0.24% | +0.70% | -0.04% | -0.62% |
| Style-Momentum | |||||
| One-Day Momentum | -0.13% z-0.5 | +0.20% | -0.37% | -1.13% | -0.72% |
| Medium-Term Momentum | +0.13% z+0.5 | +0.37% | +0.11% | +1.45% | +1.28% |
| Long-Term Momentum | -0.13% z-0.2 | -0.01% | +0.02% | -0.38% | -4.23% |
| Short-Term Momentum | +0.02% z+0.1 | -0.40% | -0.40% | -1.69% | -6.99% |
| Style-Positioning | |||||
| Short Interest | -0.15% z-0.9 | +0.14% | +0.04% | +0.23% | +0.94% |
| Hedge-Fund Ownership | -0.05% z-0.5 | -0.06% | -0.30% | +0.10% | +0.99% |
| Style-Flow | |||||
| Morning Activity | +0.11% z+0.9 | +0.15% | +0.54% | +1.99% | +2.09% |
| Short-Sale Activity | +0.06% z+0.6 | +0.20% | +0.40% | +0.48% | +0.28% |
| Thematic | |||||
| Gold | +0.41% z+1.2 | +0.30% | +0.22% | +4.41% | +4.07% |
| Semiconductors | -0.33% z-0.6 | -0.20% | +0.06% | -1.66% | -6.40% |
| Bitcoin / Crypto | +0.08% z+0.3 | -0.03% | +0.49% | +2.30% | +1.79% |
| Treasury (Duration) | -0.09% z-0.3 | +0.35% | +0.11% | -0.45% | +0.06% |
| Oil | +0.10% z+0.2 | +0.01% | +1.23% | +3.92% | +2.28% |
| China | -0.07% z-0.2 | -0.28% | -0.09% | +0.23% | +0.11% |
5/20/60d windows include today's session; 1d is the previous session.
Pairwise realized correlation. Index variance net of the weighted idiosyncratic diagonal, over the cross terms — the estimator used for implied-correlation indices. 20-day window unless noted; history since 2020.
Market variance share. The fraction of cross-sectional variance explained by the market factor — the attribution companion to pairwise correlation, not a substitute for it.
Factor z-score. Today's factor return divided by its daily-return standard deviation over ~1,600 trading days.
Conditional importance. A factor's relative share of what a tree-based fit of today's stock returns explains; sums to 100% across factors.
High-beta momentum cohort. US names above $2B market cap in the top quintile of both raw beta and 12-month momentum; membership frozen at each month's first business day. “Top 50” = the 50 strongest by combined rank.
Dispersion (realized). Total cross-sectional volatility net of the market component; high dispersion is the flip side of low correlation.
Stock-specific (idiosyncratic) return. The part of a stock's move not explained by market, style, or thematic factors in our decomposition.
VIXEQ / DSPX / COR1M. Cboe implied indices: single-stock volatility, dispersion, and 1-month implied correlation (top-50 S&P names). Quotes delayed ~15 minutes.
Data compiled by FactorPulse AI; edited and verified by Jeff Klein. For informational purposes only. Does not constitute financial advice, an investment recommendation, or an offer to buy or sell any securities. Always consult a qualified financial professional before making investment decisions.
For more on factor construction methodology, see www.factorpulse.com/glossary.