Dell Technologies (DELL) closed +15.58% after lifting fiscal 2027 revenue guidance to $192B and adjusted EPS guidance to $25.50 from $17.90 CNBC Bloomberg. The move added $37.9B of market value. Credo Technology (CRDO) grew revenue 115% year over year and beat on EPS, then closed -20.03% as adjusted gross margin slipped to 68% from 68.3% Economic Times, erasing $7.1B. MongoDB (MDB) beat on revenue and closed -13.72% because Atlas growth came in at 29% against a 30% whisper, the fifth straight quarter of deceleration MarketWatch Bloomberg. GitLab (GTLB) raised its FY27 revenue outlook to $1.133B and rose +10.48% MarketWatch. Palo Alto Networks (PANW) beat and fell about -9% after adding another acquisition on top of its $25B CyberArk purchase CNBC. The reaction function is identical in each case: the beat is the entry fee, the trajectory is the price.
After the bell the cluster kept going. Snowflake (SNOW) closed -3.90% and then rose +20.56% in late trading; NetApp (NTAP) closed -1.28% and fell a further -8.99%. Broadcom (AVGO), which reported after the close CNBC, closed -0.64% and slipped -3.60% in late trading. The drivers behind the Snowflake and NetApp prints are not yet in the sourced coverage. Neither is the evening's largest move: Ultragenyx (RARE) closed +2.68% and is -47.46% after hours, erasing $1.17B, with the market repricing the name on its own story. Hewlett Packard Enterprise (HPE) closed +1.91% and Salesforce (CRM) -0.43% into their own reports tonight; Nvidia (NVDA) is nearing a $14B deal for Hugging Face Bloomberg.
| Factor | Return | Z-Score | 5d Z | 20d Z | 63d Z | Category | Direction |
|---|---|---|---|---|---|---|---|
| Profitability | -0.32% | -1.7 | -1.4 | -1.9 | -1.6 | Style | Continuation (down) |
| Short-Sale Activity | +0.20% | +1.8 | +0.3 | +0.8 | +0.1 | Style-Flow | Squeeze-like day |
| Medium-Term Momentum | +0.38% | +1.3 | +0.5 | +0.8 | +0.4 | Style-Momentum | Continuation |
| Value | +0.30% | +1.3 | +0.4 | 0.0 | -0.5 | Style | Reversal vs 63d |
| Gold | +0.40% | +1.2 | +0.3 | +3.0 | +1.5 | Thematic | Continuation |
| Morning Activity | +0.14% | +1.1 | +2.1 | +3.2 | +1.5 | Style-Flow | Continuation |
| Treasury (Duration) | +0.32% | +1.0 | -0.4 | -0.4 | +0.2 | Thematic | Bounce vs 20d |
| Hedge-Fund Ownership | -0.10% | -0.9 | -1.7 | +0.2 | +1.4 | Style-Positioning | Reversal vs 63d |
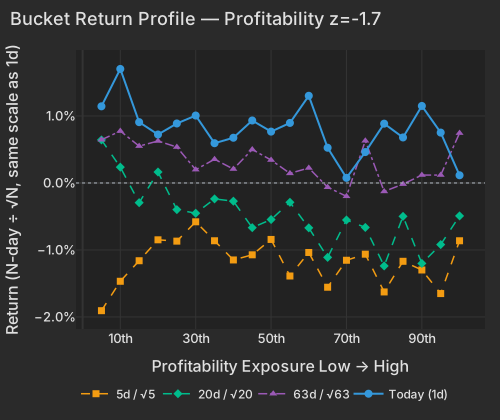
The style axis moving under the earnings reactions is Profitability. It fell -0.32% today at z=-1.7, and its 20-day cumulative return is -1.62%, a stretch that ranks in the bottom 0.8% of the 1,581 overlapping 20-day windows since 2020 and was last matched in October 2025. The slope has the same sign at every horizon: the most profitable decile has lagged the least profitable over one, five, 20 and 63 days, with the 20-day rank correlation at -0.76. Today the least profitable names, biotech among them (RYTM, MDGL, INSM), gained +1.07% on average while the most profitable lost -0.72%. QUAL, the quality ETF, is +0.17% against +0.35% for SPY on the day and lags it over 20 days too; the index-level product shows the same preference at lower amplitude.
| Bucket | Ret 1D Pct | Ret 5D Norm Pct | Ret 20D Norm Pct | Ret 63D Norm Pct |
|---|---|---|---|---|
| 1 | 1.14 | -1.91 | 0.64 | 0.64 |
| 2 | 1.70 | -1.47 | 0.24 | 0.78 |
| 3 | 0.91 | -1.16 | -0.29 | 0.55 |
| 4 | 0.72 | -0.85 | 0.16 | 0.63 |
| 5 | 0.89 | -0.87 | -0.40 | 0.54 |
| 6 | 1.01 | -0.58 | -0.45 | 0.20 |
| 7 | 0.59 | -0.86 | -0.24 | 0.35 |
| 8 | 0.68 | -1.15 | -0.27 | 0.21 |
| 9 | 0.93 | -1.07 | -0.67 | 0.50 |
| 10 | 0.77 | -0.84 | -0.55 | 0.34 |
| 11 | 0.90 | -1.39 | -0.29 | 0.14 |
| 12 | 1.30 | -1.04 | -0.67 | 0.22 |
| 13 | 0.53 | -1.56 | -1.11 | -0.06 |
| 14 | 0.08 | -1.15 | -0.55 | -0.20 |
| 15 | 0.46 | -1.06 | -0.66 | 0.63 |
| 16 | 0.89 | -1.63 | -1.24 | -0.13 |
| 17 | 0.68 | -1.17 | -0.50 | -0.02 |
| 18 | 1.15 | -1.30 | -1.20 | 0.12 |
| 19 | 0.75 | -1.65 | -0.92 | 0.12 |
| 20 | 0.12 | -0.86 | -0.49 | 0.74 |
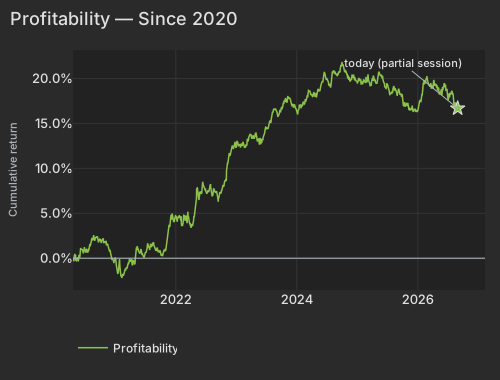
The evening's two software-and-storage moves sit at the ends of that exposure. Snowflake is three and a half standard deviations below average on Profitability and NetApp two and a half above, and their late-trading moves ran in the direction the factor has paid for a month. Snowflake's late-session gain is the largest idiosyncratic move in its trailing year for a name with no catalyst yet in coverage, so the connection is a rhyme, not an attribution. What the factor path does say is that a book long earnings quality has been bleeding since early August, and this week's prints landed on a position already under water.
| Date | Cumret Pct |
|---|---|
| 2020-04-21 | 0.04 |
| 2020-05-13 | -0.18 |
| 2020-06-05 | 1.14 |
| 2020-06-29 | 1.24 |
| 2020-07-22 | 0.93 |
| 2020-08-13 | 2.17 |
| 2020-09-04 | 2.38 |
| 2020-09-29 | 1.98 |
| 2020-10-21 | 2.12 |
| 2020-11-12 | 1.49 |
| 2020-12-07 | 0.35 |
| 2020-12-30 | -0.09 |
| 2021-01-25 | -0.90 |
| 2021-02-17 | -1.87 |
| 2021-03-11 | -1.15 |
| 2021-04-05 | -0.24 |
| 2021-04-27 | -0.50 |
| 2021-05-19 | 1.08 |
| 2021-06-11 | 0.47 |
| 2021-07-06 | 0.61 |
| 2021-07-28 | 0.92 |
| 2021-08-19 | 1.76 |
| 2021-09-13 | 1.07 |
| 2021-10-05 | 0.41 |
| 2021-10-27 | 0.97 |
| 2021-11-18 | 2.85 |
| 2021-12-13 | 4.81 |
| 2022-01-05 | 4.68 |
| 2022-01-28 | 4.59 |
| 2022-02-22 | 4.57 |
| 2022-03-16 | 5.18 |
| 2022-04-07 | 3.62 |
| 2022-05-02 | 5.59 |
| 2022-05-24 | 6.82 |
| 2022-06-16 | 8.23 |
| 2022-07-12 | 7.30 |
| 2022-08-03 | 7.63 |
| 2022-08-25 | 7.54 |
| 2022-09-19 | 6.83 |
| 2022-10-11 | 8.12 |
| 2022-11-02 | 8.68 |
| 2022-11-25 | 11.39 |
| 2022-12-19 | 12.41 |
| 2023-01-12 | 12.62 |
| 2023-02-06 | 12.66 |
| 2023-03-01 | 12.56 |
| 2023-03-23 | 13.64 |
| 2023-04-17 | 13.37 |
| 2023-05-09 | 13.17 |
| 2023-06-01 | 12.92 |
| 2023-06-26 | 14.26 |
| 2023-07-19 | 14.78 |
| 2023-08-10 | 16.31 |
| 2023-09-01 | 16.44 |
| 2023-09-26 | 16.27 |
| 2023-10-18 | 17.51 |
| 2023-11-09 | 17.90 |
| 2023-12-04 | 17.00 |
| 2023-12-27 | 16.62 |
| 2024-01-22 | 16.98 |
| 2024-02-13 | 17.43 |
| 2024-03-07 | 18.15 |
| 2024-04-01 | 18.22 |
| 2024-04-23 | 17.97 |
| 2024-05-15 | 18.73 |
| 2024-06-07 | 19.62 |
| 2024-07-02 | 19.88 |
| 2024-07-25 | 19.01 |
| 2024-08-16 | 20.75 |
| 2024-09-10 | 20.50 |
| 2024-10-02 | 21.72 |
| 2024-10-24 | 20.71 |
| 2024-11-15 | 20.16 |
| 2024-12-10 | 20.23 |
| 2025-01-03 | 19.44 |
| 2025-01-29 | 19.47 |
| 2025-02-21 | 19.67 |
| 2025-03-17 | 19.64 |
| 2025-04-08 | 19.73 |
| 2025-05-01 | 19.43 |
| 2025-05-23 | 20.26 |
| 2025-06-17 | 19.46 |
| 2025-07-11 | 18.91 |
| 2025-08-04 | 18.62 |
| 2025-08-26 | 18.66 |
| 2025-09-18 | 18.18 |
| 2025-10-10 | 17.02 |
| 2025-11-03 | 17.03 |
| 2025-11-25 | 16.62 |
| 2025-12-18 | 16.63 |
| 2026-01-13 | 17.47 |
| 2026-02-05 | 19.40 |
| 2026-03-02 | 20.04 |
| 2026-03-24 | 19.49 |
| 2026-04-16 | 19.21 |
| 2026-05-08 | 18.90 |
| 2026-06-02 | 18.79 |
| 2026-06-25 | 19.14 |
| 2026-07-20 | 18.20 |
| 2026-08-11 | 17.05 |
| 2026-09-02 | 16.68 |
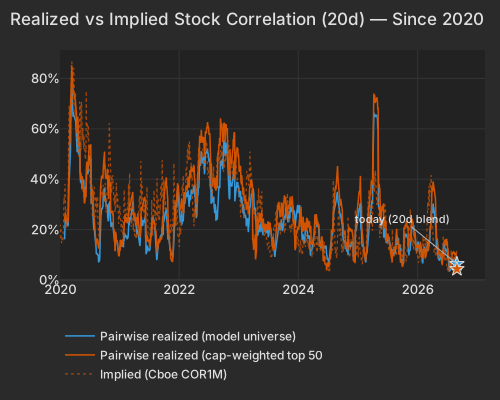
Stock-specific variance is 85.2% of the cross-section today against a one-year average of 66.4%; the market leg is 7.1%. That is an earnings tape by construction, and it sits on a correlation plateau rather than a fresh low: 20-day realized pairwise correlation is 6.36%, the 1.0th percentile since 2020 but only the 25th percentile of the past three months. The S&P 500 like-for-like reads 4.36%, a level not seen since June 2024. The options market is priced for more of the same. Implied one-month single-stock correlation (Cboe COR1M) fell 2.13 points to 10.51, the 4.4th percentile of its 20-year history, while implied index volatility (Cboe VIX) eased to 15.21 from 16.34. Implied correlation still sits about 4 points above what has been realized, so single-stock hedges are being paid for, not given away.
| Series | Today Pct | Prev Close Pct |
|---|---|---|
| pairwise_model | 6.36 | 5.91 |
| pairwise_top500 | 4.36 | 4.79 |
| implied_cor1m |
Goldman Sachs Prime Brokerage put fundamental long/short net leverage at 52.7%, the 3rd percentile, as of the September 1 session. J.P. Morgan's trading desk turned tactically cautious on September 2, citing crowding in the Momentum factor and fading buyback support, and Citadel Securities recommended trimming net exposure with the August 31 session as its reference. Our ownership lens is consistent with funds sitting light: Hedge-Fund Ownership is -0.10% today and -0.42% over five days (z_5d=-1.7), with the raw version the same sign, so the names hedge funds own most have lagged through both lenses all week. On JPMorgan's point, the trade in question has already fallen a long way: MTUM is -9.05% over 63 days, and the high-beta momentum cohort came into today -22% below its high as of the September 1 close before rising +0.99% today against +0.66% for the rest of the universe. Short-Term Momentum is -0.31% today (z=-1.0), down four of the past five sessions and -6.50% over 60 days: last week's leaders were faded again. The flow factor that has been paying is Morning Activity, the habitually early-trading, retail-heavy names, +1.79% over 20 days in a stretch that ranks in the top 0.4% of windows since 2020 — the profile hedge funds own least has been the one winning.
The ten-year Treasury yield eased 1.6 bps to 4.78% CNBC after ADP reported 38,000 private jobs for August Bloomberg, a day after reaching its highest level since January 2025. CME FedWatch odds of a September 16 hike nonetheless rose to 70% as New York Fed President Williams called the yield surge a reflection of strong growth and left the door open to hikes MarketWatch. The thirty-year sits at 5.26% CNBC, its highest since 2007 Economic Times. Inside equities the relief went where duration is: the Treasury (Duration) factor rose +0.32% with the day's highest conditional importance at 9.2%, and the most rate-sensitive decile, biotech such as ABCL, SDGR and BNTX, gained +1.76%.
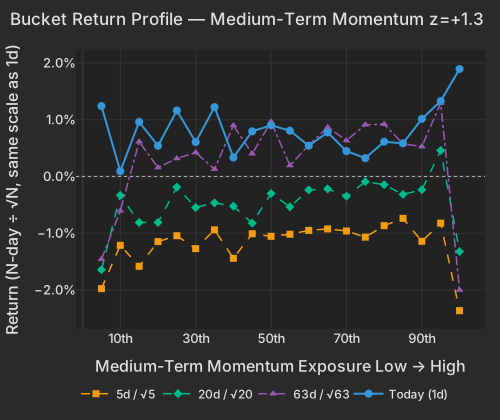
Gold is the multi-week story hiding inside a one-day bounce. The Gold factor is +0.40% today (z=+1.2) and +4.29% over 20 days, a 20-day z of +3.0, so today extends the trend. GDX is +3.19% on the day after a five-day -10.28% slide, with spot gold lifting off a three-week low near $4,321 MarketWatch and the dollar index down -0.13% to 99.55 CNBC. The decomposition assigns the miners' bounce to the one-month-winners basket rather than to gold itself: Kinross (KGC) +3.21%, SSR Mining (SSRM) +4.84% and IAMGold (IAG) +4.77% are classed factor-driven with Medium-Term Momentum the top contributor, and that factor is +0.38% today (z=+1.3) with the winners leading at every horizon back to 63 days. Short-Sale Activity adds the day's other flow wrinkle at z=+1.8, a session in the 98th percentile since 2020: the names most heavily short-sold on Tuesday outperformed the barely-shorted names today, against the model's most reliable effect, and regional banks such as BankUnited (BKU) sat in that top decile as KRE rose +2.06%.
| Bucket | Ret 1D Pct | Ret 5D Norm Pct | Ret 20D Norm Pct | Ret 63D Norm Pct |
|---|---|---|---|---|
| 1 | 1.24 | -1.98 | -1.64 | -1.46 |
| 2 | 0.09 | -1.21 | -0.33 | -0.61 |
| 3 | 0.96 | -1.58 | -0.81 | 0.61 |
| 4 | 0.54 | -1.15 | -0.81 | 0.16 |
| 5 | 1.16 | -1.05 | -0.19 | 0.32 |
| 6 | 0.61 | -1.27 | -0.55 | 0.42 |
| 7 | 1.22 | -0.94 | -0.47 | 0.13 |
| 8 | 0.33 | -1.44 | -0.52 | 0.90 |
| 9 | 0.80 | -1.01 | -0.82 | 0.40 |
| 10 | 0.90 | -1.06 | -0.30 | 0.96 |
| 11 | 0.81 | -1.02 | -0.54 | 0.19 |
| 12 | 0.54 | -0.95 | -0.24 | 0.55 |
| 13 | 0.78 | -0.93 | -0.22 | 0.87 |
| 14 | 0.45 | -0.96 | -0.35 | 0.63 |
| 15 | 0.32 | -1.07 | -0.09 | 0.91 |
| 16 | 0.61 | -0.87 | -0.15 | 0.92 |
| 17 | 0.58 | -0.74 | -0.32 | 0.57 |
| 18 | 1.02 | -1.14 | -0.23 | 0.53 |
| 19 | 1.33 | -0.82 | 0.46 | 1.29 |
| 20 | 1.89 | -2.37 | -1.32 | -2.00 |
| ETF | Theme | Today | 1d Ago | 5d Ago | 20d Ago | 63d Ago |
|---|---|---|---|---|---|---|
| GDX | gold miners | +3.19% | -3.90% | -10.28% | +21.50% | +7.52% |
| KRE | regional banks | +2.06% | -1.28% | -2.30% | -6.71% | +4.43% |
| GLD | gold | +1.44% | -2.86% | -7.32% | +6.04% | -3.69% |
| IWM | small cap | +1.19% | -1.14% | -2.89% | -3.69% | -0.37% |
| XBI | biotech | +0.82% | +0.55% | -3.37% | +7.58% | +27.90% |
| SPY | large cap | +0.35% | -0.69% | -0.54% | -1.24% | +0.29% |
| QUAL | quality | +0.17% | -0.73% | -1.37% | -1.71% | +2.41% |
| XLRE | real estate | -0.64% | -0.16% | -2.91% | -2.50% | +1.26% |
| IGV | software | -1.86% | -3.46% | +4.25% | +4.10% | +1.38% |
| VXX | volatility | -2.64% | +3.06% | -0.64% | -12.79% | -23.88% |
The software ETF IGV is -1.86% on the day after +4.25% over five sessions, so the MongoDB and Palo Alto reactions land on a group that had just rallied, and the after-hours Snowflake print will test whether the group's dispersion narrows or widens at Thursday's open. The next scheduled test of the trajectory thesis is HPE's report tonight, into which the stock closed +1.91%.
The ADP National Employment Report, released at 8:15 AM ET, showed private payrolls rising 38,000 in August against a 47,000 consensus and July's upwardly revised 46,000, the weakest print since January Bloomberg. Education and health services added 45,000 while manufacturing shed 17,000, annual pay growth held at 3.2%, and the market reaction was confined to a modest bid for duration.
Variance decomposition: live intraday — 20260902 session, bracketed against its trailing-year range. Factor returns are trailing through last close. Total cross-sectional dispersion: 34%ile of the past year.
Variance mix — % of total, today vs 1d ago vs 1-yr avg
market 61%ile style 6.4%ile thematic 11%ile idiosyncratic 86%ile
Variance explained — today vs. factor's trailing-year range
Marker = the factor's share of today's total variance, placed in its own trailing-year range (box 25–75%ile, ticks 90%ile and max). Amber marker = unusually load-bearing today (≥90%ile of its own year). Factor name green = up today / red = down.
Correlation & dispersion — realized vs implied
Pairwise realized correlation (20d): 6.36% 1.0%ile since 2020 · 25%ile 3m
Top-500 pairwise: 4.36% 0.1%ile since 2020 · 0.0%ile 3m · implied (Cboe COR1M): 10.51 4.3%ile of its own history (gap -6.2pp)
Realized 20d vol (ann. pts): all stocks 42 vs VIXEQ 36 · index 9 vs VIX 15 · style factors 18 65%ile
20-day window (19 completed days + today); percentiles vs model history since 2020; '3m' tokens rank vs the trailing 63 trading days; definitions in Terms below. Implied prints (Cboe) are delayed ~15 min. as of 16:21 ET
High-beta momentum cohort (eq-wt, since-2020 rank): +1.0% 65%ile · rest of market +0.7%
| Factor | Today | 1d | 5d | 20d | 60d |
|---|---|---|---|---|---|
| Style-Risk | |||||
| International | +0.17% z+0.6 | +0.36% | +0.65% | +1.30% | +0.40% |
| Residual Volatility | -0.18% z-0.4 | -0.15% | +0.69% | +2.60% | -0.22% |
| Beta | +0.21% z+0.2 | -1.33% | -1.91% | -3.69% | -7.64% |
| Style | |||||
| Profitability | -0.33% z-1.7 | -0.03% | -0.58% | -1.62% | -2.30% |
| Value | +0.30% z+1.3 | +0.12% | +0.22% | -0.00% | -1.08% |
| Size | -0.25% z-0.7 | +0.28% | +0.78% | +0.14% | -1.11% |
| Dividend Yield | -0.11% z-0.7 | +0.06% | +0.01% | +0.67% | -0.88% |
| Liquidity | +0.10% z+0.4 | +0.31% | +0.87% | +2.33% | -0.39% |
| Growth | -0.08% z-0.3 | -0.03% | +0.09% | -0.04% | +2.49% |
| Leverage | +0.00% z+0.0 | +0.10% | -0.32% | -1.16% | -3.34% |
| Style-Momentum | |||||
| Medium-Term Momentum | +0.38% z+1.3 | -0.46% | +0.34% | +1.08% | +0.82% |
| Short-Term Momentum | -0.31% z-1.0 | -0.25% | -0.63% | -1.34% | -6.50% |
| One-Day Momentum | -0.03% z-0.1 | +0.22% | -0.42% | -1.49% | -1.05% |
| Long-Term Momentum | -0.07% z-0.1 | +0.58% | -0.04% | -0.32% | -4.99% |
| Style-Positioning | |||||
| Hedge-Fund Ownership | -0.10% z-0.9 | -0.06% | -0.42% | +0.07% | +1.18% |
| Short Interest | +0.11% z+0.7 | +0.09% | +0.16% | +0.03% | +1.21% |
| Style-Flow | |||||
| Short-Sale Activity | +0.20% z+1.8 | +0.02% | +0.07% | +0.41% | +0.14% |
| Morning Activity | +0.14% z+1.1 | +0.14% | +0.59% | +1.79% | +1.97% |
| Thematic | |||||
| Gold | +0.40% z+1.2 | -0.15% | +0.23% | +4.29% | +3.75% |
| Treasury (Duration) | +0.32% z+1.0 | +0.22% | -0.29% | -0.58% | +0.51% |
| China | -0.23% z-0.6 | +0.15% | +0.57% | +0.60% | +0.02% |
| Semiconductors | -0.33% z-0.5 | +0.74% | -0.02% | -0.88% | -6.62% |
| Bitcoin / Crypto | +0.00% z+0.0 | -0.16% | +1.20% | +2.35% | +1.66% |
| Oil | -0.00% z-0.0 | +0.42% | +1.56% | +4.30% | +0.59% |
5/20/60d windows include today's session; 1d is the previous session.
Pairwise realized correlation. Index variance net of the weighted idiosyncratic diagonal, over the cross terms — the estimator used for implied-correlation indices. 20-day window unless noted; history since 2020.
Factor z-score. Today's factor return divided by its daily-return standard deviation over ~1,600 trading days.
Conditional importance. A factor's relative share of what a tree-based fit of today's stock returns explains; sums to 100% across factors.
High-beta momentum cohort. US names above $2B market cap in the top quintile of both raw beta and 12-month momentum; membership frozen at each month's first business day. “Top 50” = the 50 strongest by combined rank.
Dispersion (realized). Total cross-sectional volatility net of the market component; high dispersion is the flip side of low correlation.
Stock-specific (idiosyncratic) return. The part of a stock's move not explained by market, style, or thematic factors in our decomposition.
VIXEQ / DSPX / COR1M. Cboe implied indices: single-stock volatility, dispersion, and 1-month implied correlation (top-50 S&P names). Quotes delayed ~15 minutes.
Data compiled by FactorPulse AI; edited and verified by Jeff Klein. For informational purposes only. Does not constitute financial advice, an investment recommendation, or an offer to buy or sell any securities. Always consult a qualified financial professional before making investment decisions.
For more on factor construction methodology, see www.factorpulse.com/glossary.