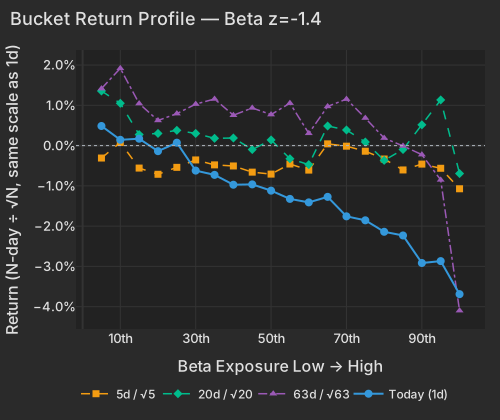
Tanker strikes in the Strait of Hormuz and another leg of the global bond selloff handed a name-by-name market one thing in common again. Beta fell -1.31% at z=-1.4, the index accounted for 16.0% of cross-sectional variance today against 4.6% across the trailing month, and the five-day correlation gauge is back above its three-month median. The month-long reading is still 6.15%, the 0.9th percentile since 2020 — this is the first lift off the floor, not the end of the stock-picker's market.
Two more oil tankers were attacked in the Strait of Hormuz today and the United States launched retaliatory strikes on Iranian targets around it NYT, sending crude sharply higher through the afternoon Bloomberg. The second driver arrived from the front end of the curve: Fed Governor Michael Barr said today he would back a hike at the September 16 meeting if inflation does not ease Bloomberg, four days after Kevin Warsh's Jackson Hole address pushed CME-implied odds of a September move to 66.1% CNBC. The two-year Treasury yield at 4.396% rose 4.6 bps against 1.7 bps on the 30-year at 5.266% CNBC — today's selling was concentrated in the tenors the September meeting actually owns, with the ten-year at 4.792% CNBC and global yields at their highest since 2008 Bloomberg.
| Factor | Return | Z-Score | 5d Z | 20d Z | 63d Z | Category | Direction |
|---|---|---|---|---|---|---|---|
| Beta | -1.31% | -1.4 | -0.95 | -0.98 | -1.4 | Style-Risk | High-beta names underperformed |
| Medium-Term Momentum | -0.42% | -1.5 | -0.19 | +0.85 | +0.30 | Style-Momentum | The past month's winners gave back |
| Morning Activity | +0.17% | +1.3 | +1.1 | +3.4 | +1.3 | Style-Flow | Morning-heavy names outperformed |
| International | +0.37% | +1.3 | +0.34 | +0.96 | -0.24 | Style-Risk | US-listed ADRs beat US-headquartered |
| Semiconductors | +0.66% | +1.1 | +0.68 | -0.54 | -1.2 | Thematic | High chip exposure outperformed |
| Liquidity | +0.28% | +1.1 | +0.99 | +1.5 | -0.49 | Style | Highest-turnover names outperformed |
| Short-Term Momentum | -0.27% | -0.87 | -1.7 | -1.3 | -3.4 | Style-Momentum | Last week's movers reversed |
| Hedge-Fund Ownership | -0.09% | -0.86 | -1.3 | +0.54 | +1.5 | Style-Positioning | HF-owned names lagged |
The damage was ordered almost perfectly by market sensitivity. The top beta bucket fell -3.69%, the bottom bucket was flat, and the names carrying the move had little of their own to say: TMC -6.50%, AEVA -5.68% and NNE -4.36% were essentially all factor, almost none of it company-specific. The high-beta momentum names fell -2.61% against -0.85% for the rest of the universe. None of this is new — Beta is -10.99% over the past 63 sessions — but the ordering has rarely been this clean in a single day.
| Bucket | Ret 1D Pct | Ret 5D Norm Pct | Ret 20D Norm Pct | Ret 63D Norm Pct |
|---|---|---|---|---|
| 1 | 0.49 | -0.31 | 1.36 | 1.41 |
| 2 | 0.14 | 0.08 | 1.05 | 1.92 |
| 3 | 0.17 | -0.56 | 0.27 | 1.04 |
| 4 | -0.14 | -0.71 | 0.30 | 0.62 |
| 5 | 0.07 | -0.54 | 0.38 | 0.79 |
| 6 | -0.62 | -0.36 | 0.30 | 1.03 |
| 7 | -0.73 | -0.48 | 0.18 | 1.16 |
| 8 | -0.97 | -0.51 | 0.19 | 0.75 |
| 9 | -0.96 | -0.66 | -0.10 | 0.94 |
| 10 | -1.12 | -0.71 | 0.14 | 0.77 |
| 11 | -1.32 | -0.46 | -0.33 | 1.05 |
| 12 | -1.41 | -0.61 | -0.47 | 0.30 |
| 13 | -1.27 | 0.04 | 0.49 | 0.97 |
| 14 | -1.76 | -0.01 | 0.39 | 1.15 |
| 15 | -1.86 | -0.14 | 0.09 | 0.68 |
| 16 | -2.14 | -0.33 | -0.37 | 0.19 |
| 17 | -2.23 | -0.60 | -0.10 | -0.01 |
| 18 | -2.92 | -0.46 | 0.52 | -0.23 |
| 19 | -2.87 | -0.56 | 1.13 | -0.85 |
| 20 | -3.69 | -1.07 | -0.69 | -4.10 |
For a month the index has barely been part of the story: over the trailing 20 sessions the market explained 4.6% of cross-sectional variance, and 20-day pairwise realized correlation sits at 6.15%, the 0.9th percentile since 2020, pinned near the lows set July 31. Today the index explained 16.0% of the cross-section. The five-day gauge is the one that turned — 9.54%, the 71.4th percentile of the past 63 sessions against 31.7 at yesterday's close.
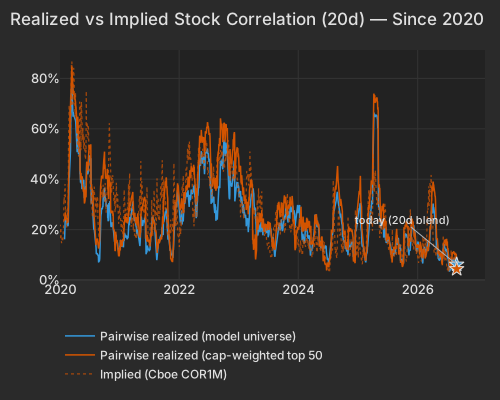
| Series | Today Pct | Prev Close Pct |
|---|---|---|
| pairwise_model | 6.15 | 7.58 |
| pairwise_top500 | 4.37 | 7.82 |
| implied_cor1m |
The options market moved the same way and told you where. Implied index volatility (Cboe VIX) rose 1.52 points to 16.44, the top of its 20-session range of 14.25–16.5, while implied single-stock volatility (Cboe VIXEQ) went from 35.80 to 36.17 and remains 21% below its August 4 high. Implied one-month correlation (COR1M) gained 2.66 points to 12.72. Nothing repriced about single names; the entire index-volatility move was the correlation term. Goldman Sachs Prime Services, reporting September 1 on a covered window it did not state, put global hedge fund gross leverage up 2.7 points to 305.9% with net leverage still defensive at the 30th percentile — a high-gross, low-net book is the one that lives on names moving apart from each other.
The pushback is in the same dataset. Idiosyncratic variance was still 61% of the cross-section today, and a 16.0% index share only ranks in the 66th percentile since 2020 — an ordinary correlation day that looks dramatic only against the past month. Alumis fell -56.53% in the regular session after its oral TYK2 candidate missed the primary endpoint in a Phase 2b lupus trial, and Comstock Resources rose +11.11% on a $1.65 billion partnership with SOCAR that takes pro-forma net debt from $3.1 billion to $1.5 billion. Apple added +2.61% on John Ternus's first day as chief executive Bloomberg, the lone green megacap in a technology sector whose median name fell -2.67%.
Net of everything else, semiconductor exposure was a positive contributor today: the Semiconductors factor rose +0.66% at z=+1.1, the second-largest share of the day's conditional importance at 24%, and the worst returns sat at the lowest-exposure end of the sort, with bucket 1 down -3.2%. SMH's -1.97% is what high market sensitivity cost, not what owning chips cost.
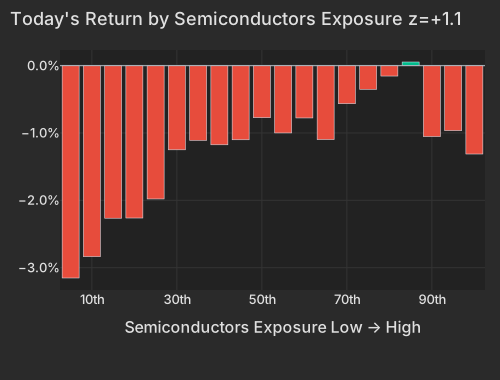
| Bucket | Avg Ret Pct |
|---|---|
| 1 | -3.15 |
| 2 | -2.84 |
| 3 | -2.27 |
| 4 | -2.26 |
| 5 | -1.98 |
| 6 | -1.25 |
| 7 | -1.11 |
| 8 | -1.18 |
| 9 | -1.10 |
| 10 | -0.77 |
| 11 | -1.00 |
| 12 | -0.78 |
| 13 | -1.10 |
| 14 | -0.57 |
| 15 | -0.35 |
| 16 | -0.15 |
| 17 | 0.05 |
| 18 | -1.05 |
| 19 | -0.97 |
| 20 | -1.31 |
| ETF | Theme | Today | 1d Ago | 5d Ago | 20d Ago | 63d Ago |
|---|---|---|---|---|---|---|
| USO | oil | +5.54% | +3.08% | +1.13% | +9.48% | -1.33% |
| XOP | oil & gas E&P | +1.89% | +1.62% | +1.46% | +8.42% | +12.56% |
| XLE | energy | +1.20% | +2.04% | +1.35% | +8.79% | +11.62% |
| XLU | utilities | +0.82% | -1.17% | -2.29% | -4.80% | -2.02% |
| SMH | semiconductors | -1.97% | +0.64% | +1.80% | +2.05% | -8.42% |
| ARKK | innovation growth | -2.79% | +1.16% | +1.97% | +16.36% | +5.30% |
| IGV | software | -3.01% | +0.44% | +7.35% | +12.89% | +2.12% |
| DRAM | memory chips & storage | -3.34% | +1.92% | +4.83% | +11.29% | -16.32% |
| GDX | gold miners | -3.42% | -1.14% | -4.86% | +29.53% | +13.65% |
Software took the sharper hit — IGV -3.01% after a +12.89% run over 20 sessions — and the two worst single names both broke after the bell. MongoDB closed the regular session down -4.23%, then fell a further -9.98% in late trading; its own second-quarter release put revenue at $771.8 million against $735 million consensus but guided second-half Atlas growth to 21–23%. Credo closed down -8.56% and lost another -6.44% post-print despite a release showing revenue of $479.0 million, up 114.7% year on year, and an above-consensus October-quarter guide. CrowdStrike, with no print of its own, fell -6.93% in the session, erasing $17.8 billion of market value.
The quieter structural signal has nothing to do with Iran. Short-Term Momentum's completed 63-day return through the prior close is -8.16%, the 0.7th percentile of every 63-day window since 2020, and today extended it at z=-3.4 on the quarterly horizon: for three months, whatever led one week has been sold the next. Today the one-month version joined in — Medium-Term Momentum -0.42% at z=-1.5, with the give-back concentrated in the biggest recent winners, ten gold miners in the top exposure bucket down -4.38% as a group. GDX is -3.42% today after +29.53% over 20 sessions, SLV -3.67%, with the dollar index at 99.694, up +0.27% CNBC.
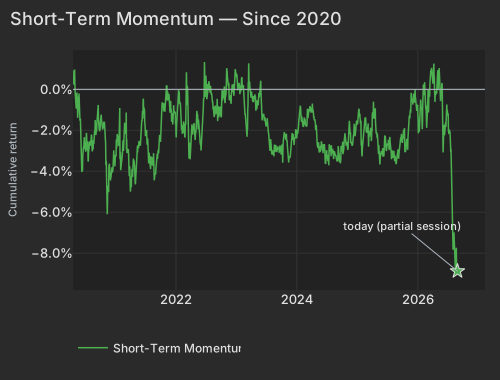
| Date | Cumret Pct |
|---|---|
| 2020-04-20 | 0.53 |
| 2020-05-12 | -0.28 |
| 2020-06-04 | -2.06 |
| 2020-06-26 | -2.33 |
| 2020-07-21 | -3.53 |
| 2020-08-12 | -2.80 |
| 2020-09-03 | -1.89 |
| 2020-09-28 | -2.05 |
| 2020-10-20 | -1.90 |
| 2020-11-11 | -5.61 |
| 2020-12-04 | -4.31 |
| 2020-12-29 | -3.76 |
| 2021-01-22 | -2.52 |
| 2021-02-16 | -2.49 |
| 2021-03-10 | -2.44 |
| 2021-04-01 | -5.00 |
| 2021-04-26 | -3.69 |
| 2021-05-18 | -2.77 |
| 2021-06-10 | -1.52 |
| 2021-07-02 | -2.24 |
| 2021-07-27 | -3.12 |
| 2021-08-18 | -3.64 |
| 2021-09-10 | -3.14 |
| 2021-10-04 | -1.29 |
| 2021-10-26 | -0.88 |
| 2021-11-17 | -0.48 |
| 2021-12-10 | -1.20 |
| 2022-01-04 | -2.35 |
| 2022-01-27 | -0.64 |
| 2022-02-18 | -1.69 |
| 2022-03-15 | -0.41 |
| 2022-04-06 | -1.88 |
| 2022-04-29 | -2.08 |
| 2022-05-23 | -1.76 |
| 2022-06-15 | -1.60 |
| 2022-07-11 | -0.33 |
| 2022-08-02 | -0.23 |
| 2022-08-24 | -1.24 |
| 2022-09-16 | -1.31 |
| 2022-10-10 | -0.34 |
| 2022-11-01 | -0.23 |
| 2022-11-23 | -0.50 |
| 2022-12-16 | 0.00 |
| 2023-01-11 | -0.05 |
| 2023-02-03 | 0.60 |
| 2023-02-28 | -1.46 |
| 2023-03-22 | 0.29 |
| 2023-04-14 | -0.33 |
| 2023-05-08 | -0.89 |
| 2023-05-31 | -0.08 |
| 2023-06-23 | -1.36 |
| 2023-07-18 | -2.25 |
| 2023-08-09 | -3.16 |
| 2023-08-31 | -2.89 |
| 2023-09-25 | -2.77 |
| 2023-10-17 | -2.47 |
| 2023-11-08 | -2.86 |
| 2023-12-01 | -2.55 |
| 2023-12-26 | -2.33 |
| 2024-01-19 | -1.05 |
| 2024-02-12 | -1.77 |
| 2024-03-06 | -1.22 |
| 2024-03-28 | -1.10 |
| 2024-04-22 | -1.46 |
| 2024-05-14 | -2.58 |
| 2024-06-06 | -2.93 |
| 2024-07-01 | -3.18 |
| 2024-07-24 | -3.04 |
| 2024-08-15 | -3.08 |
| 2024-09-09 | -3.11 |
| 2024-10-01 | -2.86 |
| 2024-10-23 | -2.35 |
| 2024-11-14 | -1.95 |
| 2024-12-09 | -2.40 |
| 2025-01-02 | -1.51 |
| 2025-01-28 | -2.49 |
| 2025-02-20 | -1.41 |
| 2025-03-14 | -2.30 |
| 2025-04-07 | -1.41 |
| 2025-04-30 | -2.10 |
| 2025-05-22 | -3.27 |
| 2025-06-16 | -2.83 |
| 2025-07-10 | -2.47 |
| 2025-08-01 | -3.17 |
| 2025-08-25 | -3.57 |
| 2025-09-17 | -2.99 |
| 2025-10-09 | -1.98 |
| 2025-10-31 | -2.82 |
| 2025-11-24 | -0.75 |
| 2025-12-17 | -0.26 |
| 2026-01-12 | -1.90 |
| 2026-02-04 | -0.54 |
| 2026-02-27 | -1.57 |
| 2026-03-23 | 0.58 |
| 2026-04-15 | -0.04 |
| 2026-05-07 | -0.02 |
| 2026-06-01 | 0.18 |
| 2026-06-24 | -1.33 |
| 2026-07-17 | -2.13 |
| 2026-08-10 | -7.17 |
| 2026-09-01 | -8.88 |
One more axis is running hot and getting no attention: Morning Activity is at z=+3.4 on its 20-day horizon, a completed 20-day return in the 99.7th percentile of all such windows since 2020, and it extended again today at z=+1.3. The habitually morning-heavy cohort skews retail and ADR-listed, and the listing-segment factor agrees — International +0.37% at z=+1.3, with Novartis up +6.02% in the session and $16.1 billion of market value added. On a day the index reasserted itself, the segment quietly outperforming for a month is the one furthest from the domestic high-beta complex taking the hit.
The ISM Manufacturing PMI, released at 10:00 AM ET, came in at 54.6 against 55.2 consensus and 55.6 prior, an eighth month of expansion with new orders at 53.7 and prices paid unchanged at 71.1 — the growth line softened while the cost line did not. JOLTS bls.gov, also at 10:00 AM ET, showed July job openings at 7.271 million versus 7.330 million expected, with hires and separations flat at 5.1 million each. The Dallas Fed Texas Retail Outlook Survey at 10:30 AM ET showed the sales index collapsing to -15.4 from -0.1 in July, with retail employment turning negative at -2.7.
Variance decomposition: live intraday — 20260901 session, bracketed against its trailing-year range. Factor returns are trailing through last close. Total cross-sectional dispersion: 45%ile of the past year.
Variance mix — % of total, today vs 1d ago vs 1-yr avg
market 82%ile style 70%ile thematic 34%ile idiosyncratic 26%ile
Variance explained — today vs. factor's trailing-year range
Marker = the factor's share of today's total variance, placed in its own trailing-year range (box 25–75%ile, ticks 90%ile and max). Amber marker = unusually load-bearing today (≥90%ile of its own year). Factor name green = up today / red = down.
Correlation & dispersion — realized vs implied
Pairwise realized correlation (20d): 6.15% 0.9%ile since 2020 · 24%ile 3m most extreme since 2026-07-31
Top-500 pairwise: 4.37% 0.1%ile since 2020 · 0.0%ile 3m · implied (Cboe COR1M): 12.72 7.8%ile of its own history (gap -8.3pp)
5-day gauge: 9.54% — 71%ile of the past 3 months (lifting off the record lows)
Realized 20d vol (ann. pts): all stocks 42 vs VIXEQ 36 · index 9 vs VIX 16 · style factors 19 66%ile
20-day window (19 completed days + today); percentiles vs model history since 2020; '3m' tokens rank vs the trailing 63 trading days; definitions in Terms below. Implied prints (Cboe) are delayed ~15 min. as of 15:58 ET
High-beta momentum cohort (eq-wt, since-2020 rank): -2.6% 12%ile · rest of market -0.8%
| Factor | Today | 1d | 5d | 20d | 60d |
|---|---|---|---|---|---|
| Style-Risk | |||||
| Beta | -1.31% z-1.4 | +0.16% | -2.05% | -4.23% | -6.52% |
| International | +0.37% z+1.2 | +0.06% | +0.23% | +1.29% | +0.20% |
| Residual Volatility | -0.22% z-0.4 | +0.37% | +0.61% | +2.15% | +0.14% |
| Style | |||||
| Liquidity | +0.28% z+1.1 | +0.31% | +0.60% | +1.78% | -0.24% |
| Size | +0.35% z+1.0 | +0.11% | +1.09% | +0.59% | -0.67% |
| Leverage | +0.13% z+0.8 | -0.14% | -0.33% | -1.38% | -3.43% |
| Value | +0.17% z+0.7 | -0.16% | +0.16% | -0.53% | -1.25% |
| Dividend Yield | +0.06% z+0.4 | +0.23% | +0.16% | +0.69% | -0.61% |
| Profitability | -0.02% z-0.1 | -0.11% | -0.09% | -1.32% | -1.87% |
| Growth | -0.02% z-0.1 | -0.14% | +0.28% | +0.37% | +2.57% |
| Style-Momentum | |||||
| Medium-Term Momentum | -0.42% z-1.5 | +0.19% | -0.12% | +1.09% | +0.61% |
| Short-Term Momentum | -0.27% z-0.9 | +0.23% | -1.15% | -1.83% | -5.80% |
| Long-Term Momentum | +0.51% z+0.8 | +0.21% | +0.23% | -0.83% | -4.08% |
| One-Day Momentum | +0.20% z+0.7 | -0.17% | -0.73% | -1.78% | -1.55% |
| Style-Positioning | |||||
| Hedge-Fund Ownership | -0.09% z-0.9 | -0.12% | -0.33% | +0.27% | +1.18% |
| Short Interest | +0.09% z+0.6 | -0.04% | -0.08% | -0.19% | +1.11% |
| Style-Flow | |||||
| Morning Activity | +0.17% z+1.3 | +0.10% | +0.30% | +1.89% | +1.73% |
| Short-Sale Activity | +0.02% z+0.2 | -0.10% | -0.14% | +0.15% | -0.13% |
| Thematic | |||||
| Semiconductors | +0.66% z+1.1 | +0.58% | +0.92% | -1.46% | -5.49% |
| Oil | +0.38% z+0.8 | +0.70% | +1.47% | +3.83% | +1.14% |
| Treasury (Duration) | +0.24% z+0.7 | -0.01% | -0.93% | -0.56% | +0.15% |
| Bitcoin / Crypto | -0.18% z-0.6 | +0.48% | +0.83% | +2.22% | +1.63% |
| Gold | -0.13% z-0.4 | +0.22% | -0.63% | +4.58% | +2.85% |
| China | +0.05% z+0.1 | -0.12% | +0.59% | +0.44% | -0.29% |
5/20/60d windows include today's session; 1d is the previous session.
Pairwise realized correlation. Index variance net of the weighted idiosyncratic diagonal, over the cross terms — the estimator used for implied-correlation indices. 20-day window unless noted; history since 2020.
Market variance share. The fraction of cross-sectional variance explained by the market factor — the attribution companion to pairwise correlation, not a substitute for it.
Factor z-score. Today's factor return divided by its daily-return standard deviation over ~1,600 trading days.
Conditional importance. A factor's relative share of what a tree-based fit of today's stock returns explains; sums to 100% across factors.
High-beta momentum cohort. US names above $2B market cap in the top quintile of both raw beta and 12-month momentum; membership frozen at each month's first business day. “Top 50” = the 50 strongest by combined rank.
Stock-specific (idiosyncratic) return. The part of a stock's move not explained by market, style, or thematic factors in our decomposition.
VIXEQ / DSPX / COR1M. Cboe implied indices: single-stock volatility, dispersion, and 1-month implied correlation (top-50 S&P names). Quotes delayed ~15 minutes.
Data compiled by FactorPulse AI; edited and verified by Jeff Klein. For informational purposes only. Does not constitute financial advice, an investment recommendation, or an offer to buy or sell any securities. Always consult a qualified financial professional before making investment decisions.
For more on factor construction methodology, see www.factorpulse.com/glossary.