Energy is the one honest bid. Oil tankers were struck in the Strait of Hormuz, escalating the Iran conflict overnight Bloomberg, and the complex has followed: USO +1.78%, XLE +1.13%, XOP +1.05%, with the median energy stock +0.86%. Four sector funds are green — XLE, XLV, XLP and XLU — and nothing else in the equity universe is.
The rates move is doing more work than the barrel. The 10-year is at 4.798%, up 4.0 bps, and the 30-year at 5.288%, up 3.9 bps, while the 1-year has moved half a basis point CNBC. The dollar index is at 99.642, +0.215% CNBC. Spot gold weakened below $4,400, roughly 1.6% lower on the day, with September rate-hike pricing firming after Kevin Warsh's Jackson Hole remarks, according to FXStreet. Duration-sensitive names have fallen in each of the past five completed sessions, -1.03% across that week, which is the same bond selloff read through the cross-section.
| Factor | Return | Z-Score | 5d Z | 20d Z | 63d Z | Category | Direction |
|---|---|---|---|---|---|---|---|
| Beta | -0.90% | z=-0.9 | -0.76 | -0.89 | -1.38 | Style-Risk | High-beta names lag, as they have all quarter |
| Gold | -0.30% | z=-0.9 | -1.11 | +3.04 | +1.17 | Thematic | The month's gold winners give back |
| Medium-Term Momentum | -0.22% | z=-0.76 | +0.13 | +1.01 | +0.39 | Style-Momentum | The past month's leaders reverse |
| Morning Activity | -0.07% | z=-0.55 | +0.24 | +2.94 | +1.10 | Style-Flow | Habitually morning-heavy names ease off a strong month |
| Residual Volatility | -0.23% | z=-0.47 | +0.53 | +0.95 | -0.67 | Style-Risk | More volatile names underperform |
| Short-Sale Activity | +0.04% | z=+0.37 | -0.49 | +0.36 | +0.18 | Style-Flow | Yesterday's most short-sold names outperform T+1 |
| Treasury (Duration) | +0.14% | z=+0.43 | -1.4 | -0.5 | -0.0 | Thematic | Five straight down sessions before today |
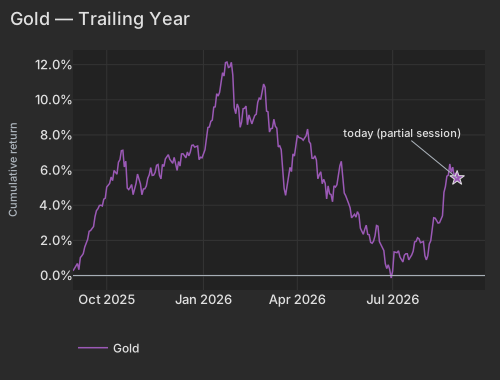
The Gold factor's reversal is the cleanest structural signal on the board. Its completed 20-day run through Monday's close was +4.41% at z=+3.0, and today it is -0.30% at z=-0.9, the fourth day of giving it back. Gold has also been an unusually load-bearing axis for the whole month — 3.9 vol points of the blended 20-day variance, 95.3rd percentile since 2020 — so this is a theme holding real book risk rather than a sideshow that happens to be moving. AngloGold Ashanti, which carries a 4.86σ gold exposure, is -4.72%, and roughly a third of that damage is the style complex rather than the company; Newmont is -2.87% and Agnico -2.79%, with the median materials stock at -1.45%.
| Date | Cumret Pct |
|---|---|
| 2025-08-29 | 0.27 |
| 2025-09-03 | 0.69 |
| 2025-09-08 | 1.12 |
| 2025-09-10 | 1.62 |
| 2025-09-15 | 2.52 |
| 2025-09-17 | 2.68 |
| 2025-09-22 | 3.69 |
| 2025-09-24 | 3.99 |
| 2025-09-29 | 4.35 |
| 2025-10-01 | 5.03 |
| 2025-10-06 | 5.61 |
| 2025-10-08 | 5.98 |
| 2025-10-13 | 6.45 |
| 2025-10-15 | 7.10 |
| 2025-10-20 | 6.51 |
| 2025-10-22 | 4.89 |
| 2025-10-27 | 4.60 |
| 2025-10-30 | 5.77 |
| 2025-11-03 | 5.21 |
| 2025-11-06 | 4.94 |
| 2025-11-10 | 5.54 |
| 2025-11-13 | 5.70 |
| 2025-11-17 | 5.87 |
| 2025-11-20 | 5.70 |
| 2025-11-24 | 6.32 |
| 2025-11-28 | 6.88 |
| 2025-12-02 | 6.47 |
| 2025-12-05 | 6.37 |
| 2025-12-09 | 6.49 |
| 2025-12-12 | 6.93 |
| 2025-12-16 | 6.70 |
| 2025-12-19 | 7.03 |
| 2025-12-23 | 7.43 |
| 2025-12-29 | 6.59 |
| 2026-01-02 | 7.15 |
| 2026-01-06 | 8.42 |
| 2026-01-09 | 8.84 |
| 2026-01-13 | 9.60 |
| 2026-01-16 | 10.43 |
| 2026-01-21 | 11.35 |
| 2026-01-26 | 11.84 |
| 2026-01-28 | 12.13 |
| 2026-02-02 | 9.21 |
| 2026-02-04 | 9.54 |
| 2026-02-09 | 9.49 |
| 2026-02-11 | 9.64 |
| 2026-02-17 | 8.63 |
| 2026-02-19 | 9.11 |
| 2026-02-24 | 10.09 |
| 2026-02-26 | 10.45 |
| 2026-03-03 | 9.36 |
| 2026-03-06 | 8.36 |
| 2026-03-10 | 8.89 |
| 2026-03-13 | 7.32 |
| 2026-03-17 | 7.16 |
| 2026-03-20 | 4.56 |
| 2026-03-24 | 5.53 |
| 2026-03-27 | 6.92 |
| 2026-03-31 | 7.50 |
| 2026-04-06 | 7.80 |
| 2026-04-08 | 7.83 |
| 2026-04-13 | 7.63 |
| 2026-04-15 | 6.68 |
| 2026-04-20 | 6.57 |
| 2026-04-22 | 5.74 |
| 2026-04-27 | 5.48 |
| 2026-04-29 | 4.36 |
| 2026-05-04 | 4.61 |
| 2026-05-07 | 5.03 |
| 2026-05-11 | 5.76 |
| 2026-05-14 | 5.68 |
| 2026-05-18 | 4.54 |
| 2026-05-21 | 3.85 |
| 2026-05-26 | 3.49 |
| 2026-05-29 | 3.47 |
| 2026-06-02 | 2.52 |
| 2026-06-05 | 2.87 |
| 2026-06-09 | 2.32 |
| 2026-06-12 | 1.96 |
| 2026-06-16 | 2.85 |
| 2026-06-22 | 1.62 |
| 2026-06-24 | 0.68 |
| 2026-06-29 | 0.34 |
| 2026-07-01 | 0.26 |
| 2026-07-07 | 1.41 |
| 2026-07-10 | 0.77 |
| 2026-07-14 | 1.24 |
| 2026-07-17 | 1.03 |
| 2026-07-21 | 1.38 |
| 2026-07-24 | 2.15 |
| 2026-07-28 | 1.87 |
| 2026-07-31 | 1.13 |
| 2026-08-04 | 1.13 |
| 2026-08-07 | 2.67 |
| 2026-08-11 | 3.27 |
| 2026-08-14 | 3.01 |
| 2026-08-18 | 3.40 |
| 2026-08-21 | 5.65 |
| 2026-08-25 | 6.35 |
| 2026-08-28 | 5.62 |
| 2026-09-01 | 5.54 |
| ETF | Theme | Today | 1d Ago | 5d Ago | 20d Ago | 63d Ago |
|---|---|---|---|---|---|---|
| GDX | gold miners | -2.77% | -1.14% | -4.86% | +29.53% | +13.65% |
| SLV | silver | -2.67% | +0.18% | -3.33% | +14.62% | -11.14% |
| GLD | gold | -1.84% | -0.11% | -4.28% | +9.88% | -0.69% |
| DRAM | memory chips & storage | -2.51% | +1.92% | +4.83% | +11.29% | -16.32% |
| SMH | semiconductors | -1.66% | +0.64% | +1.80% | +2.05% | -8.42% |
| QQQ | large cap growth | -1.12% | +0.05% | +1.48% | +2.38% | -3.50% |
| TLT | long-term bonds | -0.53% | -0.43% | -0.05% | +0.40% | -3.45% |
| XLV | healthcare | +0.58% | -0.36% | -2.38% | +5.12% | +15.35% |
| XLE | energy | +1.13% | +2.04% | +1.35% | +8.79% | +11.62% |
| USO | oil | +1.78% | +3.08% | +1.13% | +9.48% | -1.33% |
Read the 20-day column against today's: the metals are the only rows where a very large recent gain is being surrendered, while energy's advance is intact at every horizon.
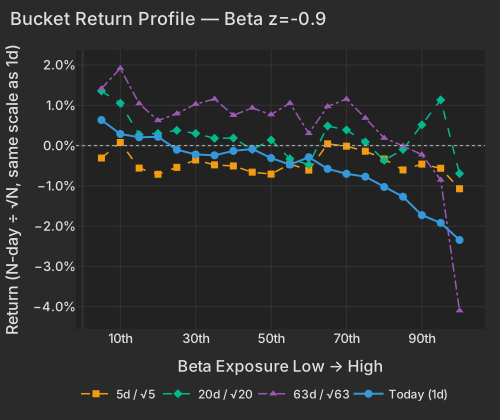
Against Beta, gold is a small slice of the morning. Beta explains 37.1% of cross-sectional variance, above its 90th percentile for the past year, versus 0.81% for Gold — and Beta's own return, -0.90% at z=-0.9, is an ordinary-sized move on the axis the book loads on most. The highest-beta names are at -2.34%, and the AI, semiconductor and data-center names inside that group are at -3.33%: Nano Nuclear, Lightwave Logic and Aeva are doing the work, with the sector's summer drawdown extending under 5.3% long-bond yields Nasdaq.
The residual says this is not a chip story. The Semiconductors factor is +0.17% at z=+0.28 even with SMH -1.66% — once beta is stripped out, semiconductor exposure paid nothing and cost nothing today. Wolfspeed -3.70%, Navitas -3.80% and Super Micro -2.52% all print near-zero company-specific components; the beta complex is the whole move. That is continuation, not news: Beta has cumulated -6.11% over 60 sessions, and the highest-exposure names have been punished at every horizon.
| Bucket | Ret 1D Pct | Ret 5D Norm Pct | Ret 20D Norm Pct | Ret 63D Norm Pct |
|---|---|---|---|---|
| 1 | 0.63 | -0.31 | 1.36 | 1.41 |
| 2 | 0.29 | 0.08 | 1.05 | 1.92 |
| 3 | 0.21 | -0.56 | 0.27 | 1.04 |
| 4 | 0.22 | -0.71 | 0.30 | 0.62 |
| 5 | -0.10 | -0.54 | 0.38 | 0.79 |
| 6 | -0.22 | -0.36 | 0.30 | 1.03 |
| 7 | -0.24 | -0.48 | 0.18 | 1.16 |
| 8 | -0.13 | -0.51 | 0.19 | 0.75 |
| 9 | -0.08 | -0.66 | -0.10 | 0.94 |
| 10 | -0.31 | -0.71 | 0.14 | 0.77 |
| 11 | -0.47 | -0.46 | -0.33 | 1.05 |
| 12 | -0.29 | -0.61 | -0.47 | 0.30 |
| 13 | -0.58 | 0.04 | 0.49 | 0.97 |
| 14 | -0.70 | -0.01 | 0.39 | 1.15 |
| 15 | -0.77 | -0.14 | 0.09 | 0.68 |
| 16 | -1.03 | -0.33 | -0.37 | 0.19 |
| 17 | -1.27 | -0.60 | -0.10 | -0.01 |
| 18 | -1.73 | -0.46 | 0.52 | -0.23 |
| 19 | -1.92 | -0.56 | 1.13 | -0.85 |
| 20 | -2.34 | -1.07 | -0.69 | -4.10 |
The limiting fact for the gold thesis is the calendar. The Gold factor is still z=+1.2 over 63 sessions and GLD is -0.69% across the same quarter: what is being handed back is a month old, and the quarter is flat.
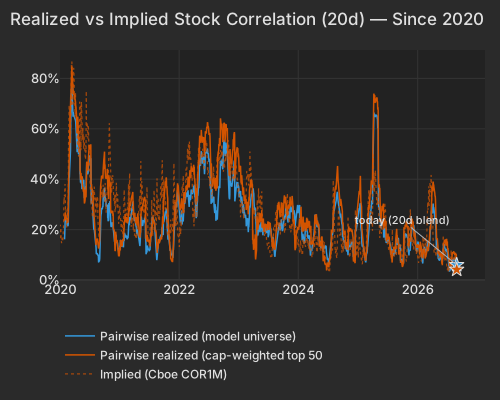
A shooting war in the Strait of Hormuz has not shown up in correlation. Realized 20-day pairwise correlation on the blended window is 5.99%, still in the 0.9th percentile since 2020 and pinned near the lows set July 31; the S&P 500 like-for-like measure at 4.14% has sat at these levels since June 2024. Forward pricing agrees — implied one-month single-stock correlation (Cboe COR1M) is 10.06, the 3.9th percentile of its roughly 20-year history, a premium of about four points to what the past month actually realized, while implied index volatility (Cboe VIX) has only lifted to 15.67 from 14.92 at Monday's close. The escalation is being expressed as sector against sector — energy up, metals down — rather than as an index event.
| Series | Today Pct | Prev Close Pct |
|---|---|---|
| pairwise_model | 5.99 | 7.58 |
| pairwise_top500 | 4.14 | 7.82 |
| implied_cor1m |
Novartis is +5.08%, adding $14.51B of market value, after announcing positive topline results this morning from the Phase III REMODEL-1 and -2 trials of remibrutinib in relapsing multiple sclerosis. Medtronic is +5.49%, adding $6.33B, having reported first-quarter fiscal 2027 revenue of $9.8B, up 13.7% organically, and raised full-year guidance. Both are the stock's own move against a red screen, and they are most of why XLV is green. POSCO is +6.33% after South Korea's trade ministry reported August steel exports up 12.8% year on year Bloomberg — with EWY at -1.66%, that is the company, not the country. UBS is -3.54%, nearly all of it stock-specific, even as the Swiss parliamentary committee reviewing bank capital rules backed letting Additional Tier 1 bonds cover half the requirement on foreign units, softening a demand once estimated at $20 billion of new equity.
The ISM Manufacturing survey is due at 10:00 AM ET, with consensus at 55.2 after July's four-year high of 55.6; a strong print reads hawkish given the September rate-hike pricing already in the front end, and the employment sub-index is the line to watch after it jumped to 52.8 in July. JOLTS bls.gov lands at the same time, with July openings expected near 7.3 million against June's 7.36 million — the last major labor read before Friday's payrolls. The Dallas Fed Texas Service Sector Outlook Survey, which now absorbs the discontinued retail survey, follows at 10:30 AM ET; its selling-prices index, last at 14.2, is the relevant number on a morning when energy costs are the inflation story.
Variance decomposition: live intraday — 20260901 session, bracketed against its trailing-year range. Factor returns are trailing through last close. Total cross-sectional dispersion: 1.6%ile of the past year.
Variance mix — % of total, today vs 1d ago vs 1-yr avg
market 80%ile style 94.8%ile thematic 37%ile idiosyncratic 6.0%ile
Variance explained — today vs. factor's trailing-year range
Marker = the factor's share of today's total variance, placed in its own trailing-year range (box 25–75%ile, ticks 90%ile and max). Amber marker = unusually load-bearing today (≥90%ile of its own year). Factor name green = up today / red = down.
Correlation & dispersion — realized vs implied
Pairwise realized correlation (20d): 5.99% 0.9%ile since 2020 · 24%ile 3m most extreme since 2026-07-31
Top-500 pairwise: 4.14% 0.1%ile since 2020 · 0.0%ile 3m · implied (Cboe COR1M): 10.06 3.9%ile of its own history (gap -5.9pp)
Realized 20d vol (ann. pts): all stocks 41 vs VIXEQ 36 · index 8 vs VIX 16 · style factors 18 65%ile
20-day window (19 completed days + today); percentiles vs model history since 2020; '3m' tokens rank vs the trailing 63 trading days; definitions in Terms below. Implied prints (Cboe) are delayed ~15 min. as of 07:58 ET
Top 50 high-beta momentum names (eq-wt, since-2020 rank): -1.8% 22%ile · rest of market -0.1%
| Factor | Today | 1d | 5d | 20d | 60d |
|---|---|---|---|---|---|
| Style-Risk | |||||
| Beta | -0.90% z-0.9 | +0.16% | -1.65% | -3.82% | -6.11% |
| Residual Volatility | -0.23% z-0.5 | +0.37% | +0.59% | +2.14% | +0.12% |
| International | +0.11% z+0.4 | +0.06% | -0.04% | +1.02% | -0.06% |
| Style | |||||
| Profitability | -0.05% z-0.3 | -0.11% | -0.12% | -1.35% | -1.90% |
| Value | +0.06% z+0.3 | -0.16% | +0.05% | -0.64% | -1.36% |
| Size | -0.08% z-0.2 | +0.11% | +0.66% | +0.16% | -1.10% |
| Growth | -0.05% z-0.2 | -0.14% | +0.26% | +0.34% | +2.54% |
| Leverage | +0.03% z+0.2 | -0.14% | -0.43% | -1.48% | -3.52% |
| Dividend Yield | +0.02% z+0.1 | +0.23% | +0.11% | +0.64% | -0.65% |
| Liquidity | -0.01% z-0.0 | +0.31% | +0.31% | +1.49% | -0.54% |
| Style-Momentum | |||||
| Medium-Term Momentum | -0.22% z-0.8 | +0.19% | +0.08% | +1.29% | +0.81% |
| Short-Term Momentum | -0.10% z-0.3 | +0.23% | -0.98% | -1.66% | -5.64% |
| One-Day Momentum | +0.07% z+0.2 | -0.17% | -0.86% | -1.92% | -1.69% |
| Long-Term Momentum | +0.08% z+0.1 | +0.21% | -0.19% | -1.25% | -4.50% |
| Style-Positioning | |||||
| Hedge-Fund Ownership | -0.04% z-0.4 | -0.12% | -0.27% | +0.32% | +1.23% |
| Short Interest | -0.01% z-0.1 | -0.04% | -0.18% | -0.30% | +1.00% |
| Style-Flow | |||||
| Morning Activity | -0.07% z-0.6 | +0.10% | +0.07% | +1.65% | +1.49% |
| Short-Sale Activity | +0.04% z+0.4 | -0.10% | -0.12% | +0.18% | -0.11% |
| Thematic | |||||
| Gold | -0.30% z-0.9 | +0.22% | -0.81% | +4.41% | +2.67% |
| Treasury (Duration) | +0.14% z+0.4 | -0.01% | -1.03% | -0.66% | +0.06% |
| Semiconductors | +0.17% z+0.3 | +0.58% | +0.42% | -1.96% | -5.99% |
| Bitcoin / Crypto | -0.08% z-0.2 | +0.48% | +0.93% | +2.32% | +1.73% |
| Oil | +0.11% z+0.2 | +0.70% | +1.20% | +3.55% | +0.86% |
| China | -0.03% z-0.1 | -0.12% | +0.51% | +0.36% | -0.37% |
5/20/60d windows include today's session; 1d is the previous session.
Pairwise realized correlation. Index variance net of the weighted idiosyncratic diagonal, over the cross terms — the estimator used for implied-correlation indices. 20-day window unless noted; history since 2020.
Market variance share. The fraction of cross-sectional variance explained by the market factor — the attribution companion to pairwise correlation, not a substitute for it.
Factor z-score. Today's factor return divided by its daily-return standard deviation over ~1,600 trading days.
Stock-specific (idiosyncratic) return. The part of a stock's move not explained by market, style, or thematic factors in our decomposition.
VIXEQ / DSPX / COR1M. Cboe implied indices: single-stock volatility, dispersion, and 1-month implied correlation (top-50 S&P names). Quotes delayed ~15 minutes.
Data compiled by FactorPulse AI; edited and verified by Jeff Klein. For informational purposes only. Does not constitute financial advice, an investment recommendation, or an offer to buy or sell any securities. Always consult a qualified financial professional before making investment decisions.
For more on factor construction methodology, see www.factorpulse.com/glossary.