Edison International closed the regular session down -22.80% and PG&E down -19.94%, their steepest declines in years, after California's wildfire bill moved forward stripped of the measures that would have shielded investor-owned utilities from claims for disasters they causeBloomberg. Aon closed -9.80% on the same text, which raises professional liability exposure for the brokers placing wildfire coverBloomberg. Accounts differ on where the bill actually stands: Bloomberg dates the introduction to August 29 and notes the omitted protections Governor Newsom sought, while a separate account has it signed Monday as SB 492. Neither the tape nor the liability math waited for that distinction.
The complex around them was left alone. XLU fell -1.21% on 1.7× the typical session pace — heavy trading, no sector-wide markdown. Sempra, down -3.08%, was the only meaningful read-across the model picked up beyond the two. The Dividend Yield factor actually paid, +0.22% at z=+1.3, and it paid from the bottom of the exposure ladder: the zero-payout names — Caesars, Penn Entertainment, Brookdale, CarMax, United Parks — lagged by roughly -0.8% as a group. And the largest market-value swing of the session was upward, Tesla +5.50% adding $75.6B ahead of the Cybercab launchBloomberg.
| Factor | Return | Z-Score | 5d Z | 20d Z | 63d Z | Category | Direction |
|---|---|---|---|---|---|---|---|
| Bitcoin / Crypto | +0.47% | z=+1.6 | +1.53 | +1.72 | +1.00 | Thematic | High-exposure names outperformed |
| Oil | +0.70% | z=+1.5 | +0.89 | +1.50 | -0.27 | Thematic | Oil-levered names outperformed |
| Dividend Yield | +0.22% | z=+1.3 | +0.23 | +0.97 | -0.42 | Style | Higher payout outperformed |
| Hedge-Fund Ownership | -0.13% | z=-1.2 | -0.68 | +0.45 | +1.14 | Positioning | Hedge-fund-owned names lagged |
| Liquidity | +0.27% | z=+1.0 | +0.55 | +1.47 | -0.67 | Style | Highest-turnover names outperformed |
| Semiconductors | +0.57% | z=+0.9 | +0.1 | -0.6 | -0.9 | Thematic | Chip-exposed names outperformed |
| Short-Term Momentum | +0.21% | z=+0.7 | -0.94 | -1.50 | -3.64 | Style-Momentum | Week-old winners continued |
| One-Day Momentum | -0.18% | z=-0.7 | -1.4 | -1.8 | -0.9 | Style-Momentum | Yesterday's movers gave back |
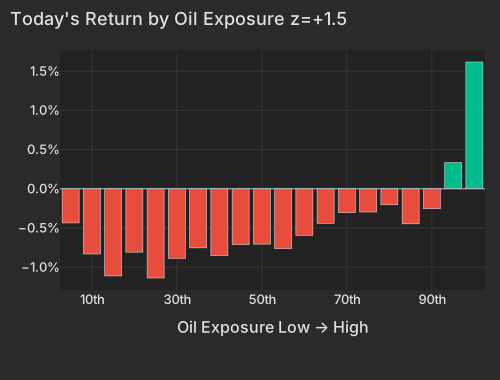
Brent for November traded above $90 and WTI above $86 after the U.S. strike on Iranian rocket launchers in the Strait of Hormuz and Iran's retaliationBloombergNYT. The Oil factor took 4.4% of cross-sectional variance today, a 95.7th-percentile variance contribution for that factor since 2020, and the money went to the top of the exposure ladder — the most oil-levered bucket +1.6%. Energy's median stock rose +1.61%, with Exxon +2.55% and Petrobras +4.27%.
| Bucket | Avg Ret Pct |
|---|---|
| 1 | -0.44 |
| 2 | -0.83 |
| 3 | -1.11 |
| 4 | -0.81 |
| 5 | -1.14 |
| 6 | -0.89 |
| 7 | -0.75 |
| 8 | -0.85 |
| 9 | -0.71 |
| 10 | -0.71 |
| 11 | -0.76 |
| 12 | -0.59 |
| 13 | -0.44 |
| 14 | -0.31 |
| 15 | -0.30 |
| 16 | -0.20 |
| 17 | -0.45 |
| 18 | -0.26 |
| 19 | 0.33 |
| 20 | 1.62 |
| ETF | Theme | Today | 1d Ago | 5d Ago | 20d Ago | 63d Ago |
|---|---|---|---|---|---|---|
| USO | oil | +3.24% | -0.24% | -3.67% | +0.41% | +0.47% |
| XLE | energy | +2.05% | +0.63% | -1.51% | +5.26% | +11.35% |
| XOP | E&P | +1.67% | +0.25% | -1.90% | +4.81% | +13.38% |
| BITO | crypto | +1.93% | -3.06% | +0.38% | +22.65% | +4.29% |
| WGMI | crypto miners | +1.13% | -8.09% | -6.63% | -17.02% | -37.29% |
| XLU | utilities | -1.21% | -1.04% | -0.09% | -3.65% | -3.80% |
| ITA | defense | -1.90% | -0.61% | -1.90% | -2.85% | -1.11% |
| XAR | defense | -1.74% | -1.60% | -4.01% | -1.16% | -9.10% |
| SPY | large cap | -0.26% | -0.23% | +0.47% | +2.99% | +1.70% |
The defense primes went the other way into a live exchange of fire, ITA -1.90% and XAR extending a slide that runs -9.10% over 63 sessions. SAIC was the exception, up 8% on the strikesBloomberg; Howmet's -7.39% was the stock's own problem rather than the group's, and the driver is not yet in the sourced coverage. The long end of the curve did the rest of the macro work: the 10-Year sits at 4.758%, up 3.6bpCNBC, while the 2-Year edged lower at 4.344%. Barclays now looks for two more hikes this yearEconomic Times, and the dollar still slipped, DXY -0.285% to 99.42CNBC — the friendlier half of the picture for crude-levered names.
Bitcoin / Crypto was the highest-conviction factor on the board, +0.47% at z=+1.6, and the exposure has been rewarded across every horizon the model measures. The axis accounted for 3.9 vol points of five-day variance, the most since November 2024. MSTR rose +4.33% with the Bitcoin factor accounting for nearly all of it; BITO's +1.93% sits on top of +22.65% over 20 sessions, while the miners have not come along at all.
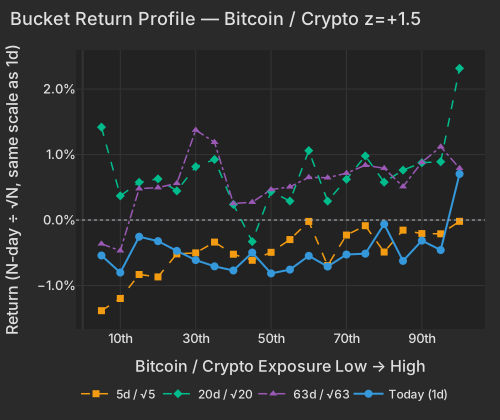
| Bucket | Ret 1D Pct | Ret 5D Norm Pct | Ret 20D Norm Pct | Ret 63D Norm Pct |
|---|---|---|---|---|
| 1 | -0.54 | -1.38 | 1.42 | -0.36 |
| 2 | -0.80 | -1.20 | 0.37 | -0.47 |
| 3 | -0.25 | -0.83 | 0.58 | 0.48 |
| 4 | -0.32 | -0.87 | 0.63 | 0.49 |
| 5 | -0.47 | -0.52 | 0.44 | 0.56 |
| 6 | -0.61 | -0.50 | 0.81 | 1.37 |
| 7 | -0.71 | -0.34 | 0.93 | 1.19 |
| 8 | -0.77 | -0.52 | 0.24 | 0.25 |
| 9 | -0.50 | -0.61 | -0.33 | 0.27 |
| 10 | -0.81 | -0.49 | 0.44 | 0.46 |
| 11 | -0.76 | -0.30 | 0.29 | 0.51 |
| 12 | -0.55 | -0.02 | 1.06 | 0.65 |
| 13 | -0.71 | -0.69 | 0.29 | 0.65 |
| 14 | -0.53 | -0.23 | 0.62 | 0.72 |
| 15 | -0.51 | -0.09 | 0.98 | 0.84 |
| 16 | -0.06 | -0.49 | 0.58 | 0.79 |
| 17 | -0.62 | -0.15 | 0.76 | 0.51 |
| 18 | -0.31 | -0.21 | 0.88 | 0.88 |
| 19 | -0.46 | -0.21 | 0.89 | 1.12 |
| 20 | 0.70 | -0.02 | 2.32 | 0.79 |
Those same names are why Short-Term Momentum printed positive. The factor returned +0.21% at z=+0.7 — last week's leaders extended — and its top exposure bucket was four crypto proxies averaging +7.0%, Semtech alongside them. One-Day Momentum ran the opposite way at -0.18%: yesterday's movers gave back what the week-old moves kept. That horizon split is the working state of the tape — continuation pays at a week, fades at a day.
Hold it against the stretch behind it. Short-Term Momentum sits at z=-3.64 on its 63-day window, -2.04% over 20 sessions and -6.51% over 60 — the deepest reversion signal in the style complex, and one green session does not end it.
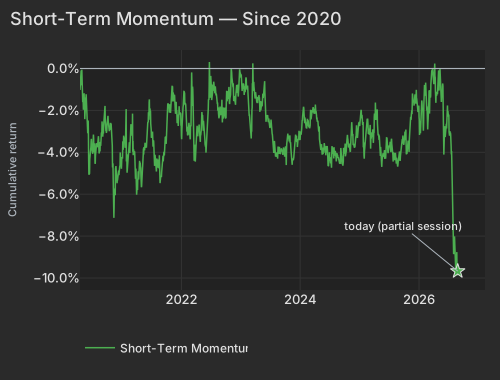
| Date | Cumret Pct |
|---|---|
| 2020-04-17 | -1.03 |
| 2020-05-11 | -1.40 |
| 2020-06-03 | -2.46 |
| 2020-06-25 | -3.47 |
| 2020-07-20 | -4.50 |
| 2020-08-11 | -3.41 |
| 2020-09-02 | -2.66 |
| 2020-09-25 | -2.71 |
| 2020-10-19 | -2.85 |
| 2020-11-10 | -5.85 |
| 2020-12-03 | -5.32 |
| 2020-12-28 | -4.36 |
| 2021-01-21 | -3.79 |
| 2021-02-12 | -4.07 |
| 2021-03-09 | -3.97 |
| 2021-03-31 | -5.62 |
| 2021-04-23 | -4.52 |
| 2021-05-17 | -3.75 |
| 2021-06-09 | -2.58 |
| 2021-07-01 | -3.31 |
| 2021-07-26 | -4.27 |
| 2021-08-17 | -4.76 |
| 2021-09-09 | -4.30 |
| 2021-10-01 | -3.12 |
| 2021-10-25 | -1.76 |
| 2021-11-16 | -1.38 |
| 2021-12-09 | -2.24 |
| 2022-01-03 | -3.19 |
| 2022-01-26 | -1.75 |
| 2022-02-17 | -2.59 |
| 2022-03-14 | -1.00 |
| 2022-04-05 | -3.16 |
| 2022-04-28 | -3.50 |
| 2022-05-20 | -2.78 |
| 2022-06-14 | -2.44 |
| 2022-07-08 | -1.45 |
| 2022-08-01 | -1.13 |
| 2022-08-23 | -2.30 |
| 2022-09-15 | -1.85 |
| 2022-10-07 | -1.06 |
| 2022-10-31 | -1.31 |
| 2022-11-22 | -1.44 |
| 2022-12-15 | -0.92 |
| 2023-01-10 | -0.71 |
| 2023-02-02 | -0.54 |
| 2023-02-27 | -2.36 |
| 2023-03-21 | -1.07 |
| 2023-04-13 | -1.65 |
| 2023-05-05 | -2.00 |
| 2023-05-30 | -0.60 |
| 2023-06-22 | -2.54 |
| 2023-07-17 | -3.15 |
| 2023-08-08 | -4.03 |
| 2023-08-30 | -3.89 |
| 2023-09-22 | -3.77 |
| 2023-10-16 | -3.49 |
| 2023-11-07 | -3.77 |
| 2023-11-30 | -3.83 |
| 2023-12-22 | -3.36 |
| 2024-01-18 | -2.28 |
| 2024-02-09 | -2.85 |
| 2024-03-05 | -2.72 |
| 2024-03-27 | -1.93 |
| 2024-04-19 | -2.60 |
| 2024-05-13 | -3.79 |
| 2024-06-05 | -4.02 |
| 2024-06-28 | -4.41 |
| 2024-07-23 | -4.05 |
| 2024-08-14 | -4.24 |
| 2024-09-06 | -4.44 |
| 2024-09-30 | -4.07 |
| 2024-10-22 | -3.32 |
| 2024-11-13 | -2.59 |
| 2024-12-06 | -3.42 |
| 2024-12-31 | -2.69 |
| 2025-01-27 | -3.76 |
| 2025-02-19 | -2.40 |
| 2025-03-13 | -3.24 |
| 2025-04-04 | -2.15 |
| 2025-04-29 | -3.16 |
| 2025-05-21 | -4.44 |
| 2025-06-13 | -3.86 |
| 2025-07-09 | -3.53 |
| 2025-07-31 | -4.27 |
| 2025-08-22 | -4.61 |
| 2025-09-16 | -3.98 |
| 2025-10-08 | -3.27 |
| 2025-10-30 | -3.76 |
| 2025-11-21 | -2.18 |
| 2025-12-16 | -1.49 |
| 2026-01-09 | -2.50 |
| 2026-02-03 | -1.77 |
| 2026-02-26 | -2.91 |
| 2026-03-20 | -0.18 |
| 2026-04-14 | -0.39 |
| 2026-05-06 | -1.01 |
| 2026-05-29 | -0.71 |
| 2026-06-23 | -2.86 |
| 2026-07-16 | -3.06 |
| 2026-08-07 | -8.23 |
| 2026-08-31 | -9.67 |
The structure underneath explains why the index never registered California at all. Single-stock variance took 78.5% of the cross-section today against a 66.5% one-year average, and 20-day realized correlation remains pinned near the lows it set on August 6 — 7.6% pairwise, the 2.2nd percentile since 2020 — with implied one-month single-stock correlation (Cboe COR1M) at 10.15, in the bottom 4% of its own 20-year history. SPY was down -0.26%. For a book carrying utility exposure, the loss this session was name selection, not a factor tilt; the factor risk was in Oil and crypto, and neither had anything to do with Sacramento.
The Dallas Fed Manufacturing Survey, released at 10:30 AM ET, showed general business activity at 11.6 against expectations near 0.7 — its highest since January 2025, with new orders up 16 points to 22.0. Employment cooled to 8.0 and raw-material prices stayed elevated at 44.1, a demand-strong, cost-sticky combination that gives the hawkish front-end view nothing to argue with.
Variance decomposition: live intraday — 20260831 session, bracketed against its trailing-year range. Factor returns are trailing through last close. Total cross-sectional dispersion: 6.4%ile of the past year.
Variance mix — % of total, today vs 1d ago vs 1-yr avg
market 52%ile style 9.2%ile thematic 99.6%ile idiosyncratic 66%ile
Variance explained — today vs. factor's trailing-year range
Marker = the factor's share of today's total variance, placed in its own trailing-year range (box 25–75%ile, ticks 90%ile and max). Amber marker = unusually load-bearing today (≥90%ile of its own year). Factor name green = up today / red = down.
Correlation & dispersion — realized vs implied
Pairwise realized correlation (20d): 7.56% 2.2%ile since 2020 · 29%ile 3m most extreme since 2026-08-06
Top-500 pairwise: 6.79% 2.1%ile since 2020 · 19%ile 3m · implied (Cboe COR1M): 10.15 4.0%ile of its own history (gap -3.4pp)
Realized 20d vol (ann. pts): all stocks 44 vs VIXEQ 36 · index 10 vs VIX 15 · style factors 19 69%ile
20-day window (19 completed days + today); percentiles vs model history since 2020; '3m' tokens rank vs the trailing 63 trading days; definitions in Terms below. Implied prints (Cboe) are delayed ~15 min. as of 15:58 ET
High-beta momentum cohort (eq-wt, since-2020 rank): -0.5% 35%ile · rest of market -0.5%
| Factor | Today | 1d | 5d | 20d | 60d |
|---|---|---|---|---|---|
| Style-Risk | |||||
| Residual Volatility | +0.35% z+0.7 | -0.11% | +0.96% | +3.10% | -1.38% |
| International | +0.08% z+0.2 | +0.22% | +0.12% | +0.45% | -0.50% |
| Beta | +0.14% z+0.1 | -1.79% | +0.37% | -0.75% | -8.84% |
| Style | |||||
| Dividend Yield | +0.22% z+1.3 | -0.18% | +0.09% | +0.76% | -0.92% |
| Liquidity | +0.27% z+1.0 | +0.05% | +0.33% | +1.78% | -0.81% |
| Leverage | -0.13% z-0.8 | -0.03% | -0.32% | -1.72% | -3.34% |
| Growth | -0.15% z-0.6 | +0.00% | +0.18% | +0.45% | +2.77% |
| Profitability | -0.10% z-0.6 | +0.22% | -0.27% | -1.16% | -1.64% |
| Value | -0.11% z-0.5 | +0.40% | -0.24% | -0.77% | -1.27% |
| Size | +0.12% z+0.3 | +0.58% | +0.68% | +0.03% | -1.28% |
| Style-Momentum | |||||
| Short-Term Momentum | +0.21% z+0.7 | -0.01% | -0.64% | -2.04% | -6.51% |
| One-Day Momentum | -0.18% z-0.7 | -0.49% | -0.90% | -2.26% | -1.47% |
| Medium-Term Momentum | +0.19% z+0.7 | -0.13% | +0.13% | +1.37% | +0.96% |
| Long-Term Momentum | +0.19% z+0.3 | -0.61% | -0.27% | -1.33% | -6.57% |
| Style-Positioning | |||||
| Hedge-Fund Ownership | -0.13% z-1.2 | -0.01% | -0.17% | +0.22% | +1.28% |
| Short Interest | -0.03% z-0.2 | -0.02% | -0.02% | +0.07% | +0.99% |
| Style-Flow | |||||
| Short-Sale Activity | -0.09% z-0.8 | +0.21% | -0.21% | +0.42% | -0.24% |
| Morning Activity | +0.09% z+0.7 | +0.04% | +0.12% | +1.71% | +1.34% |
| Thematic | |||||
| Bitcoin / Crypto | +0.47% z+1.6 | +0.12% | +1.04% | +2.33% | +2.16% |
| Oil | +0.70% z+1.5 | -0.00% | +0.95% | +3.18% | -1.05% |
| Semiconductors | +0.57% z+0.9 | -0.74% | +0.09% | -1.63% | -7.17% |
| Gold | +0.21% z+0.6 | -0.55% | +0.12% | +4.94% | +3.20% |
| China | -0.09% z-0.2 | +0.23% | +0.46% | +0.53% | -0.64% |
| Treasury (Duration) | -0.02% z-0.1 | -0.37% | -1.28% | -1.04% | -0.02% |
5/20/60d windows include today's session; 1d is the previous session.
Pairwise realized correlation. Index variance net of the weighted idiosyncratic diagonal, over the cross terms — the estimator used for implied-correlation indices. 20-day window unless noted; history since 2020.
Market variance share. The fraction of cross-sectional variance explained by the market factor — the attribution companion to pairwise correlation, not a substitute for it.
Factor z-score. Today's factor return divided by its daily-return standard deviation over ~1,600 trading days.
VIXEQ / DSPX / COR1M. Cboe implied indices: single-stock volatility, dispersion, and 1-month implied correlation (top-50 S&P names). Quotes delayed ~15 minutes.
Data compiled by FactorPulse AI; edited and verified by Jeff Klein. For informational purposes only. Does not constitute financial advice, an investment recommendation, or an offer to buy or sell any securities. Always consult a qualified financial professional before making investment decisions.
For more on factor construction methodology, see www.factorpulse.com/glossary.