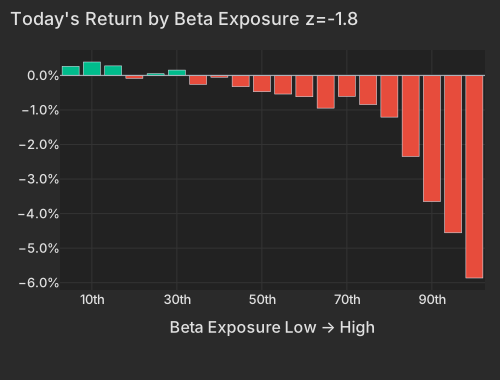
Warsh's hawkish Jackson Hole debut cost the index almost nothing and cost one trade almost everything: the top 50 high-beta momentum names fell -5.81% into the close while stocks in neither screen sat at -0.15%. Beta at z=-1.8 accounted for 26.9% of the day's cross-sectional variance, and effectively the whole of that effect sits in the single highest-exposure bucket. This was not a broad reduction of risk — hedge-fund-owned names and most shorted were both close to flat.
Kevin Warsh used his first Jackson Hole address to say inflation isn't slowing Bloomberg, and Philadelphia Fed President Patrick Harker added the same day that a hike would be an "important signal" to the market Bloomberg. The front end took him at his word: the 2-year yield rose 12.4 basis points to 4.36% while the 30-year added only 2.2 CNBC. The dollar firmed +0.51% to 99.67 CNBC. At the index level equities barely engaged — SPY -0.26% — and in the cross-section they engaged completely.
| Factor | Return | Z-Score | 5d Z | 20d Z | 63d Z | Category | Direction |
|---|---|---|---|---|---|---|---|
| Beta | -1.73% | -1.8 | -0.5 | +0.2 | -1.2 | Style-Risk | Most market-sensitive names lagged |
| Short-Sale Activity | +0.19% | +1.8 | -0.7 | +1.1 | +0.5 | Style-Flow | Most heavily short-sold names outperformed |
| One-Day Momentum | -0.50% | -1.7 | -1.2 | -1.2 | -0.1 | Style-Momentum | Yesterday's gainers reversed |
| Gold | -0.55% | -1.7 | -0.1 | +3.1 | +0.8 | Thematic | Gold-exposed names lagged |
| Value | +0.39% | +1.7 | -0.1 | -0.4 | -0.5 | Style | Cheapest names outperformed |
| Size | +0.54% | +1.5 | +1.0 | -0.2 | -0.5 | Style | Large caps outperformed |
| Semiconductors | -0.74% | -1.2 | -0.8 | -1.2 | -1.3 | Thematic | Semis exposure lagged |
| Treasury (Duration) | -0.38% | -1.2 | -1.9 | -0.8 | -0.3 | Thematic | Long-duration names lagged |
Beta was the axis. The factor returned -1.73% at z=-1.8 and accounted for 26.9% of the day's cross-sectional variance, its top bracket against the past year — the exposure a levered book actually loads on has rarely been this load-bearing. The shape says more than the level: the highest-exposure bucket lost -5.9% and the rest of the distribution scarcely moved.
| Bucket | Avg Ret Pct |
|---|---|
| 1 | 0.26 |
| 2 | 0.39 |
| 3 | 0.28 |
| 4 | -0.08 |
| 5 | 0.05 |
| 6 | 0.15 |
| 7 | -0.26 |
| 8 | -0.05 |
| 9 | -0.33 |
| 10 | -0.47 |
| 11 | -0.54 |
| 12 | -0.62 |
| 13 | -0.95 |
| 14 | -0.61 |
| 15 | -0.84 |
| 16 | -1.21 |
| 17 | -2.35 |
| 18 | -3.65 |
| 19 | -4.56 |
| 20 | -5.86 |
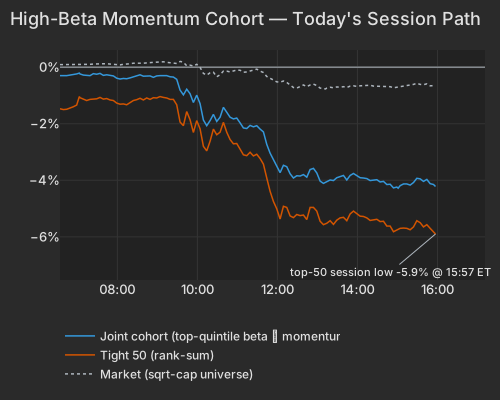
The high-beta momentum cohort puts a number on the same fact. The top 50 names fell -5.81%, ranked 49th worst of 1,672 days since 2020, and the wider joint screen -4.16%; names in neither screen sat at -0.15%. The more precisely a name fit the profile, the harder it fell — the top-50 move ran 1.4 times the wider group's against a 1.14 norm — and the low printed at 15:57, with nothing coming back into the bell.
| Series | Ret Pct |
|---|---|
| joint | -4.16 |
| tight50 | -5.81 |
| market | -0.66 |
| rest | -0.15 |
The instruments that expressed it were the ones with the largest trailing-month gains behind them. Uranium and gold miners led the 20-day tables and led the decline; crypto miners, already deep in a three-month drawdown, simply kept going. URA -5.25% and NLR -4.96% both traded at roughly 2.1× the typical session pace, on a day the EIA eia.gov reported U.S. uranium production more than tripled in 2025 EIA.
| ETF | Theme | Today | 1d Ago | 5d Ago | 20d Ago | 63d Ago |
|---|---|---|---|---|---|---|
| WGMI | crypto miners | -8.10% | +2.88% | -0.98% | -12.12% | -32.92% |
| URA | uranium | -5.25% | +0.67% | +10.33% | +21.78% | -4.69% |
| GDX | gold miners | -3.99% | +1.24% | +3.85% | +35.05% | +18.94% |
| ARKK | innovation growth | -3.42% | +1.87% | +4.94% | +19.86% | +7.86% |
| SMH | semiconductors | -3.42% | +3.10% | +1.84% | +6.33% | -4.47% |
| IWM | small cap | -1.36% | +0.29% | +0.72% | +2.47% | +2.66% |
| SPY | large cap | -0.26% | +0.66% | +1.11% | +3.97% | +2.19% |
| XLF | financials | +0.30% | -0.65% | +1.63% | +1.54% | +12.89% |
| XLY | consumer discretionary | +1.12% | -1.09% | -0.69% | +3.11% | -5.06% |
Hedge-Fund Ownership did not move: z=-0.16 residualized and z=+0.06 raw. Flat on both is the version that means the hedge-fund-owned names genuinely were not the ones being hit, rather than being hit through their style tilts. The top-50 high-beta momentum names carry a flat hedge-fund tilt and sit modestly less shorted than the universe at -0.58σ; their standout characteristic is a habitually retail-heavy trading profile, +1.2σ on morning activity.
Short-Sale Activity returned +0.19% at z=+1.8, a print in the 98th percentile since 2020: the most heavily short-sold names outperformed the barely-shorted ones, and yesterday's short-sale flow lost money on a one-day view. That is the model's single most statistically reliable effect running backwards for a session. Value +0.39% and Size +0.54% are the same day from the other end — the cheap and the large is where money sat still. Long-Term Momentum -0.62% is those same high-beta names wearing a second label; its exposures correlate 0.60 with the screen. Style factors took 37.1% of cross-sectional variance against a 21.7% one-year average while the stock-specific share fell to 50.4% from 66.5%, and implied index volatility finished at 14.45 versus 14.51 yesterday. The index never noticed what happened underneath it.
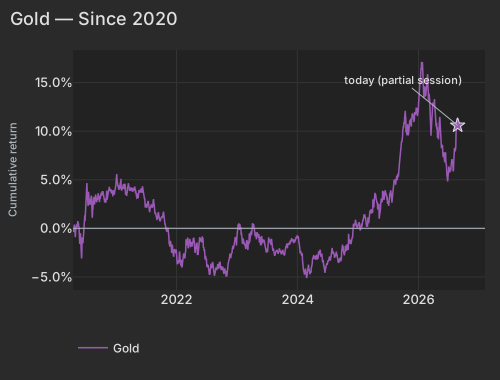
Gold turned at z=-1.7 after a 20-day run at z=+3.1. GDX fell -3.99% having gained +35.05% over 20 sessions; SLV -4.41% and GLD -3.24% both traded at 2.6× their typical pace as the metals complex reversed on the Jackson Hole remarks Economic Times. Miners were the sharp end: the highest-gold-exposure bucket lost -4.4% against a factor return of -0.55%.
| Date | Cumret Pct |
|---|---|
| 2020-04-16 | -0.16 |
| 2020-05-08 | 0.17 |
| 2020-06-02 | -0.95 |
| 2020-06-24 | 0.95 |
| 2020-07-17 | 2.79 |
| 2020-08-10 | 2.06 |
| 2020-09-01 | 3.45 |
| 2020-09-24 | 2.86 |
| 2020-10-16 | 3.46 |
| 2020-11-09 | 2.94 |
| 2020-12-02 | 3.89 |
| 2020-12-24 | 3.80 |
| 2021-01-20 | 4.24 |
| 2021-02-11 | 4.43 |
| 2021-03-08 | 3.33 |
| 2021-03-30 | 3.83 |
| 2021-04-22 | 4.12 |
| 2021-05-14 | 3.08 |
| 2021-06-08 | 3.65 |
| 2021-06-30 | 2.55 |
| 2021-07-23 | 1.65 |
| 2021-08-16 | 2.98 |
| 2021-09-08 | 1.28 |
| 2021-09-30 | 0.97 |
| 2021-10-22 | 0.66 |
| 2021-11-15 | -0.28 |
| 2021-12-08 | -1.68 |
| 2021-12-31 | -2.26 |
| 2022-01-25 | -3.36 |
| 2022-02-16 | -2.81 |
| 2022-03-11 | -1.05 |
| 2022-04-04 | -1.40 |
| 2022-04-27 | -2.14 |
| 2022-05-19 | -1.19 |
| 2022-06-13 | -1.38 |
| 2022-07-07 | -3.75 |
| 2022-07-29 | -3.65 |
| 2022-08-22 | -4.67 |
| 2022-09-14 | -4.16 |
| 2022-10-06 | -4.31 |
| 2022-10-28 | -4.89 |
| 2022-11-21 | -2.75 |
| 2022-12-14 | -1.75 |
| 2023-01-09 | 0.37 |
| 2023-02-01 | -0.85 |
| 2023-02-24 | -2.13 |
| 2023-03-20 | -0.62 |
| 2023-04-12 | 0.01 |
| 2023-05-04 | -0.40 |
| 2023-05-26 | -1.52 |
| 2023-06-21 | -1.76 |
| 2023-07-14 | -1.24 |
| 2023-08-07 | -2.14 |
| 2023-08-29 | -2.31 |
| 2023-09-21 | -2.44 |
| 2023-10-13 | -2.52 |
| 2023-11-06 | -1.78 |
| 2023-11-29 | -1.02 |
| 2023-12-21 | -1.13 |
| 2024-01-17 | -1.95 |
| 2024-02-08 | -4.09 |
| 2024-03-04 | -4.53 |
| 2024-03-26 | -4.56 |
| 2024-04-18 | -3.04 |
| 2024-05-10 | -2.37 |
| 2024-06-04 | -3.51 |
| 2024-06-27 | -3.81 |
| 2024-07-22 | -3.21 |
| 2024-08-13 | -2.70 |
| 2024-09-05 | -3.44 |
| 2024-09-27 | -2.12 |
| 2024-10-21 | -1.83 |
| 2024-11-12 | -1.49 |
| 2024-12-05 | 0.40 |
| 2024-12-30 | 0.01 |
| 2025-01-24 | 0.49 |
| 2025-02-18 | 1.10 |
| 2025-03-12 | 1.26 |
| 2025-04-03 | 2.98 |
| 2025-04-28 | 2.84 |
| 2025-05-20 | 2.02 |
| 2025-06-12 | 3.32 |
| 2025-07-08 | 2.31 |
| 2025-07-30 | 2.76 |
| 2025-08-21 | 5.05 |
| 2025-09-15 | 7.48 |
| 2025-10-07 | 10.36 |
| 2025-10-29 | 10.21 |
| 2025-11-20 | 10.66 |
| 2025-12-15 | 11.78 |
| 2026-01-08 | 13.74 |
| 2026-02-02 | 14.17 |
| 2026-02-25 | 14.98 |
| 2026-03-19 | 9.93 |
| 2026-04-13 | 12.59 |
| 2026-05-05 | 9.16 |
| 2026-05-28 | 8.60 |
| 2026-06-22 | 6.58 |
| 2026-07-15 | 6.21 |
| 2026-08-06 | 6.94 |
| 2026-08-28 | 10.59 |
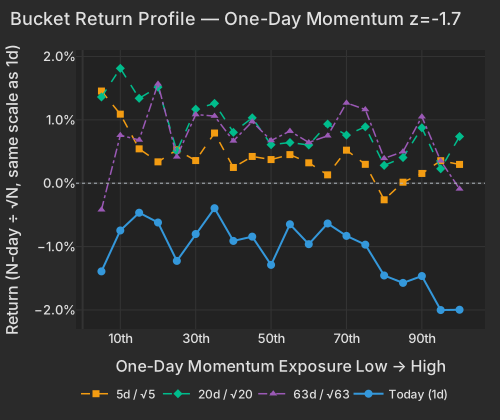
One-Day Momentum at z=-1.7 is not a fresh development either. The factor has run -1.54% over 20 sessions with the 5-day and 20-day z both at -1.2, and its bucket slope points the same way at every horizon. Today the top bucket — yesterday's biggest gainers — fell -2.0% and drove the spread.
| Bucket | Ret 1D Pct | Ret 5D Norm Pct | Ret 20D Norm Pct | Ret 63D Norm Pct |
|---|---|---|---|---|
| 1 | -1.39 | 1.45 | 1.36 | -0.42 |
| 2 | -0.75 | 1.09 | 1.81 | 0.76 |
| 3 | -0.47 | 0.54 | 1.34 | 0.68 |
| 4 | -0.62 | 0.34 | 1.52 | 1.57 |
| 5 | -1.23 | 0.53 | 0.51 | 0.42 |
| 6 | -0.80 | 0.36 | 1.17 | 1.08 |
| 7 | -0.39 | 0.79 | 1.26 | 1.06 |
| 8 | -0.91 | 0.25 | 0.80 | 0.67 |
| 9 | -0.84 | 0.42 | 1.03 | 0.97 |
| 10 | -1.29 | 0.37 | 0.61 | 0.67 |
| 11 | -0.65 | 0.45 | 0.64 | 0.82 |
| 12 | -0.96 | 0.32 | 0.60 | 0.64 |
| 13 | -0.64 | 0.13 | 0.93 | 0.75 |
| 14 | -0.83 | 0.52 | 0.76 | 1.27 |
| 15 | -0.97 | 0.30 | 0.89 | 1.16 |
| 16 | -1.46 | -0.26 | 0.28 | 0.39 |
| 17 | -1.57 | 0.02 | 0.41 | 0.50 |
| 18 | -1.46 | 0.15 | 0.87 | 1.05 |
| 19 | -2.00 | 0.36 | 0.23 | 0.35 |
| 20 | -2.00 | 0.30 | 0.74 | -0.09 |
Marvell closed the regular session -10.01% and slipped a further -0.55% after the bell, erasing $22.6B of market value, after a beat-and-raise met a gross-margin guide of 57.5–58.5% on custom-silicon mix CNBC. The split is the part worth knowing: roughly half the decline was style, almost all of it beta, and half the company's own news — even the marquee semiconductor loser was as much today's factor complex as its own print. Elastic closed +19.23% on a Q1 beat and raised FY27 guidance CNBC, and Gap closed +12.96% Bloomberg.
PayPal -12.65% was the day's largest stock-specific move with essentially none of it factor-carried Bloomberg. PG&E -7.41% was the second, on a California utility-liability development our source set does not carry. Nvidia -4.53% shed $269B of market value in the session after its print, more than half of that its own move rather than the beta complex. Three of the four largest moves on the board were company stories on a day the story was a Fed speech.
The University of Michigan data.sca.isr.umich.edu's final August sentiment survey, released at 10:00 AM ET, showed the index at 51.7, a 6.3% monthly decline from July's 55.2, with one-year inflation expectations cooling to 4.0% and long-run expectations firm at 3.3%. The New York Fed's staff nowcast, published at 12:45 PM ET, trimmed Q3 GDP bea.gov to 2.2% from 2.3%, and revised BLS data released Friday cut private-sector employment by 79,000 jobs through March — a softer labor picture arriving the same morning the Fed chair ruled out reading inflation as beaten.
Variance decomposition: live intraday — 20260828 session, bracketed against its trailing-year range. Factor returns are trailing through last close. Total cross-sectional dispersion: 45%ile of the past year.
Variance mix — % of total, today vs 1d ago vs 1-yr avg
market 64%ile style 92.0%ile thematic 85%ile idiosyncratic 12%ile
Variance explained — today vs. factor's trailing-year range
Marker = the factor's share of today's total variance, placed in its own trailing-year range (box 25–75%ile, ticks 90%ile and max). Amber marker = unusually load-bearing today (≥90%ile of its own year). Factor name green = up today / red = down.
Correlation & dispersion — realized vs implied
Pairwise realized correlation (20d): 8.65% 5.1%ile since 2020 · 64%ile 3m
Top-500 pairwise: 9.19% 5.2%ile since 2020 · 30%ile 3m · implied (Cboe COR1M): 8.89 2.5%ile of its own history (gap +0.3pp)
Realized 20d vol (ann. pts): all stocks 44 vs VIXEQ 35 · index 11 vs VIX 14 · style factors 20 73%ile
20-day window (19 completed days + today); percentiles vs model history since 2020; '3m' tokens rank vs the trailing 63 trading days; definitions in Terms below. Implied prints (Cboe) are delayed ~15 min. as of 15:58 ET
Top 50 high-beta momentum names (eq-wt, since-2020 rank): -5.8% 2.9%ile · rest of market -0.1%
| Factor | Today | 1d | 5d | 20d | 60d |
|---|---|---|---|---|---|
| Style-Risk | |||||
| Beta | -1.73% z-1.8 | +0.84% | -1.12% | +0.75% | -9.20% |
| International | +0.19% z+0.6 | -0.15% | -0.03% | -0.26% | -0.72% |
| Residual Volatility | -0.13% z-0.2 | +0.75% | +0.16% | +3.30% | -1.98% |
| Style | |||||
| Value | +0.39% z+1.6 | -0.45% | -0.03% | -0.43% | -1.16% |
| Size | +0.54% z+1.5 | +0.07% | +0.78% | -0.34% | -1.65% |
| Profitability | +0.21% z+1.1 | -0.34% | -0.00% | -1.36% | -1.95% |
| Dividend Yield | -0.17% z-1.0 | +0.01% | -0.23% | +0.52% | -1.10% |
| Leverage | -0.03% z-0.2 | -0.27% | -0.21% | -1.71% | -3.26% |
| Growth | +0.01% z+0.1 | +0.33% | +0.24% | +0.75% | +2.95% |
| Liquidity | +0.00% z+0.0 | +0.09% | -0.22% | +1.72% | -1.18% |
| Style-Momentum | |||||
| One-Day Momentum | -0.50% z-1.8 | +0.05% | -0.78% | -1.54% | -1.59% |
| Long-Term Momentum | -0.62% z-0.9 | -0.14% | -0.91% | -2.58% | -7.59% |
| Medium-Term Momentum | -0.15% z-0.5 | +0.35% | +0.01% | +0.98% | +0.69% |
| Short-Term Momentum | -0.01% z-0.1 | -0.30% | -0.63% | -2.11% | -7.30% |
| Style-Positioning | |||||
| Short Interest | -0.04% z-0.2 | +0.01% | +0.05% | +0.03% | +1.00% |
| Hedge-Fund Ownership | -0.01% z-0.1 | -0.13% | +0.05% | +0.48% | +1.46% |
| Style-Flow | |||||
| Short-Sale Activity | +0.19% z+1.8 | -0.27% | -0.17% | +0.53% | -0.07% |
| Morning Activity | +0.07% z+0.5 | +0.17% | -0.00% | +1.84% | +1.17% |
| Thematic | |||||
| Gold | -0.55% z-1.7 | +0.30% | -0.03% | +4.49% | +3.28% |
| Semiconductors | -0.74% z-1.2 | -0.28% | -1.15% | -3.26% | -8.60% |
| Treasury (Duration) | -0.38% z-1.1 | -0.45% | -1.37% | -1.20% | -0.03% |
| China | +0.23% z+0.6 | +0.53% | +0.39% | +0.45% | -0.45% |
| Bitcoin / Crypto | +0.07% z+0.2 | +0.76% | +0.66% | +1.49% | +1.73% |
| Oil | -0.02% z-0.1 | +0.45% | -0.28% | +2.22% | -2.34% |
5/20/60d windows include today's session; 1d is the previous session.
Market variance share. The fraction of cross-sectional variance explained by the market factor — the attribution companion to pairwise correlation, not a substitute for it.
Factor z-score. Today's factor return divided by its daily-return standard deviation over ~1,600 trading days.
High-beta momentum cohort. US names above $2B market cap in the top quintile of both raw beta and 12-month momentum; membership frozen at each month's first business day. “Top 50” = the 50 strongest by combined rank.
Stock-specific (idiosyncratic) return. The part of a stock's move not explained by market, style, or thematic factors in our decomposition.
Data compiled by FactorPulse AI; edited and verified by Jeff Klein. For informational purposes only. Does not constitute financial advice, an investment recommendation, or an offer to buy or sell any securities. Always consult a qualified financial professional before making investment decisions.
For more on factor construction methodology, see www.factorpulse.com/glossary.