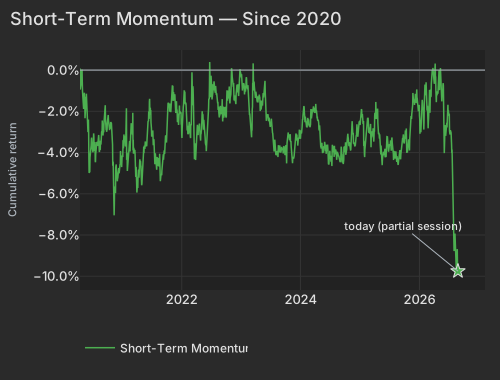
Through Thursday's close, Short-Term Momentum has recorded the weakest 63-day cumulative return in the model's history since 2020: the fast end of the cross-section has spent three months punishing whatever led the prior week. This morning is the same pattern in miniature, with Thursday's software and semiconductor winners handing back gains and Liquidity (z=-1.1) putting the pressure squarely on the highest-turnover, most heavily optioned AI names. The event that can break it is Kevin Warsh's first Jackson Hole address as Fed chair, later today.
The number that matters this morning printed at last night's close. Short-Term Momentum's trailing 60-day return is -7.25%, and the completed 63-day window through Thursday is the weakest of all 1,538 overlapping windows since 2020 (z=-3.7). Last week's leaders were faded, and the week before that, and the week before that. Composition is the part that gets misread: the basket re-sorts every week, so after a rebound week its winners are largely the names that crashed the week before. What the record describes is a recurring pattern, each leg faded in turn, not one position being ground lower.
| Date | Cumret Pct |
|---|---|
| 2020-04-16 | 0.08 |
| 2020-05-08 | -1.89 |
| 2020-06-02 | -2.45 |
| 2020-06-24 | -3.65 |
| 2020-07-17 | -3.50 |
| 2020-08-10 | -3.15 |
| 2020-09-01 | -2.44 |
| 2020-09-24 | -2.91 |
| 2020-10-16 | -2.78 |
| 2020-11-09 | -5.20 |
| 2020-12-02 | -5.39 |
| 2020-12-24 | -4.54 |
| 2021-01-20 | -3.65 |
| 2021-02-11 | -4.17 |
| 2021-03-08 | -2.07 |
| 2021-03-30 | -5.09 |
| 2021-04-22 | -4.42 |
| 2021-05-14 | -4.03 |
| 2021-06-08 | -2.56 |
| 2021-06-30 | -2.83 |
| 2021-07-23 | -4.04 |
| 2021-08-16 | -4.56 |
| 2021-09-08 | -4.17 |
| 2021-09-30 | -3.52 |
| 2021-10-22 | -1.62 |
| 2021-11-15 | -1.21 |
| 2021-12-08 | -2.52 |
| 2021-12-31 | -2.46 |
| 2022-01-25 | -1.55 |
| 2022-02-16 | -2.69 |
| 2022-03-11 | -0.78 |
| 2022-04-04 | -3.42 |
| 2022-04-27 | -3.24 |
| 2022-05-19 | -2.57 |
| 2022-06-13 | -2.71 |
| 2022-07-07 | -1.43 |
| 2022-07-29 | -0.77 |
| 2022-08-22 | -2.30 |
| 2022-09-14 | -1.97 |
| 2022-10-06 | -1.20 |
| 2022-10-28 | -1.31 |
| 2022-11-21 | -1.47 |
| 2022-12-14 | -0.69 |
| 2023-01-09 | -0.81 |
| 2023-02-01 | -0.84 |
| 2023-02-24 | -2.11 |
| 2023-03-20 | -0.29 |
| 2023-04-12 | -1.54 |
| 2023-05-04 | -1.47 |
| 2023-05-26 | -0.70 |
| 2023-06-21 | -2.47 |
| 2023-07-14 | -3.04 |
| 2023-08-07 | -4.03 |
| 2023-08-29 | -3.66 |
| 2023-09-21 | -3.83 |
| 2023-10-13 | -3.35 |
| 2023-11-06 | -3.44 |
| 2023-11-29 | -3.92 |
| 2023-12-21 | -3.31 |
| 2024-01-17 | -2.41 |
| 2024-02-08 | -2.67 |
| 2024-03-04 | -2.69 |
| 2024-03-26 | -1.86 |
| 2024-04-18 | -2.45 |
| 2024-05-10 | -3.68 |
| 2024-06-04 | -3.85 |
| 2024-06-27 | -4.29 |
| 2024-07-22 | -3.91 |
| 2024-08-13 | -4.35 |
| 2024-09-05 | -4.47 |
| 2024-09-27 | -3.81 |
| 2024-10-21 | -3.09 |
| 2024-11-12 | -2.75 |
| 2024-12-05 | -3.65 |
| 2024-12-30 | -2.49 |
| 2025-01-24 | -2.47 |
| 2025-02-18 | -2.44 |
| 2025-03-12 | -3.74 |
| 2025-04-03 | -2.24 |
| 2025-04-28 | -3.11 |
| 2025-05-20 | -4.61 |
| 2025-06-12 | -4.22 |
| 2025-07-08 | -3.68 |
| 2025-07-30 | -3.93 |
| 2025-08-21 | -4.41 |
| 2025-09-15 | -3.80 |
| 2025-10-07 | -3.34 |
| 2025-10-29 | -3.36 |
| 2025-11-20 | -1.92 |
| 2025-12-15 | -1.56 |
| 2026-01-08 | -2.62 |
| 2026-02-02 | -2.52 |
| 2026-02-25 | -2.30 |
| 2026-03-19 | -0.27 |
| 2026-04-13 | -0.32 |
| 2026-05-05 | -0.01 |
| 2026-05-28 | -0.76 |
| 2026-06-22 | -2.56 |
| 2026-07-15 | -3.06 |
| 2026-08-06 | -8.50 |
| 2026-08-28 | -9.75 |
The fast end has decayed, and that is the limit on the record. Today's print is +0.04% (z=+0.1), no reversion at all. The five-day z is -0.9 and the 20-day z=-1.5 against the 63-day's -3.7, and the trailing five-day cumulative return is only -0.58%: most of the damage is more than a month old. Implied single-stock volatility (Cboe VIXEQ) at 36.52 against implied index volatility (Cboe VIX) at 14.48 is the environment this pattern feeds on — single names churning under a quiet index.
The mechanism behind a run this deep is documented. Goldman Sachs Prime Brokerage disclosed that 16% of its total prime-brokerage exposure sat in AI memory-related names as of mid-2026, with margin calls following July's drop in AI stocks; a three-month reversion run of this depth is indicative of the deleveraging and releveraging churn that follows an episode like that.
| Factor | Return | Z-Score | 5d Z | 20d Z | 63d Z | Category | Direction |
|---|---|---|---|---|---|---|---|
| Short-Term Momentum | +0.04% | +0.1 | -0.9 | -1.5 | -3.7 | Style-Momentum | Flat today, reversion at the quarter |
| Liquidity | -0.31% | -1.1 | -0.9 | +1.2 | -0.9 | Style | Lowest-turnover names led |
| Beta | -0.31% | -0.3 | +0.1 | +0.5 | -1.0 | Style-Risk | High-sensitivity names lagged |
| Semiconductors | -0.27% | -0.5 | -0.5 | -1.0 | -1.2 | Thematic | Continuation of a 20-day drag |
| One-Day Momentum | -0.10% | -0.4 | -0.6 | -0.9 | +0.1 | Style-Momentum | Thursday's movers reversing |
| International | +0.15% | +0.5 | -0.1 | -0.2 | -0.2 | Style-Risk | US-listed international names led |
| Gold | +0.01% | +0.0 | +0.7 | +3.5 | +1.1 | Thematic | Flat after a top-percentile 20 days |
| Hedge-Fund Ownership | -0.03% | -0.3 | +0.1 | +1.0 | +1.2 | Style-Positioning | Marginal give-back |
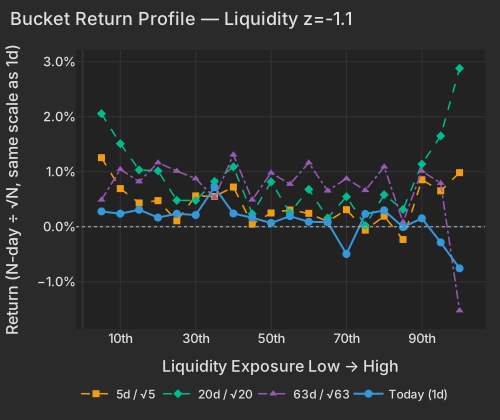
Liquidity carries this morning's cross-section: -0.31% at z=-1.1, a return in the 4.5th percentile since 2020, and 3.1% of cross-sectional variance — above its 90th percentile of the past year, so the axis is doing unusual work for a session that has not opened. The direction is specific. The lowest-turnover names outperformed the highest-turnover ones, and the losing end is the top-turnover bucket at -0.76%. That bucket is where the heaviest options activity sits, and this morning it is AI, semiconductor and data-center names — SNDK, IREN, BBAI and LUNR among them, -2.37% weighted across the five.
These are not company stories. Sandisk is -2.29% with the factor complex accounting for -3.58% and the stock's own move a positive +1.20%; AXT is -2.87% against -3.80% from factors. The top 50 high-beta momentum names are -1.19% while everything outside that screen is +0.16%.
| Bucket | Ret 1D Pct | Ret 5D Norm Pct | Ret 20D Norm Pct | Ret 63D Norm Pct |
|---|---|---|---|---|
| 1 | 0.28 | 1.26 | 2.06 | 0.49 |
| 2 | 0.24 | 0.69 | 1.51 | 1.04 |
| 3 | 0.31 | 0.43 | 1.03 | 0.82 |
| 4 | 0.17 | 0.47 | 1.02 | 1.17 |
| 5 | 0.24 | 0.11 | 0.48 | 1.01 |
| 6 | 0.21 | 0.56 | 0.48 | 0.88 |
| 7 | 0.72 | 0.55 | 0.82 | 0.53 |
| 8 | 0.24 | 0.72 | 1.09 | 1.31 |
| 9 | 0.16 | 0.05 | 0.24 | 0.49 |
| 10 | 0.07 | 0.25 | 0.82 | 0.98 |
| 11 | 0.19 | 0.31 | 0.25 | 0.77 |
| 12 | 0.09 | 0.24 | 0.68 | 1.16 |
| 13 | 0.08 | 0.09 | 0.16 | 0.65 |
| 14 | -0.50 | 0.31 | 0.55 | 0.88 |
| 15 | 0.23 | -0.06 | 0.03 | 0.66 |
| 16 | 0.30 | 0.19 | 0.58 | 1.09 |
| 17 | -0.01 | -0.23 | 0.31 | 0.09 |
| 18 | 0.15 | 0.85 | 1.14 | 1.01 |
| 19 | -0.29 | 0.65 | 1.65 | 0.79 |
| 20 | -0.76 | 0.98 | 2.88 | -1.53 |
Marvell is -7.93% pre-open after Thursday's post-close report, erasing $17.2B of market value on record quarterly revenue of $2.74 billion, up 37% year over year. The mix is the problem: management guided third-quarter non-GAAP gross margin to 57.5%–58.5% from 58.9%, roughly 90 basis points lower sequentially as lower-margin custom AI silicon ramps, with the bulk of the Google custom-chip revenue landing in fiscal 2029, according to Benzinga's and Yahoo Finance's coverage of the call. Marvell's Liquidity exposure of +2.9σ and Beta of +2.9σ put it at the extreme end of the very axis that led this morning. Autodesk is -4.37% after its own post-close printBloomberg.
The complex is handing back Thursday's gains rather than breaking down, and the ETF grid shows it cleanly in the one-day-ago column.
| ETF | Theme | Today | 1d Ago | 5d Ago | 20d Ago | 63d Ago |
|---|---|---|---|---|---|---|
| DRAM | memory chips & storage | -1.90% | +0.78% | -1.30% | +8.58% | -9.17% |
| SMH | semiconductors | -0.99% | +3.10% | +1.84% | +6.33% | -4.47% |
| EWY | south korea | -0.75% | +1.65% | +2.23% | +12.98% | -11.76% |
| XLK | technology | -0.43% | +3.16% | +3.01% | +7.33% | +0.94% |
| IGV | software | -0.11% | +7.74% | +8.25% | +18.23% | +15.30% |
| SPY | large cap | +0.09% | +0.66% | +1.11% | +3.97% | +2.19% |
| GDX | gold miners | +0.24% | +1.24% | +3.85% | +35.05% | +18.94% |
| SLV | silver | +1.28% | +1.92% | +1.80% | +17.33% | -8.18% |
| KWEB | china internet | +1.36% | -0.68% | -2.21% | -6.98% | -2.10% |
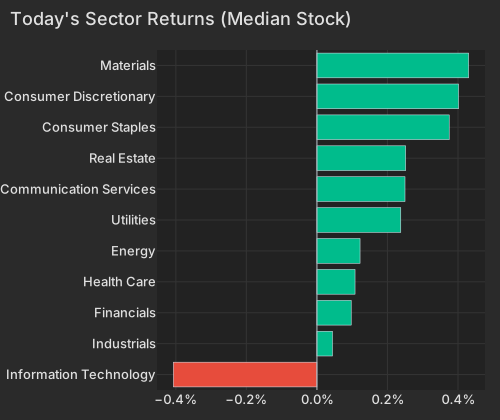
Information Technology's median stock is -0.45%, against +0.36% to +0.48% for Materials, Consumer Discretionary, Staples and Communication Services — the pressure is one sector deep, not market-wide.
| Sector | Median Ret Pct |
|---|---|
| Information Technology | -0.41 |
| Industrials | 0.04 |
| Financials | 0.10 |
| Health Care | 0.11 |
| Energy | 0.12 |
| Utilities | 0.24 |
| Communication Services | 0.25 |
| Real Estate | 0.25 |
| Consumer Staples | 0.38 |
| Consumer Discretionary | 0.40 |
| Materials | 0.43 |
The curve is a non-event so far: the 10-Year sits at 4.69% and the 30-Year at 5.21%, each up 2 basis pointsCNBC, and the Treasury factor is flat at z=-0.1 even though duration-sensitive names have lagged for a week (five-day z=-1.4). Stocks and bonds are wavering into Warsh's Jackson Hole speechBloomberg. Precious metals are holding: SLV +1.28% with spot silver above $70Economic Times, and the Gold factor's completed 20-day return in the 99.7th percentile since 2020 despite a flat print today.
Away from chips, the pre-open board is earnings gaps. Elastic is +22.98%, adding $2.11B of market value after its fiscal first-quarter report, following a Thursday software session in which Okta gained 29% and CrowdStrike posted its best day everCNBC. Gap +16.19% and Affirm +12.96% report into macroeconomic data showing the US consumer under strainBloomberg, while PayPal is -15.52% and $8.12B lighter after suitors reportedly walked away from a takeoverBloomberg. KE Holdings is +11.29% on a second-quarter beat alongside Beijing's new housing-presale circular and S&P Global's affirmation of China's A+ sovereign rating, part of the International factor's +0.15% (z=+0.5) with UMC +9.94%. One mover to discard: Vistance Networks at -41.81% is the ex-dividend adjustment for a $5.00 special distributionBloomberg.
Every one of those gaps is a fresh input into next week's fast-horizon sort — which, on the evidence of the past three months, is where they get worked against.
The Michigan Consumer data.sca.isr.umich.edu Survey (Final) is due at 10:00 AM ET, with consensus centered on 51.0–52.0 after the preliminary slump to 51.0 snapped two months of improvement; one-year inflation expectations rose to 4.3% in the preliminary report, the key upside risk in the release. The New York Fed Staff Nowcast follows at 12:45 PM ET, currently at 2.3% for Q3 2026 and well below the Atlanta Fed's 4.6% GDPNow estimate.
Variance decomposition: live intraday — 20260828 session, bracketed against its trailing-year range. Factor returns are trailing through last close. Total cross-sectional dispersion: 2.0%ile of the past year.
Variance mix — % of total, today vs 1d ago vs 1-yr avg
market 17%ile style 35%ile thematic 14%ile idiosyncratic 86%ile
Variance explained — today vs. factor's trailing-year range
Marker = the factor's share of today's total variance, placed in its own trailing-year range (box 25–75%ile, ticks 90%ile and max). Amber marker = unusually load-bearing today (≥90%ile of its own year). Factor name green = up today / red = down.
Correlation & dispersion — realized vs implied
Pairwise realized correlation (20d): 9.81% 7.2%ile since 2020 · 70%ile 3m
Top-500 pairwise: 10.77% 9.3%ile since 2020 · 56%ile 3m · implied (Cboe COR1M): 8.90 2.5%ile of its own history (gap +1.9pp)
Realized 20d vol (ann. pts): all stocks 44 vs VIXEQ 37 · index 11 vs VIX 14 · style factors 20 70%ile
20-day window (19 completed days + today); percentiles vs model history since 2020; '3m' tokens rank vs the trailing 63 trading days; definitions in Terms below. Implied prints (Cboe) are delayed ~15 min. as of 07:58 ET
Top 50 high-beta momentum names (eq-wt, since-2020 rank): -1.2% 27%ile · rest of market +0.2%
| Factor | Today | 1d | 5d | 20d | 60d |
|---|---|---|---|---|---|
| Style-Risk | |||||
| International | +0.15% z+0.5 | -0.15% | -0.07% | -0.30% | -0.76% |
| Beta | -0.31% z-0.3 | +0.84% | +0.29% | +2.17% | -7.79% |
| Residual Volatility | -0.13% z-0.3 | +0.75% | +0.16% | +3.30% | -1.98% |
| Style | |||||
| Liquidity | -0.31% z-1.1 | +0.09% | -0.54% | +1.41% | -1.49% |
| Dividend Yield | -0.04% z-0.2 | +0.01% | -0.10% | +0.65% | -0.97% |
| Growth | -0.04% z-0.1 | +0.33% | +0.19% | +0.70% | +2.90% |
| Leverage | +0.02% z+0.1 | -0.27% | -0.16% | -1.66% | -3.21% |
| Profitability | -0.01% z-0.1 | -0.34% | -0.23% | -1.58% | -2.18% |
| Size | -0.02% z-0.1 | +0.07% | +0.22% | -0.90% | -2.21% |
| Value | +0.01% z+0.0 | -0.45% | -0.41% | -0.81% | -1.54% |
| Style-Momentum | |||||
| Medium-Term Momentum | -0.11% z-0.4 | +0.35% | +0.04% | +1.01% | +0.72% |
| One-Day Momentum | -0.10% z-0.4 | +0.05% | -0.39% | -1.15% | -1.20% |
| Long-Term Momentum | -0.16% z-0.2 | -0.14% | -0.45% | -2.12% | -7.13% |
| Short-Term Momentum | +0.04% z+0.1 | -0.30% | -0.58% | -2.06% | -7.25% |
| Style-Positioning | |||||
| Hedge-Fund Ownership | -0.03% z-0.3 | -0.13% | +0.03% | +0.47% | +1.44% |
| Short Interest | -0.00% z-0.0 | +0.01% | +0.09% | +0.07% | +1.04% |
| Style-Flow | |||||
| Morning Activity | +0.07% z+0.6 | +0.17% | +0.00% | +1.85% | +1.18% |
| Short-Sale Activity | -0.03% z-0.3 | -0.27% | -0.40% | +0.31% | -0.29% |
| Thematic | |||||
| Semiconductors | -0.27% z-0.5 | -0.28% | -0.68% | -2.79% | -8.13% |
| Bitcoin / Crypto | -0.12% z-0.4 | +0.76% | +0.47% | +1.30% | +1.54% |
| Oil | +0.04% z+0.1 | +0.45% | -0.22% | +2.29% | -2.27% |
| Treasury (Duration) | -0.03% z-0.1 | -0.45% | -1.02% | -0.85% | +0.32% |
| China | +0.02% z+0.1 | +0.53% | +0.18% | +0.24% | -0.67% |
| Gold | +0.01% z+0.0 | +0.30% | +0.52% | +5.04% | +3.83% |
5/20/60d windows include today's session; 1d is the previous session.
Market variance share. The fraction of cross-sectional variance explained by the market factor — the attribution companion to pairwise correlation, not a substitute for it.
Factor z-score. Today's factor return divided by its daily-return standard deviation over ~1,600 trading days.
High-beta momentum cohort. US names above $2B market cap in the top quintile of both raw beta and 12-month momentum; membership frozen at each month's first business day. “Top 50” = the 50 strongest by combined rank.
VIXEQ / DSPX / COR1M. Cboe implied indices: single-stock volatility, dispersion, and 1-month implied correlation (top-50 S&P names). Quotes delayed ~15 minutes.
Data compiled by FactorPulse AI; edited and verified by Jeff Klein. For informational purposes only. Does not constitute financial advice, an investment recommendation, or an offer to buy or sell any securities. Always consult a qualified financial professional before making investment decisions.
For more on factor construction methodology, see www.factorpulse.com/glossary.