Nvidia reported after Wednesday's close with fiscal Q2 revenue of $96B, up 106% year over year, and guided the October quarter to $108BMorningstar. The pre-open cross-section is taking it as a growth-and-risk bid rather than an index move: Growth +0.25% at z=+1.0, Beta +0.96% at z=+0.99, and the Semiconductors thematic +0.45%, against SPY +0.41%. Liquidity is running +0.25% at z=+0.94 — the easiest names to trade are the ones being lifted, which is what a pre-market tape usually delivers before the bell fills in the rest.
| Factor | Return | Z-Score | 5d Z | 20d Z | 63d Z | Category | Direction |
|---|---|---|---|---|---|---|---|
| Growth | +0.25% | z=+1.03 | +0.07 | +0.67 | +1.55 | Style | Faster-growing names leading |
| Beta | +0.96% | z=+0.99 | +0.49 | +0.62 | -0.88 | Style-Risk | Most market-sensitive names leading |
| Short-Term Momentum | -0.35% | z=-1.13 | -0.41 | -1.97 | -3.73 | Style-Momentum | Worst recent multi-day performers ahead |
| Short-Sale Activity | -0.13% | z=-1.15 | -1.08 | +0.95 | +0.41 | Style-Flow | Barely-shorted names ahead of the most short-sold |
| Semiconductors | +0.45% | z=+0.75 | -0.4 | -0.6 | -1.2 | Thematic | Chip exposure paying |
| Liquidity | +0.25% | z=+0.94 | -0.4 | +1.4 | -0.7 | Style | Most-tradable names leading |
| Treasury (Duration) | -0.23% | z=-0.70 | -0.88 | -0.53 | +0.07 | Thematic | Rate-sensitive names lagging |
The durable content of the print is a cost, not a revenue number. Nvidia's gross margin runs from 75% in the July quarter to 74% in October and 71.5% by JanuaryMorningstar, and management told analysts, per CNBC's coverage of the call, that "Memory scarcity today is being driven in large part by the AI buildout itself." The build is bidding up its own inputs. Against that, the same guidance carries a forecast of $1.3 trillion in AI capital spending next year across Nvidia's five largest US hyperscaler customersMorningstar — the demand side of the same shortage.
HP Inc reported net revenue of $15.7B, up 12.5% and well past the $14.34B consensus, with non-GAAP EPS of $0.83 against $0.66 expected, and raised fiscal 2026 guidance to $3.19–$3.29. The stock is down -12.85%, erasing $3.7B, because Personal Systems operating margin came in at 4.6% versus 5.2% the prior quarter on rising commodity and memory chip costsEconomic Times. A hardware assembler with no pricing power is where the memory bill actually lands. On the supplier side the bid is mechanical rather than newsy — SanDisk +4.50% and AXT +8.39% are being carried by the day's beta complex, with almost nothing company-specific in either move.
| ETF | Theme | Today | 1d Ago | 5d Ago | 20d Ago | 63d Ago |
|---|---|---|---|---|---|---|
| DRAM | memory chips & storage | +3.51% | +0.27% | +2.27% | +25.73% | -7.15% |
| SMH | semiconductors | +2.80% | -0.01% | -0.92% | +10.22% | -6.67% |
| IGV | software | +2.47% | +0.53% | -0.41% | +10.85% | +10.04% |
| EWY | south korea | +2.33% | -0.54% | +2.72% | +24.25% | -9.64% |
| XLK | technology | +1.93% | +0.61% | -0.44% | +9.77% | -0.86% |
| SPY | large cap | +0.41% | +0.02% | -0.39% | +5.02% | +2.08% |
| XLF | financials | -0.61% | -0.09% | +1.36% | +2.79% | +13.30% |
| XLP | consumer staples | -0.60% | -0.29% | -0.31% | -1.25% | +2.00% |
| XLV | healthcare | -0.46% | -1.00% | -1.22% | +4.39% | +16.63% |
The shape of the memory bid is one month old, not one quarter: DRAM is +25.73% over 20 sessions and still -7.15% over 63. Korea, the other direct expression of memory pricing, is +2.33% this morning and +24.25% over 20 sessions despite a surprise Bank of Korea rate hike overnight, which Bloomberg reported tightened regional conditions and lifted the won.
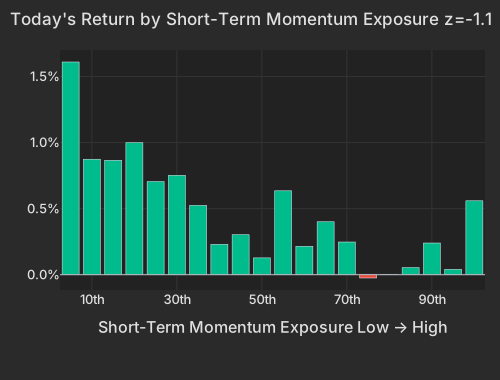
Underneath the earnings tape, the cross-section's most persistent feature is unchanged. Short-Term Momentum is -0.35% at z=-1.13, extending a run whose 63-day cumulative return through Wednesday's close was -9.08% — the weakest of all 1,538 overlapping 63-day windows since 2020, at z=-3.73. Today the print is coming from the bottom end: the worst recent multi-day performers are up 1.6% as a bucket, with the top end doing far less.
| Bucket | Avg Ret Pct |
|---|---|
| 1 | 1.61 |
| 2 | 0.87 |
| 3 | 0.87 |
| 4 | 1.00 |
| 5 | 0.70 |
| 6 | 0.75 |
| 7 | 0.52 |
| 8 | 0.23 |
| 9 | 0.30 |
| 10 | 0.13 |
| 11 | 0.63 |
| 12 | 0.21 |
| 13 | 0.40 |
| 14 | 0.25 |
| 15 | -0.03 |
| 16 | -0.00 |
| 17 | 0.05 |
| 18 | 0.24 |
| 19 | 0.04 |
| 20 | 0.56 |
What is doing the bouncing is the point. Okta carries a Short-Term Momentum exposure of -1.94 and CrowdStrike -2.27 — both sat deep among the prior week's laggards going into their reports, and both are this morning's largest gainers, Okta +17.41% and CrowdStrike +9.45%, with Salesforce +10.78% and Veeva +7.48% alongside them. The reporting calendar is landing squarely on the beaten-down end of the week's distribution, which is the mechanical reason a three-month reversion pattern keeps printing without any single-day drama.
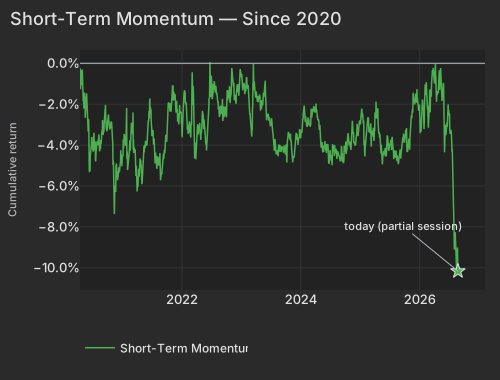
| Date | Cumret Pct |
|---|---|
| 2020-04-15 | -0.33 |
| 2020-05-07 | -1.84 |
| 2020-06-01 | -2.80 |
| 2020-06-23 | -4.16 |
| 2020-07-16 | -3.85 |
| 2020-08-07 | -3.79 |
| 2020-08-31 | -3.33 |
| 2020-09-23 | -2.84 |
| 2020-10-15 | -3.24 |
| 2020-11-06 | -4.82 |
| 2020-12-01 | -5.67 |
| 2020-12-23 | -4.74 |
| 2021-01-19 | -3.53 |
| 2021-02-10 | -4.52 |
| 2021-03-05 | -3.45 |
| 2021-03-29 | -5.06 |
| 2021-04-21 | -4.84 |
| 2021-05-13 | -4.06 |
| 2021-06-07 | -3.06 |
| 2021-06-29 | -2.95 |
| 2021-07-22 | -4.70 |
| 2021-08-13 | -4.64 |
| 2021-09-07 | -4.62 |
| 2021-09-29 | -3.48 |
| 2021-10-21 | -2.12 |
| 2021-11-12 | -1.39 |
| 2021-12-07 | -2.82 |
| 2021-12-30 | -2.97 |
| 2022-01-24 | -1.96 |
| 2022-02-15 | -3.08 |
| 2022-03-10 | -1.45 |
| 2022-04-01 | -3.57 |
| 2022-04-26 | -3.50 |
| 2022-05-18 | -2.74 |
| 2022-06-10 | -3.16 |
| 2022-07-06 | -1.00 |
| 2022-07-28 | -1.41 |
| 2022-08-19 | -2.57 |
| 2022-09-13 | -2.46 |
| 2022-10-05 | -2.04 |
| 2022-10-27 | -1.68 |
| 2022-11-18 | -1.45 |
| 2022-12-13 | -1.27 |
| 2023-01-06 | -0.71 |
| 2023-01-31 | -1.33 |
| 2023-02-23 | -2.51 |
| 2023-03-17 | 0.00 |
| 2023-04-11 | -1.82 |
| 2023-05-03 | -1.84 |
| 2023-05-25 | -1.22 |
| 2023-06-20 | -2.70 |
| 2023-07-13 | -3.08 |
| 2023-08-04 | -4.45 |
| 2023-08-28 | -4.07 |
| 2023-09-20 | -4.27 |
| 2023-10-12 | -3.86 |
| 2023-11-03 | -3.80 |
| 2023-11-28 | -4.35 |
| 2023-12-20 | -3.72 |
| 2024-01-16 | -2.70 |
| 2024-02-07 | -2.98 |
| 2024-03-01 | -3.10 |
| 2024-03-25 | -2.13 |
| 2024-04-17 | -2.75 |
| 2024-05-09 | -4.14 |
| 2024-06-03 | -3.96 |
| 2024-06-26 | -4.88 |
| 2024-07-19 | -4.07 |
| 2024-08-12 | -4.45 |
| 2024-09-04 | -4.63 |
| 2024-09-26 | -4.04 |
| 2024-10-18 | -3.46 |
| 2024-11-11 | -3.18 |
| 2024-12-04 | -3.98 |
| 2024-12-27 | -2.97 |
| 2025-01-23 | -2.77 |
| 2025-02-14 | -2.95 |
| 2025-03-11 | -3.53 |
| 2025-04-02 | -3.32 |
| 2025-04-25 | -3.44 |
| 2025-05-19 | -4.92 |
| 2025-06-11 | -4.51 |
| 2025-07-07 | -3.96 |
| 2025-07-29 | -4.69 |
| 2025-08-20 | -4.60 |
| 2025-09-12 | -4.30 |
| 2025-10-06 | -3.65 |
| 2025-10-28 | -4.11 |
| 2025-11-19 | -2.37 |
| 2025-12-12 | -1.89 |
| 2026-01-07 | -3.42 |
| 2026-01-30 | -3.21 |
| 2026-02-24 | -2.25 |
| 2026-03-18 | -1.00 |
| 2026-04-10 | -0.01 |
| 2026-05-04 | -0.72 |
| 2026-05-27 | -1.49 |
| 2026-06-18 | -2.89 |
| 2026-07-14 | -3.24 |
| 2026-08-05 | -9.11 |
| 2026-08-27 | -10.16 |
The pushback on the memory story is in Nvidia's own price: the margin path was in the release and the stock is up +6.04% regardless, which says the market is paying for the $108B revenue guide and treating the input cost as a rounding item at the top of the chain. Growth's 63-day cumulative return of +2.97% at z=+1.5 says that preference has been in force for a quarter, not since Wednesday's close. The discount is being applied one layer down, where the cost cannot be passed on.
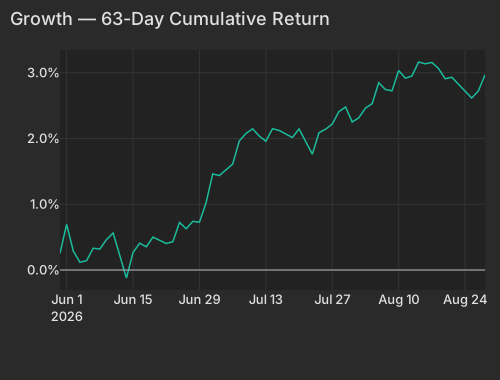
| Factor | Display Name | Cumret Pct |
|---|---|---|
| growth | Growth | 2.97 |
Two things sit outside the AI complex and are worth the glance. Harmony Gold is down -7.96% while the FTSE/JSE precious metals index heads for its best month since 2006, with AngloGold, Pan African and Gold Fields all up more than 40% on the monthBloomberg — a gold-mining name breaking from gold. And Dollar General is +7.49% on its own morning report, the standout in a Consumer Staples group whose median stock is -0.52%. Implied dispersion (Cboe DSPX) at 34.75 sits in the 92nd percentile of its own history while implied index volatility (Cboe VIX) at 15.01 is only at the 32nd — the options market is already paid for exactly this kind of morning, where the index barely moves and individual names gap 10% to 17%.
Initial Claims the BLS is due at 8:30 AM ET, with economists looking for roughly 232,000 — the last labor reading before Friday's Jackson Hole address, and the market is positioned for asymmetric sensitivity to any spike. Treasury yields have edged lower into the print, with the 10-Year at 4.66%CNBC and the whole curve from 2s to 30s down a fraction of a basis point.
Variance decomposition: live intraday — 20260827 session, bracketed against its trailing-year range. Factor returns are trailing through last close. Total cross-sectional dispersion: 2.8%ile of the past year.
Variance mix — % of total, today vs 1d ago vs 1-yr avg
market 53%ile style 90%ile thematic 63%ile idiosyncratic 21%ile
Variance explained — today vs. factor's trailing-year range
Marker = the factor's share of today's total variance, placed in its own trailing-year range (box 25–75%ile, ticks 90%ile and max). Amber marker = unusually load-bearing today (≥90%ile of its own year). Factor name green = up today / red = down.
Correlation & dispersion — realized vs implied
Pairwise realized correlation (20d): 9.03% 5.6%ile since 2020 · 65%ile 3m
Top-500 pairwise: 8.99% 5.0%ile since 2020 · 29%ile 3m · implied (Cboe COR1M): 9.09 2.7%ile of its own history (gap -0.1pp)
Realized 20d vol (ann. pts): all stocks 44 vs VIXEQ 38 · index 11 vs VIX 15 · style factors 20 70%ile
20-day window (19 completed days + today); percentiles vs model history since 2020; '3m' tokens rank vs the trailing 63 trading days; definitions in Terms below. Implied prints (Cboe) are delayed ~15 min. as of 07:58 ET
Top 50 high-beta momentum names (eq-wt, since-2020 rank): +3.1% 88%ile · rest of market +0.0%
| Factor | Today | 1d | 5d | 20d | 60d |
|---|---|---|---|---|---|
| Style-Risk | |||||
| Beta | +0.96% z+1.0 | +0.03% | +1.06% | +2.68% | -7.94% |
| Residual Volatility | +0.23% z+0.5 | -0.19% | -0.22% | +2.98% | -3.20% |
| International | -0.08% z-0.3 | -0.27% | +0.03% | -0.63% | -1.16% |
| Style | |||||
| Growth | +0.25% z+1.0 | +0.11% | +0.04% | +0.72% | +2.68% |
| Liquidity | +0.25% z+0.9 | -0.13% | -0.24% | +1.70% | -1.53% |
| Value | -0.11% z-0.5 | +0.19% | -0.26% | -0.22% | -1.00% |
| Profitability | +0.03% z+0.2 | +0.16% | +0.11% | -1.20% | -1.50% |
| Leverage | -0.02% z-0.1 | -0.03% | -0.17% | -1.74% | -3.16% |
| Dividend Yield | +0.01% z+0.0 | +0.03% | -0.20% | +0.55% | -1.15% |
| Size | -0.00% z-0.0 | -0.01% | -0.03% | -0.30% | -1.96% |
| Style-Momentum | |||||
| Short-Term Momentum | -0.35% z-1.1 | -0.81% | -0.28% | -2.69% | -8.17% |
| One-Day Momentum | +0.08% z+0.3 | -0.33% | -0.43% | -0.93% | -1.10% |
| Long-Term Momentum | +0.18% z+0.3 | +0.27% | -0.38% | -1.97% | -5.68% |
| Medium-Term Momentum | -0.03% z-0.1 | -0.12% | +0.26% | +0.68% | +0.66% |
| Style-Positioning | |||||
| Short Interest | -0.07% z-0.4 | -0.13% | +0.01% | -0.20% | +1.11% |
| Hedge-Fund Ownership | -0.03% z-0.3 | +0.02% | +0.09% | +0.58% | +1.60% |
| Style-Flow | |||||
| Short-Sale Activity | -0.13% z-1.2 | -0.00% | -0.27% | +0.45% | +0.14% |
| Morning Activity | -0.01% z-0.1 | -0.17% | -0.08% | +1.49% | +0.85% |
| Thematic | |||||
| Semiconductors | +0.45% z+0.8 | +0.69% | -0.55% | -1.74% | -5.57% |
| Treasury (Duration) | -0.23% z-0.7 | -0.34% | -0.65% | -0.78% | +0.42% |
| Bitcoin / Crypto | +0.16% z+0.5 | -0.35% | +0.01% | +0.53% | +1.46% |
| Gold | -0.10% z-0.3 | -0.48% | +0.70% | +3.83% | +3.25% |
| China | +0.06% z+0.1 | -0.10% | -0.26% | +0.13% | -1.58% |
| Oil | +0.04% z+0.1 | -0.06% | -0.60% | +2.59% | -2.77% |
5/20/60d windows include today's session; 1d is the previous session.
Pairwise realized correlation. Index variance net of the weighted idiosyncratic diagonal, over the cross terms — the estimator used for implied-correlation indices. 20-day window unless noted; history since 2020.
Market variance share. The fraction of cross-sectional variance explained by the market factor — the attribution companion to pairwise correlation, not a substitute for it.
Factor z-score. Today's factor return divided by its daily-return standard deviation over ~1,600 trading days.
Conditional importance. A factor's relative share of what a tree-based fit of today's stock returns explains; sums to 100% across factors.
High-beta momentum cohort. US names above $2B market cap in the top quintile of both raw beta and 12-month momentum; membership frozen at each month's first business day. “Top 50” = the 50 strongest by combined rank.
Dispersion (realized). Total cross-sectional volatility net of the market component; high dispersion is the flip side of low correlation.
Stock-specific (idiosyncratic) return. The part of a stock's move not explained by market, style, or thematic factors in our decomposition.
VIXEQ / DSPX / COR1M. Cboe implied indices: single-stock volatility, dispersion, and 1-month implied correlation (top-50 S&P names). Quotes delayed ~15 minutes.
Data compiled by FactorPulse AI; edited and verified by Jeff Klein. For informational purposes only. Does not constitute financial advice, an investment recommendation, or an offer to buy or sell any securities. Always consult a qualified financial professional before making investment decisions.
For more on factor construction methodology, see www.factorpulse.com/glossary.