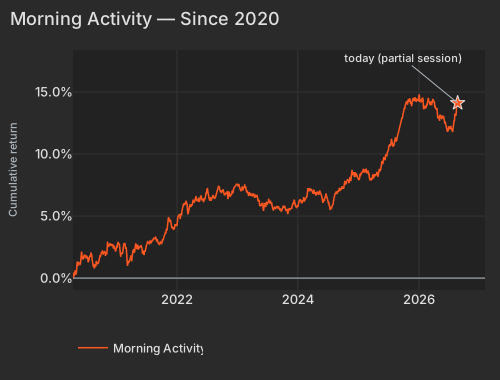
The pre-open factor tape is nearly still: nothing in the style block is running beyond z=-0.7, and the largest single-day print is Medium-Term Momentum at -0.21%, the past month's winners easing off. So the signal worth trading against is the month, not the morning. Morning Activity has run +1.93% over 20 days at z=+3.4, and its variance share over the blended 20 days sits at the 98th percentile since 2020 — the axis has been unusually load-bearing, not just profitable. The exposure is fixed before the bell from trailing behaviour, so it says nothing about who is trading this morning; it says the early-session names outperformed for a month straight.
| Factor | Return | Z-Score | 5d Z | 20d Z | 63d Z | Category | Direction |
|---|---|---|---|---|---|---|---|
| Morning Activity | +0.01% | z=+0.1 | +0.4 | +3.4 | +1.2 | Style-Flow | early-trading names ahead for a month |
| Gold | -0.11% | z=-0.4 | +2.1 | +3.0 | +1.1 | Thematic | pausing after an extreme month |
| Beta | +0.06% | z=+0.1 | -0.0 | +1.4 | -0.9 | Style-Risk | flat today, up over the month |
| Residual Volatility | -0.25% | z=-0.5 | -0.3 | +1.5 | -0.1 | Style-Risk | higher-volatility names slightly behind |
| Medium-Term Momentum | -0.21% | z=-0.7 | +0.2 | +0.4 | +0.9 | Style-Momentum | the month's winners giving back |
| Hedge-Fund Ownership | +0.02% | z=+0.2 | +0.9 | +1.2 | +1.2 | Style-Positioning | mild, persistent participation |
| Short Interest | -0.03% | z=-0.2 | -0.4 | -1.0 | +1.1 | Style-Positioning | the most-shorted names lagging mildly |
| Semiconductors | +0.07% | z=+0.1 | -1.0 | -0.3 | -1.7 | Thematic | flat into Nvidia's print |
| Date | Cumret Pct |
|---|---|
| 2020-04-14 | 0.04 |
| 2020-05-06 | 0.64 |
| 2020-05-29 | 1.33 |
| 2020-06-22 | 1.85 |
| 2020-07-15 | 1.27 |
| 2020-08-06 | 1.59 |
| 2020-08-28 | 1.06 |
| 2020-09-22 | 1.52 |
| 2020-10-14 | 2.06 |
| 2020-11-05 | 2.34 |
| 2020-11-30 | 2.73 |
| 2020-12-22 | 2.47 |
| 2021-01-15 | 2.69 |
| 2021-02-09 | 2.11 |
| 2021-03-04 | 1.69 |
| 2021-03-26 | 1.69 |
| 2021-04-20 | 2.04 |
| 2021-05-12 | 2.39 |
| 2021-06-04 | 2.41 |
| 2021-06-28 | 2.35 |
| 2021-07-21 | 2.87 |
| 2021-08-12 | 3.19 |
| 2021-09-03 | 3.14 |
| 2021-09-28 | 2.85 |
| 2021-10-20 | 3.51 |
| 2021-11-11 | 4.90 |
| 2021-12-06 | 4.15 |
| 2021-12-29 | 4.34 |
| 2022-01-21 | 4.77 |
| 2022-02-14 | 5.86 |
| 2022-03-09 | 5.20 |
| 2022-03-31 | 5.83 |
| 2022-04-25 | 6.44 |
| 2022-05-17 | 6.15 |
| 2022-06-09 | 6.34 |
| 2022-07-05 | 7.19 |
| 2022-07-27 | 6.23 |
| 2022-08-18 | 6.37 |
| 2022-09-12 | 7.38 |
| 2022-10-04 | 7.09 |
| 2022-10-26 | 6.78 |
| 2022-11-17 | 6.61 |
| 2022-12-12 | 7.24 |
| 2023-01-05 | 7.58 |
| 2023-01-30 | 7.17 |
| 2023-02-22 | 7.40 |
| 2023-03-16 | 6.93 |
| 2023-04-10 | 6.76 |
| 2023-05-02 | 6.65 |
| 2023-05-24 | 5.80 |
| 2023-06-16 | 6.05 |
| 2023-07-12 | 6.24 |
| 2023-08-03 | 5.62 |
| 2023-08-25 | 5.73 |
| 2023-09-19 | 5.53 |
| 2023-10-11 | 5.71 |
| 2023-11-02 | 5.17 |
| 2023-11-27 | 5.65 |
| 2023-12-19 | 5.86 |
| 2024-01-12 | 6.19 |
| 2024-02-06 | 6.36 |
| 2024-02-29 | 6.94 |
| 2024-03-22 | 7.10 |
| 2024-04-16 | 6.92 |
| 2024-05-08 | 6.74 |
| 2024-05-31 | 6.13 |
| 2024-06-25 | 6.58 |
| 2024-07-18 | 5.59 |
| 2024-08-09 | 6.56 |
| 2024-09-03 | 7.06 |
| 2024-09-25 | 7.30 |
| 2024-10-17 | 7.55 |
| 2024-11-08 | 7.76 |
| 2024-12-03 | 8.33 |
| 2024-12-26 | 8.23 |
| 2025-01-22 | 8.50 |
| 2025-02-13 | 8.59 |
| 2025-03-10 | 8.27 |
| 2025-04-01 | 8.28 |
| 2025-04-24 | 8.56 |
| 2025-05-16 | 8.73 |
| 2025-06-10 | 9.52 |
| 2025-07-03 | 10.32 |
| 2025-07-28 | 10.68 |
| 2025-08-19 | 10.99 |
| 2025-09-11 | 12.38 |
| 2025-10-03 | 13.50 |
| 2025-10-27 | 13.98 |
| 2025-11-18 | 14.09 |
| 2025-12-11 | 14.58 |
| 2026-01-06 | 14.82 |
| 2026-01-29 | 14.21 |
| 2026-02-23 | 13.91 |
| 2026-03-17 | 14.14 |
| 2026-04-09 | 13.76 |
| 2026-05-01 | 12.95 |
| 2026-05-26 | 13.11 |
| 2026-06-17 | 12.19 |
| 2026-07-13 | 12.12 |
| 2026-08-04 | 12.52 |
| 2026-08-26 | 14.12 |
Morning Activity's exposures correlate 0.44 with Beta, so this is not an independent flow signal sitting alongside the risk rally — it is the same names. The high-beta momentum cohort overlaps that exposure vector at 0.31 and is retail-tilted by +0.76σ against the universe, with its hedge-fund-ownership tilt flat. Over the blended 20 days, style factors account for 25.4% of cross-sectional variance against 6.3% for the index, which is why a month like this shows up in factor space long before it shows up in an index chart. And last week's movers have been fading throughout: Short-Term Momentum is -3.03% over 20 days and -8.04% over 60, so the month's gains did not come from chasing weekly winners.
Morgan Stanley Prime Brokerage reported the second-largest weekly global equity sell-off in twelve months for the week ended August 20, and Goldman Sachs data through August 21 put net leverage at 71.3% with a long/short ratio of 1.588. Our direct lens on the same question does not show those names lagging: Hedge-Fund Ownership is +0.56% over 20 days at z=+1.2 on the 63-day window. The 20-day ETF leaderboard is the high-beta thematic end — uranium, bitcoin, silver, innovation, Korea — while mega-cap DIA managed +1.58%. The 63-day column is where the limit sits: uranium, Korea and semiconductors are all still underwater over the quarter, and Beta is -7.92% over 60 days. This is a one-month recovery inside a three-month hole.
| ETF | Theme | Today | 1d Ago | 5d Ago | 20d Ago | 63d Ago |
|---|---|---|---|---|---|---|
| URA | uranium | +1.35% | +5.36% | +10.36% | +23.59% | -5.35% |
| NLR | nuclear power | +1.21% | +4.46% | +8.36% | +16.85% | -7.87% |
| BITO | crypto | -0.74% | +0.28% | +22.11% | +23.38% | +2.80% |
| SLV | silver | -0.37% | +0.19% | +8.50% | +20.54% | -10.61% |
| ARKK | innovation growth | -0.38% | +2.92% | +9.12% | +19.21% | +11.83% |
| EWY | south korea | -0.34% | +3.75% | +5.94% | +18.95% | -10.22% |
| GDX | gold miners | -1.06% | +1.91% | +18.63% | +42.19% | +19.23% |
| IGV | software | -1.44% | -0.59% | -0.11% | +10.97% | +8.29% |
| DIA | mega cap | +0.11% | +0.30% | +0.44% | +1.58% | +5.94% |
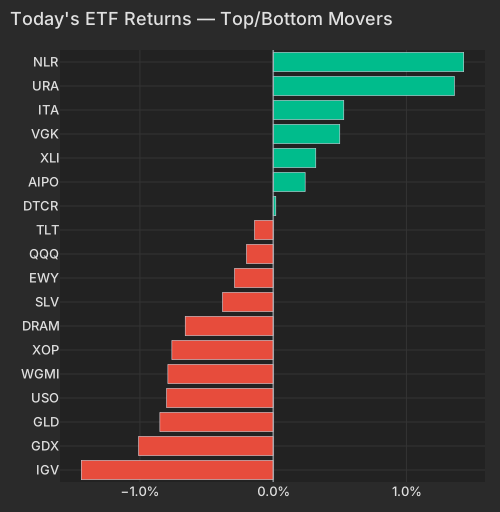
| Sym | Theme | Ret Today Pct | Vol Pace |
|---|---|---|---|
| IGV | cyclical | -1.44 | 0.06 |
| GDX | currency | -1.01 | 0.12 |
| GLD | currency | -0.85 | 0.20 |
| USO | energy + cyclical | -0.80 | 0.62 |
| WGMI | retail + currency | -0.79 | 0.11 |
| XOP | energy + cyclical | -0.76 | 0.12 |
| DRAM | technology | -0.66 | 0.15 |
| SLV | currency | -0.38 | 0.29 |
| EWY | international | -0.29 | 0.10 |
| QQQ | growth | -0.20 | 0.11 |
| TLT | rates | -0.14 | 0.12 |
| DTCR | technology + rates | 0.02 | 0.08 |
| AIPO | technology + cyclical | 0.24 | 0.13 |
| XLI | cyclical | 0.32 | 0.00 |
| VGK | international | 0.50 | 0.04 |
| ITA | cyclical | 0.53 | 0.01 |
| URA | energy + cyclical | 1.36 | 0.19 |
| NLR | energy + cyclical | 1.43 | 0.22 |
Iran has restarted negotiations with Oman over management of the Strait of HormuzEconomic Times, days after fresh US sanctions on Iran and continued shipping disruption in the straitBloomberg. The metals and crude complex is where that lands: GLD -0.89%, GDX -1.06%, USO -0.90%, XLE -0.67%, with the median energy stock -0.46% and Exxon -1.05%. It is not a rates or dollar event: the entire Treasury curve is a shade lower, the 10-Year at 4.637% and the 2-Year at 4.191%CNBC, and the dollar index is effectively unchanged at 98.97CNBC. The equity cross-section is barely participating in the give-back — the Gold factor is only -0.11% after a completed 20-day run of +4.34%, in the 98.7th percentile of windows since 2020 and the most extreme since late January. Gold-exposed equities are holding what bullion is surrendering, and Friday's July PCE bea.gov print is the next thing that moves bothEconomic Times.
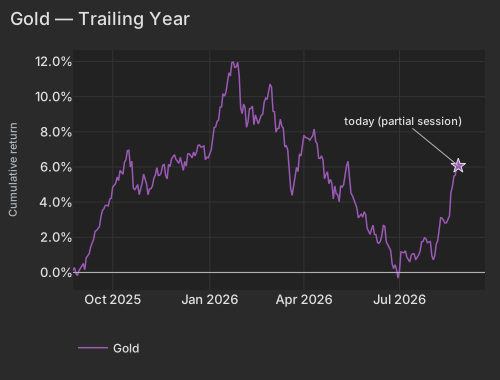
| Date | Cumret Pct |
|---|---|
| 2025-08-25 | 0.11 |
| 2025-08-27 | -0.06 |
| 2025-09-02 | 0.37 |
| 2025-09-04 | 0.16 |
| 2025-09-09 | 1.07 |
| 2025-09-11 | 1.62 |
| 2025-09-16 | 2.38 |
| 2025-09-18 | 2.61 |
| 2025-09-23 | 3.62 |
| 2025-09-25 | 3.83 |
| 2025-09-30 | 4.22 |
| 2025-10-02 | 4.98 |
| 2025-10-07 | 5.22 |
| 2025-10-09 | 5.68 |
| 2025-10-14 | 6.41 |
| 2025-10-16 | 6.95 |
| 2025-10-21 | 4.80 |
| 2025-10-24 | 5.00 |
| 2025-10-28 | 4.69 |
| 2025-10-31 | 5.35 |
| 2025-11-04 | 4.42 |
| 2025-11-07 | 4.92 |
| 2025-11-11 | 5.55 |
| 2025-11-14 | 5.54 |
| 2025-11-18 | 6.10 |
| 2025-11-21 | 5.32 |
| 2025-11-25 | 6.03 |
| 2025-12-01 | 6.44 |
| 2025-12-03 | 6.21 |
| 2025-12-08 | 5.80 |
| 2025-12-10 | 6.05 |
| 2025-12-15 | 6.64 |
| 2025-12-17 | 6.85 |
| 2025-12-22 | 7.23 |
| 2025-12-26 | 7.19 |
| 2025-12-30 | 6.55 |
| 2026-01-05 | 7.59 |
| 2026-01-07 | 8.28 |
| 2026-01-12 | 9.40 |
| 2026-01-14 | 10.17 |
| 2026-01-20 | 11.36 |
| 2026-01-22 | 11.94 |
| 2026-01-27 | 11.70 |
| 2026-01-29 | 11.23 |
| 2026-02-03 | 9.58 |
| 2026-02-05 | 8.26 |
| 2026-02-10 | 9.34 |
| 2026-02-12 | 8.40 |
| 2026-02-18 | 8.71 |
| 2026-02-20 | 9.00 |
| 2026-02-25 | 9.84 |
| 2026-03-02 | 10.53 |
| 2026-03-04 | 9.14 |
| 2026-03-09 | 8.20 |
| 2026-03-11 | 8.32 |
| 2026-03-16 | 7.20 |
| 2026-03-18 | 5.88 |
| 2026-03-23 | 4.98 |
| 2026-03-25 | 5.98 |
| 2026-03-30 | 6.62 |
| 2026-04-01 | 7.80 |
| 2026-04-07 | 7.52 |
| 2026-04-09 | 7.78 |
| 2026-04-14 | 7.33 |
| 2026-04-16 | 6.49 |
| 2026-04-21 | 5.33 |
| 2026-04-23 | 5.73 |
| 2026-04-28 | 5.07 |
| 2026-05-01 | 4.47 |
| 2026-05-05 | 4.02 |
| 2026-05-08 | 4.99 |
| 2026-05-12 | 6.07 |
| 2026-05-15 | 4.52 |
| 2026-05-19 | 4.18 |
| 2026-05-22 | 3.11 |
| 2026-05-27 | 3.15 |
| 2026-06-01 | 2.52 |
| 2026-06-03 | 2.17 |
| 2026-06-08 | 2.17 |
| 2026-06-10 | 1.71 |
| 2026-06-15 | 2.09 |
| 2026-06-17 | 2.63 |
| 2026-06-23 | 1.25 |
| 2026-06-25 | 0.22 |
| 2026-06-30 | -0.32 |
| 2026-07-06 | 1.12 |
| 2026-07-08 | 0.88 |
| 2026-07-13 | 0.98 |
| 2026-07-15 | 1.07 |
| 2026-07-20 | 0.99 |
| 2026-07-22 | 1.74 |
| 2026-07-27 | 1.92 |
| 2026-07-29 | 1.73 |
| 2026-08-03 | 0.71 |
| 2026-08-05 | 1.62 |
| 2026-08-10 | 3.11 |
| 2026-08-12 | 2.94 |
| 2026-08-17 | 3.07 |
| 2026-08-19 | 4.56 |
| 2026-08-24 | 5.54 |
| 2026-08-26 | 6.07 |
Intuit is -9.47%, erasing $8.95B of market value, after reports of accelerating TurboTax customer losses tied to price increasesBloomberg; MarketWatch reported that users are moving to cheaper tax-preparation options. Nearly the whole move is the stock's own — the factor complex contributes under a point of it, the largest idiosyncratic print in its trailing year. Software is wearing it: IGV -1.44%, SAP -3.93%, Zoom -7.04%, Microsoft -0.75%, and the median technology name -0.53%. Abercrombie & Fitch is +10.66% on net sales up 21% to $1.13 billion and full-year growth guidance raised to 12–13%, despite management flagging an "increasingly uncertain" consumer environment; Photronics is +16.71% on in-line Q3 revenue of $211.2 million; nCino is -8.07% despite $161.0 million of Q2 revenue and another $100 million authorised for buybacksBloomberg. Summit Therapeutics +15.82% and Spyre Therapeutics -11.20% round out the outsized moves, each on its own story rather than anything the factor complex did.
None of this has touched the semiconductor axis, which is flat at z=+0.1 with SMH -0.16% — the complex is standing still until Nvidia reports after today's closeBloomberg. That print is the test of the month's arithmetic: the early-trading, high-beta end of the market has been paid for four weeks on a tape where the index has gone almost nowhere, and the quarter is still negative underneath it.
Variance decomposition: live intraday — 20260826 session, bracketed against its trailing-year range. Factor returns are trailing through last close. Total cross-sectional dispersion: 0.4%ile of the past year.
Variance mix — % of total, today vs 1d ago vs 1-yr avg
market 33%ile style 28%ile thematic 57%ile idiosyncratic 83%ile
Variance explained — today vs. factor's trailing-year range
Marker = the factor's share of today's total variance, placed in its own trailing-year range (box 25–75%ile, ticks 90%ile and max). Amber marker = unusually load-bearing today (≥90%ile of its own year). Factor name green = up today / red = down.
Correlation & dispersion — realized vs implied
Pairwise realized correlation (20d): 10.29% 8.7%ile since 2020 · 71%ile 3m
Top-500 pairwise: 10.67% 8.9%ile since 2020 · 49%ile 3m · implied (Cboe COR1M): 9.59 3.4%ile of its own history (gap +1.1pp)
Realized 20d vol (ann. pts): all stocks 48 vs VIXEQ 38 · index 12 vs VIX 16 · style factors 24 86%ile
20-day window (19 completed days + today); percentiles vs model history since 2020; '3m' tokens rank vs the trailing 63 trading days; definitions in Terms below. Implied prints (Cboe) are delayed ~15 min. as of 07:58 ET
High-beta momentum cohort (eq-wt, since-2020 rank): -0.2% 42%ile · rest of market -0.1%
| Factor | Today | 1d | 5d | 20d | 60d |
|---|---|---|---|---|---|
| Style-Risk | |||||
| Residual Volatility | -0.24% z-0.5 | +0.17% | -0.31% | +3.47% | -4.22% |
| International | -0.05% z-0.2 | +0.25% | +0.72% | +0.06% | -0.63% |
| Beta | +0.07% z+0.1 | +1.14% | -0.01% | +5.99% | -7.92% |
| Style | |||||
| Leverage | +0.09% z+0.5 | +0.13% | +0.08% | -1.78% | -2.73% |
| Liquidity | -0.10% z-0.4 | +0.06% | -0.21% | +2.85% | -1.81% |
| Profitability | +0.05% z+0.2 | -0.20% | +0.16% | -1.49% | -1.31% |
| Dividend Yield | -0.04% z-0.2 | +0.00% | -0.03% | +0.65% | -0.71% |
| Size | -0.05% z-0.1 | -0.08% | +0.04% | -0.12% | -1.91% |
| Value | +0.02% z+0.1 | -0.27% | -0.14% | -0.57% | -0.86% |
| Growth | -0.01% z-0.0 | -0.12% | -0.30% | +0.13% | +1.91% |
| Style-Momentum | |||||
| Medium-Term Momentum | -0.21% z-0.7 | -0.16% | +0.11% | +0.46% | +0.90% |
| Short-Term Momentum | -0.12% z-0.4 | +0.27% | +0.94% | -3.03% | -8.04% |
| Long-Term Momentum | -0.13% z-0.2 | +0.02% | -0.65% | -0.60% | -4.94% |
| One-Day Momentum | +0.04% z+0.1 | +0.04% | +0.44% | -1.33% | -0.96% |
| Style-Positioning | |||||
| Hedge-Fund Ownership | +0.02% z+0.2 | +0.08% | +0.23% | +0.56% | +1.26% |
| Short Interest | -0.03% z-0.2 | +0.15% | -0.14% | -0.78% | +0.67% |
| Style-Flow | |||||
| Short-Sale Activity | -0.03% z-0.3 | -0.06% | -0.14% | +0.43% | +0.52% |
| Morning Activity | +0.01% z+0.1 | -0.00% | +0.12% | +1.93% | +1.22% |
| Thematic | |||||
| Bitcoin / Crypto | -0.22% z-0.7 | +0.04% | +0.55% | +1.14% | +1.18% |
| Oil | -0.20% z-0.4 | -0.14% | -0.01% | +3.33% | -2.32% |
| China | -0.15% z-0.4 | -0.11% | -0.14% | -0.49% | -1.67% |
| Gold | -0.10% z-0.3 | +0.63% | +1.50% | +4.34% | +3.54% |
| Semiconductors | +0.06% z+0.1 | -0.16% | -1.31% | -0.67% | -4.65% |
| Treasury (Duration) | +0.02% z+0.1 | -0.09% | +0.03% | -0.33% | +0.75% |
5/20/60d windows include today's session; 1d is the previous session.
Market variance share. The fraction of cross-sectional variance explained by the market factor — the attribution companion to pairwise correlation, not a substitute for it.
Factor z-score. Today's factor return divided by its daily-return standard deviation over ~1,600 trading days.
High-beta momentum cohort. US names above $2B market cap in the top quintile of both raw beta and 12-month momentum; membership frozen at each month's first business day. “Top 50” = the 50 strongest by combined rank.
Stock-specific (idiosyncratic) return. The part of a stock's move not explained by market, style, or thematic factors in our decomposition.
Data compiled by FactorPulse AI; edited and verified by Jeff Klein. For informational purposes only. Does not constitute financial advice, an investment recommendation, or an offer to buy or sell any securities. Always consult a qualified financial professional before making investment decisions.
For more on factor construction methodology, see www.factorpulse.com/glossary.