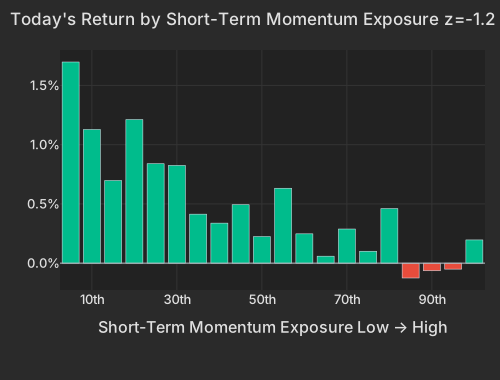
This morning's bid is proportional to last week's damage. Beta is doing the work at +0.92% and z=+0.95, with its highest-exposure bucket up +2.7%, while Short-Term Momentum's left tail — the worst recent multi-day losers — is up +1.8%. That combination is the same short-horizon reversion pattern that has run for three months, not a fresh verdict on AI capital spending.
The pre-open tape is sorted by last week's losses. Roundhill's memory-chip fund (DRAM) is up +4.00% after five sessions of -10.12%. iShares MSCI South Korea (EWY) is up +3.54% against a five-day -6.19%. Beta is the axis carrying it, and that single factor accounts for 38.8% of pre-open cross-sectional variance against 6.9% for Short-Term Momentum — the risk dial is where the whole cross-section is loading before the bell.
The second axis tells you which risk. Short-Term Momentum is -0.38% at z=-1.23, and the print is entirely one-sided: the worst recent multi-day losers are up +1.8% while the recent winners sit still. Inside that left tail, three AI, semiconductor and data-center names carry +3.0% and two defense names +1.1%.
| Factor | Return | Z-Score | 5d Z | 20d Z | 63d Z | Category | Direction |
|---|---|---|---|---|---|---|---|
| Beta | +0.92% | +0.95 | -0.50 | +0.72 | -0.89 | Style-Risk | High-beta names outperformed |
| Short-Term Momentum | -0.38% | -1.23 | +0.14 | -2.73 | -3.39 | Style-Momentum | Recent losers outperformed |
| Gold | -0.23% | -0.72 | +2.88 | +2.50 | +0.78 | Thematic | Gold-exposed lagged |
| Oil | -0.29% | -0.62 | +0.12 | +1.84 | -0.35 | Thematic | Oil-exposed lagged |
| Semiconductors | +0.35% | +0.58 | -2.01 | -0.42 | -1.64 | Thematic | Semis-exposed outperformed |
| Morning Activity | -0.07% | -0.54 | +2.48 | +3.83 | +0.94 | Style-Flow | Morning-heavy names lagged |
| Short Interest | -0.07% | -0.39 | +0.72 | -0.85 | +1.16 | Style-Positioning | Most-shorted names lagged |
| Hedge-Fund Ownership | +0.02% | +0.14 | +1.62 | +1.23 | +1.26 | Style-Positioning | Flat |
| Bucket | Avg Ret Pct |
|---|---|
| 1 | 1.70 |
| 2 | 1.13 |
| 3 | 0.70 |
| 4 | 1.21 |
| 5 | 0.84 |
| 6 | 0.83 |
| 7 | 0.41 |
| 8 | 0.34 |
| 9 | 0.49 |
| 10 | 0.22 |
| 11 | 0.63 |
| 12 | 0.25 |
| 13 | 0.06 |
| 14 | 0.29 |
| 15 | 0.10 |
| 16 | 0.46 |
| 17 | -0.13 |
| 18 | -0.06 |
| 19 | -0.05 |
| 20 | 0.20 |
The semiconductor bid has almost no company news in it. MaxLinear is up +3.30%, Ultra Clean +3.67% and Aehr Test Systems +4.89%, and in each the day's factor complex — Beta above all — accounts for essentially the entire move. Nvidia's +1.24% is built the same way ahead of its report tomorrowEconomic Times, and Micron is up +2.57% one session after falling 7% to roughly $898Economic Times.
| ETF | Theme | Today | 1d Ago | 5d Ago | 20d Ago | 63d Ago |
|---|---|---|---|---|---|---|
| DRAM | memory chips & storage | +4.00% | -5.89% | -10.12% | +3.53% | +2.76% |
| EWY | south korea | +3.54% | -2.64% | -6.19% | +7.72% | -4.61% |
| SMH | semiconductors | +2.16% | -2.43% | -7.96% | -0.32% | -5.12% |
| AIPO | AI power infrastructure | +1.97% | -1.69% | -8.79% | -2.10% | -12.18% |
| WGMI | crypto miners | +1.96% | -2.42% | -10.98% | -13.38% | -27.94% |
| MTUM | momentum | +1.40% | -1.50% | -6.67% | -0.58% | -0.99% |
| SPY | large cap | +0.50% | -0.29% | -1.19% | +3.30% | +2.39% |
| GDX | gold | -0.47% | +0.69% | +12.68% | +36.72% | +21.78% |
| XLE | energy | -1.10% | -0.83% | +0.85% | +8.14% | +6.09% |
| USO | oil | -3.15% | -1.80% | +1.47% | +5.97% | -6.18% |
Today is not an isolated snap-back. Short-Term Momentum has returned -3.73% over the past 20 sessions, with 20- and 63-day z-scores of -2.73 and -3.39. Same-sign readings at both windows mean one thing at every horizon: for three months, whichever names moved most over the prior week have reversed the week after.
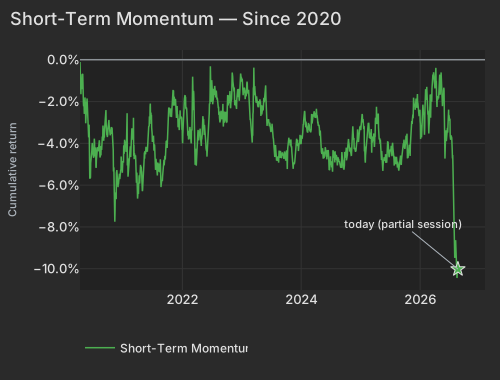
| Date | Cumret Pct |
|---|---|
| 2020-04-13 | -0.11 |
| 2020-05-05 | -2.23 |
| 2020-05-28 | -2.78 |
| 2020-06-19 | -4.56 |
| 2020-07-14 | -4.58 |
| 2020-08-05 | -4.22 |
| 2020-08-27 | -3.70 |
| 2020-09-21 | -3.07 |
| 2020-10-13 | -3.42 |
| 2020-11-04 | -5.34 |
| 2020-11-27 | -5.64 |
| 2020-12-21 | -5.29 |
| 2021-01-14 | -4.09 |
| 2021-02-08 | -5.07 |
| 2021-03-03 | -3.45 |
| 2021-03-25 | -5.89 |
| 2021-04-19 | -5.19 |
| 2021-05-11 | -4.94 |
| 2021-06-03 | -3.73 |
| 2021-06-25 | -2.64 |
| 2021-07-20 | -4.66 |
| 2021-08-11 | -5.03 |
| 2021-09-02 | -5.57 |
| 2021-09-27 | -3.92 |
| 2021-10-19 | -2.60 |
| 2021-11-10 | -2.20 |
| 2021-12-03 | -2.61 |
| 2021-12-28 | -2.82 |
| 2022-01-20 | -1.78 |
| 2022-02-11 | -3.78 |
| 2022-03-08 | -1.30 |
| 2022-03-30 | -4.67 |
| 2022-04-22 | -3.57 |
| 2022-05-16 | -3.27 |
| 2022-06-08 | -3.71 |
| 2022-07-01 | -0.97 |
| 2022-07-26 | -1.57 |
| 2022-08-17 | -2.48 |
| 2022-09-09 | -2.79 |
| 2022-10-03 | -2.98 |
| 2022-10-25 | -2.27 |
| 2022-11-16 | -1.52 |
| 2022-12-09 | -1.67 |
| 2023-01-04 | -1.06 |
| 2023-01-27 | -1.47 |
| 2023-02-21 | -2.42 |
| 2023-03-15 | -1.33 |
| 2023-04-06 | -1.93 |
| 2023-05-01 | -2.69 |
| 2023-05-23 | -1.91 |
| 2023-06-15 | -2.87 |
| 2023-07-11 | -3.22 |
| 2023-08-02 | -4.78 |
| 2023-08-24 | -4.70 |
| 2023-09-18 | -4.56 |
| 2023-10-10 | -5.23 |
| 2023-11-01 | -3.81 |
| 2023-11-24 | -4.87 |
| 2023-12-18 | -4.37 |
| 2024-01-11 | -3.64 |
| 2024-02-05 | -3.25 |
| 2024-02-28 | -3.31 |
| 2024-03-21 | -2.50 |
| 2024-04-15 | -3.05 |
| 2024-05-07 | -4.42 |
| 2024-05-30 | -4.18 |
| 2024-06-24 | -5.27 |
| 2024-07-17 | -4.33 |
| 2024-08-08 | -4.63 |
| 2024-08-30 | -5.09 |
| 2024-09-24 | -5.13 |
| 2024-10-16 | -4.18 |
| 2024-11-07 | -4.57 |
| 2024-12-02 | -4.32 |
| 2024-12-24 | -3.80 |
| 2025-01-21 | -3.13 |
| 2025-02-12 | -3.66 |
| 2025-03-07 | -3.50 |
| 2025-03-31 | -3.94 |
| 2025-04-23 | -3.25 |
| 2025-05-15 | -4.82 |
| 2025-06-09 | -4.87 |
| 2025-07-02 | -4.36 |
| 2025-07-25 | -4.52 |
| 2025-08-18 | -5.16 |
| 2025-09-10 | -5.03 |
| 2025-10-02 | -4.26 |
| 2025-10-24 | -4.63 |
| 2025-11-17 | -3.07 |
| 2025-12-10 | -1.86 |
| 2026-01-05 | -2.93 |
| 2026-01-28 | -2.63 |
| 2026-02-20 | -2.63 |
| 2026-03-16 | -2.01 |
| 2026-04-08 | -0.89 |
| 2026-04-30 | -1.79 |
| 2026-05-22 | -1.97 |
| 2026-06-16 | -3.73 |
| 2026-07-10 | -3.83 |
| 2026-08-03 | -8.25 |
| 2026-08-25 | -10.02 |
The stress that set this up is documented. Morgan Stanley's prime brokerage desk recorded the second-largest weekly reduction in global equity exposure in twelve months in the week through August 20, led by de-grossing in Japan, China and Taiwan, and puts hedge-fund net exposure to Asia-Pacific semiconductors and hardware at 17% against a June peak of 23%. Bank of America's systematic flows monitor has CTA equity positioning back at pre-conflict levels, covered window unstated. The volatility configuration is the matching one: implied single-stock volatility (Cboe VIXEQ) sits at 38.14, the 81st percentile of its own history, while implied index volatility (Cboe VIX) at 15.76 is 24% below its 20-session high of 20.66 set July 29. Stretched single-stock volatility with index volatility easing off a local high is the setting in which short-horizon reversion runs strongest.
It has also paid nothing for a week. Over the past five sessions Short-Term Momentum has returned +0.10% at z=+0.14 — flat — and today's one-day print is mild by the factor's own dispersion. Beta's variance share dwarfs it this morning, which makes this a broad risk bid before it is anything more specific.
The ownership lenses do not hand the bid to hedge funds. Hedge-Fund Ownership is flat on the residualized measure at z=+0.14 and only +0.07% on a raw basis; the hedge-fund-owned names are participating through their beta tilt, absorbed upstream, rather than on their own axis. Short Interest is -0.07% at z=-0.39, with the most heavily shorted names lagging the barely-shorted ones and the model's most persistent drag still paying — that rules out short-covering as the mechanism.
What has quietly been paying is Morning Activity, the standing tilt toward names that habitually run volume-heavy mornings, a group skewing retail and international. Its 20-day z is +3.83, among the strongest stretches the factor has produced since 2020, though it gives a little back today at z=-0.54. FactorPulse's top 50 high-beta momentum names are up +2.99% pre-open against +0.09% for the names outside the screen, and that group carries a retail-heavy morning-trading tilt of 1.29σ — the bounce is concentrated in exactly the ownership base that has been rewarded all month.
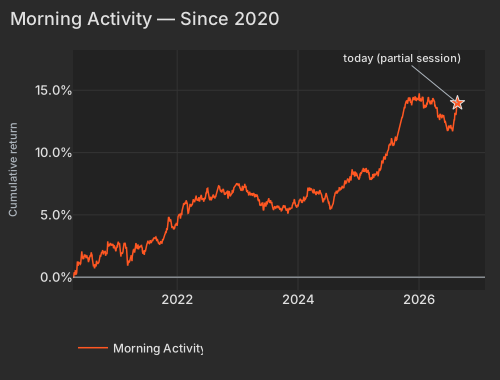
| Date | Cumret Pct |
|---|---|
| 2020-04-13 | -0.07 |
| 2020-05-05 | 0.37 |
| 2020-05-28 | 1.08 |
| 2020-06-19 | 1.82 |
| 2020-07-14 | 1.33 |
| 2020-08-05 | 1.83 |
| 2020-08-27 | 0.85 |
| 2020-09-21 | 1.45 |
| 2020-10-13 | 1.82 |
| 2020-11-04 | 1.91 |
| 2020-11-27 | 2.63 |
| 2020-12-21 | 2.46 |
| 2021-01-14 | 2.69 |
| 2021-02-08 | 1.89 |
| 2021-03-03 | 1.92 |
| 2021-03-25 | 1.45 |
| 2021-04-19 | 2.13 |
| 2021-05-11 | 2.59 |
| 2021-06-03 | 2.40 |
| 2021-06-25 | 2.29 |
| 2021-07-20 | 2.76 |
| 2021-08-11 | 3.12 |
| 2021-09-02 | 2.99 |
| 2021-09-27 | 2.71 |
| 2021-10-19 | 3.41 |
| 2021-11-10 | 4.55 |
| 2021-12-03 | 4.05 |
| 2021-12-28 | 4.30 |
| 2022-01-20 | 4.96 |
| 2022-02-11 | 5.90 |
| 2022-03-08 | 5.14 |
| 2022-03-30 | 5.82 |
| 2022-04-22 | 6.31 |
| 2022-05-16 | 6.14 |
| 2022-06-08 | 6.33 |
| 2022-07-01 | 7.10 |
| 2022-07-26 | 6.33 |
| 2022-08-17 | 6.45 |
| 2022-09-09 | 7.32 |
| 2022-10-03 | 6.94 |
| 2022-10-25 | 6.77 |
| 2022-11-16 | 6.75 |
| 2022-12-09 | 7.01 |
| 2023-01-04 | 7.49 |
| 2023-01-27 | 7.07 |
| 2023-02-21 | 7.32 |
| 2023-03-15 | 6.81 |
| 2023-04-06 | 6.67 |
| 2023-05-01 | 6.58 |
| 2023-05-23 | 5.72 |
| 2023-06-15 | 5.88 |
| 2023-07-11 | 6.33 |
| 2023-08-02 | 5.66 |
| 2023-08-24 | 5.61 |
| 2023-09-18 | 5.46 |
| 2023-10-10 | 5.68 |
| 2023-11-01 | 5.37 |
| 2023-11-24 | 5.53 |
| 2023-12-18 | 5.95 |
| 2024-01-11 | 6.19 |
| 2024-02-05 | 6.21 |
| 2024-02-28 | 6.70 |
| 2024-03-21 | 7.10 |
| 2024-04-15 | 6.73 |
| 2024-05-07 | 6.70 |
| 2024-05-30 | 6.22 |
| 2024-06-24 | 6.63 |
| 2024-07-17 | 5.43 |
| 2024-08-08 | 6.36 |
| 2024-08-30 | 6.85 |
| 2024-09-24 | 7.18 |
| 2024-10-16 | 7.50 |
| 2024-11-07 | 7.60 |
| 2024-12-02 | 8.29 |
| 2024-12-24 | 8.28 |
| 2025-01-21 | 8.34 |
| 2025-02-12 | 8.50 |
| 2025-03-07 | 8.42 |
| 2025-03-31 | 8.23 |
| 2025-04-23 | 8.33 |
| 2025-05-15 | 8.58 |
| 2025-06-09 | 9.63 |
| 2025-07-02 | 10.24 |
| 2025-07-25 | 10.79 |
| 2025-08-18 | 11.19 |
| 2025-09-10 | 12.27 |
| 2025-10-02 | 13.45 |
| 2025-10-24 | 14.13 |
| 2025-11-17 | 14.00 |
| 2025-12-10 | 14.39 |
| 2026-01-05 | 14.48 |
| 2026-01-28 | 14.47 |
| 2026-02-20 | 14.01 |
| 2026-03-16 | 13.97 |
| 2026-04-08 | 14.09 |
| 2026-04-30 | 13.08 |
| 2026-05-22 | 12.93 |
| 2026-06-16 | 12.28 |
| 2026-07-10 | 11.95 |
| 2026-08-03 | 12.45 |
| 2026-08-25 | 13.98 |
Dick's Sporting Goods is down -17.37% pre-open, erasing $2.7B of market value. Second-quarter adjusted earnings came in at $3.53 a share against $3.76 expected, on revenue of $5.59 billionCNBC. Management cut full-year net sales guidance to a $21.9–22.2 billion range and named a challenging footwear market, with Foot Locker comparable sales down 3.6%CNBC. Nike is down -3.07% on the read-through, falling a further -1.84% in the last hour.
Tariff policy shows up on both sides of the same page. Acuity is up +10.83%, adding $1.1B of market value, on a fourth-quarter beat and expedited tariff refunds under the Treasury planBloomberg; the Dick's quarter included $59 million of tariff refundsCNBC. Canada's banks split on credit: Scotiabank is up +2.61% with third-quarter provisions of $1.08 billion per its quarterly filing, while Bank of Montreal manages only +0.27% despite provisions falling to $722 million.
Energy is the weak spot. USO is down -3.15% and XLE -1.10%, with the Oil factor -0.29% at z=-0.62; the move comes with Treasury Secretary Bessent's Iran sanctions plan still being digestedBloomberg. Gold is pausing rather than turning: the Gold factor is -0.23% today after 5- and 20-day z-scores of +2.88 and +2.50, and GDX hands back -0.47% against +36.72% over 20 sessions. The curve is lower across the board, the 10-year Treasury yield at 4.662%, down 4.2 basis points, with the belly leadingCNBC. The dollar is unchanged at 99.03CNBC, which leaves the silver and gold giveback without a currency explanation.
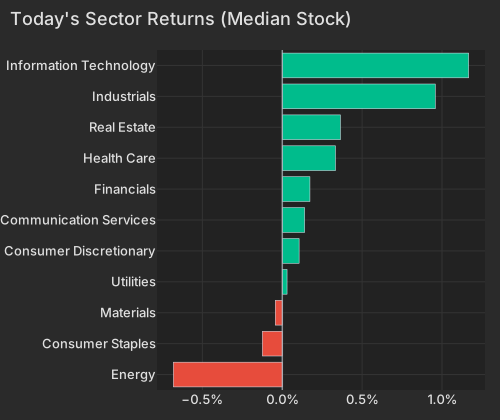
| Sector | Median Ret Pct |
|---|---|
| Energy | -0.68 |
| Consumer Staples | -0.12 |
| Materials | -0.04 |
| Utilities | 0.03 |
| Consumer Discretionary | 0.11 |
| Communication Services | 0.14 |
| Financials | 0.17 |
| Health Care | 0.33 |
| Real Estate | 0.36 |
| Industrials | 0.96 |
| Information Technology | 1.17 |
The Philadelphia Fed Non-Manufacturing Survey is due at 8:30 AM ET, with the general activity index expected to stay in expansion and the prices-paid component the component to watch for service-sector inflation. Consumer Confidence follows at 10:00 AM ET, where consensus looks for a slip to 90.3 from 90.8, with inflation expectations still above 3% and a narrowing "jobs plentiful" differential the softer detail underneath. The Richmond Fed manufacturing index, also at 10:00 AM ET, is expected to improve to 6 from July's 5. The bigger date is Thursday: the Jackson Hole symposium runs August 27–29, where Chair Kevin Warsh addresses inflation that has run above the 2% target for more than five yearsEconomic Times.
Variance decomposition: live intraday — 20260825 session, bracketed against its trailing-year range. Factor returns are trailing through last close. Total cross-sectional dispersion: 1.6%ile of the past year.
Variance mix — % of total, today vs 1d ago vs 1-yr avg
market 68%ile style 97.2%ile thematic 23%ile idiosyncratic 3.2%ile
Variance explained — today vs. factor's trailing-year range
Marker = the factor's share of today's total variance, placed in its own trailing-year range (box 25–75%ile, ticks 90%ile and max). Amber marker = unusually load-bearing today (≥90%ile of its own year). Factor name green = up today / red = down.
Correlation & dispersion — realized vs implied
Pairwise realized correlation (20d): 10.32% 8.7%ile since 2020 · 70%ile 3m
Top-500 pairwise: 11.02% 9.8%ile since 2020 · 65%ile 3m · implied (Cboe COR1M): 9.28 2.9%ile of its own history (gap +1.7pp)
Realized 20d vol (ann. pts): all stocks 49 vs VIXEQ 38 · index 13 vs VIX 16 · style factors 25 87%ile
20-day window (19 completed days + today); percentiles vs model history since 2020; '3m' tokens rank vs the trailing 63 trading days; definitions in Terms below. Implied prints (Cboe) are delayed ~15 min. as of 07:58 ET
Top 50 high-beta momentum names (eq-wt, since-2020 rank): +3.0% 87%ile · rest of market +0.1%
| Factor | Today | 1d | 5d | 20d | 60d |
|---|---|---|---|---|---|
| Style-Risk | |||||
| Beta | +0.92% z+0.9 | -1.41% | -1.08% | +3.12% | -8.33% |
| International | -0.10% z-0.3 | -0.04% | +0.62% | +0.11% | -0.56% |
| Residual Volatility | +0.01% z+0.0 | -0.44% | +0.32% | +3.92% | -2.38% |
| Style | |||||
| Leverage | +0.12% z+0.7 | -0.02% | -0.10% | -2.07% | -3.03% |
| Liquidity | +0.12% z+0.4 | -0.24% | +0.03% | +2.47% | -1.53% |
| Profitability | +0.06% z+0.3 | +0.17% | +0.12% | -1.23% | -0.78% |
| Dividend Yield | -0.04% z-0.2 | -0.11% | -0.17% | +0.46% | -0.92% |
| Value | -0.04% z-0.1 | +0.11% | +0.03% | -0.44% | -0.85% |
| Growth | +0.03% z+0.1 | -0.10% | -0.30% | +0.35% | +2.51% |
| Size | +0.04% z+0.1 | +0.25% | -0.27% | +0.03% | -1.79% |
| Style-Momentum | |||||
| Short-Term Momentum | -0.37% z-1.2 | +0.22% | +0.10% | -3.73% | -8.69% |
| Medium-Term Momentum | -0.16% z-0.6 | +0.08% | +1.04% | +1.12% | +1.68% |
| Long-Term Momentum | +0.14% z+0.2 | -0.44% | -1.86% | -0.75% | -4.49% |
| One-Day Momentum | -0.05% z-0.2 | -0.05% | +0.78% | -0.68% | +0.45% |
| Style-Positioning | |||||
| Short Interest | -0.06% z-0.3 | +0.05% | +0.28% | -0.64% | +0.75% |
| Hedge-Fund Ownership | +0.02% z+0.2 | +0.09% | +0.41% | +0.61% | +1.15% |
| Style-Flow | |||||
| Morning Activity | -0.07% z-0.5 | -0.06% | +0.70% | +2.16% | +1.13% |
| Short-Sale Activity | -0.01% z-0.1 | -0.02% | +0.14% | +0.48% | +0.55% |
| Thematic | |||||
| Gold | -0.24% z-0.7 | +0.06% | +2.08% | +3.61% | +2.01% |
| Oil | -0.28% z-0.6 | -0.51% | +0.14% | +3.93% | -1.04% |
| Semiconductors | +0.34% z+0.6 | -0.67% | -2.73% | -1.15% | -5.35% |
| Bitcoin / Crypto | -0.17% z-0.6 | +0.14% | +0.91% | +1.38% | +0.63% |
| Treasury (Duration) | -0.11% z-0.3 | -0.11% | +0.34% | -0.23% | +0.37% |
| China | -0.09% z-0.2 | -0.17% | +0.15% | +0.07% | -1.70% |
5/20/60d windows include today's session; 1d is the previous session.
Market variance share. The fraction of cross-sectional variance explained by the market factor — the attribution companion to pairwise correlation, not a substitute for it.
Factor z-score. Today's factor return divided by its daily-return standard deviation over ~1,600 trading days.
High-beta momentum cohort. US names above $2B market cap in the top quintile of both raw beta and 12-month momentum; membership frozen at each month's first business day. “Top 50” = the 50 strongest by combined rank.
Dispersion (realized). Total cross-sectional volatility net of the market component; high dispersion is the flip side of low correlation.
VIXEQ / DSPX / COR1M. Cboe implied indices: single-stock volatility, dispersion, and 1-month implied correlation (top-50 S&P names). Quotes delayed ~15 minutes.
Data compiled by FactorPulse AI; edited and verified by Jeff Klein. For informational purposes only. Does not constitute financial advice, an investment recommendation, or an offer to buy or sell any securities. Always consult a qualified financial professional before making investment decisions.
For more on factor construction methodology, see www.factorpulse.com/glossary.