Crude's roughly -4% slide pulled every Treasury tenor lower, and the equity cross-section spent the proceeds on Beta: +1.20% at z=+1.2, with the highest-exposure decile up +2.96% while SPY added +0.31%. The Oil factor itself barely registered at z=-0.3, so this was a sector selloff and a duration event rather than any repricing of oil exposure across the market.
Crude fell -4% as traders looked past the supply threat in Treasury Secretary Scott Bessent's "Operation Economic Outcast" secondary sanctions on IranNYT, and the bond market took it as an inflation reprieveBloomberg. The equity expression was almost entirely Beta. What ran was the long-duration, high-volatility end of the market — uranium and nuclear developers, ARK's innovation names, unprofitable biotech — and not the index, which is why Profitability printed -0.20% at z=-1.1 with its least-profitable bucket up +1.95%.
| Factor | Return | Z-Score | 5d Z | 20d Z | 63d Z | Category | Direction |
|---|---|---|---|---|---|---|---|
| Gold | +0.59% | z=+1.8 | +4.0 | +3.1 | +1.1 | Thematic | Gold-exposed names led |
| Beta | +1.20% | z=+1.2 | -0.4 | +0.8 | -0.9 | Style-Risk | High-beta names led |
| Value | -0.27% | z=-1.1 | -0.4 | -0.6 | -0.6 | Style | Cheapest names lagged the growth-priced |
| Profitability | -0.20% | z=-1.1 | -0.3 | -1.8 | -1.1 | Style | Least-profitable names led |
| Medium-Term Momentum | -0.22% | z=-0.8 | +1.5 | +0.8 | +0.9 | Style-Momentum | The past month's winners gave back |
| Short Interest | +0.09% | z=+0.6 | +1.1 | -0.6 | +1.3 | Style-Positioning | Most-shorted names outperformed |
| Short-Sale Activity | -0.07% | z=-0.6 | +0.3 | +0.9 | +0.6 | Style-Flow | Yesterday's most short-sold names lagged |
| Oil | -0.13% | z=-0.3 | +0.3 | +1.9 | -0.3 | Thematic | Oil-exposed names lagged slightly |
The 10-year fell 7.9 basis points to 4.625% and the 7-year 8.1 to 4.459%CNBC. Three-month bills gave up 1.6 basis points, so the entire move sat where inflation and growth expectations live rather than where policy does. TLT gained +1.11%, investment-grade credit +0.62%, and the dollar eased to 98.87CNBC — the standard tailwind combination for anything valued on distant cash flows.
| ETF | Theme | Today | 1d Ago | 5d Ago | 20d Ago | 63d Ago |
|---|---|---|---|---|---|---|
| URA | uranium | +5.82% | -0.82% | +0.97% | +13.32% | -6.68% |
| ARKK | innovation growth | +3.00% | -2.66% | +2.65% | +15.70% | +9.84% |
| XBI | biotech growth | +2.91% | -0.94% | +2.91% | +9.02% | +24.69% |
| GDX | gold miners | +1.96% | +0.69% | +12.68% | +36.72% | +21.78% |
| SMH | semiconductors | +1.88% | -2.43% | -7.96% | -0.32% | -5.12% |
| TLT | long-term bonds | +1.11% | +0.62% | +1.49% | -1.42% | -2.50% |
| IGV | software | -1.41% | -0.89% | +0.45% | +12.69% | +8.98% |
| XLE | energy | -1.86% | -0.83% | +0.85% | +8.14% | +6.09% |
| XOP | oil E&P | -2.08% | -1.74% | +1.58% | +10.15% | +8.31% |
| USO | crude oil | -5.37% | -1.80% | +1.47% | +5.97% | -6.18% |
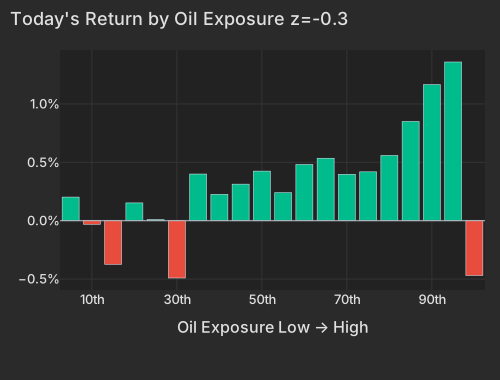
Energy was the day's worst sector at -1.14%, with Exxon -2.19% and Chevron -1.59%. Yet the Oil factor — the spread between the most and least oil-exposed names — returned -0.13%, and its top-exposure bucket gave back only -0.50%. Twenty days of gains in that spread, +4.08%, survived the session almost untouched. Anyone hedged on oil exposure got no help today; the loss was concentrated in the E&P and integrated names themselves, exactly where XOP's -2.08% says it was.
| Bucket | Avg Ret Pct |
|---|---|
| 1 | 0.20 |
| 2 | -0.03 |
| 3 | -0.37 |
| 4 | 0.15 |
| 5 | 0.01 |
| 6 | -0.49 |
| 7 | 0.40 |
| 8 | 0.23 |
| 9 | 0.31 |
| 10 | 0.42 |
| 11 | 0.24 |
| 12 | 0.48 |
| 13 | 0.53 |
| 14 | 0.40 |
| 15 | 0.42 |
| 16 | 0.56 |
| 17 | 0.85 |
| 18 | 1.17 |
| 19 | 1.36 |
| 20 | -0.47 |
That also explains the odd shape of Beta's spread. The high-exposure decile ran +2.96%, but the low-exposure decile fell -1.49%, and the names sitting in it are energy producers — VG, KOS, SM. Roughly half of today's beta spread is the crude selloff parked in the low-beta bucket, which means a low-volatility book did not simply sit out the rally; it wore the oil move.
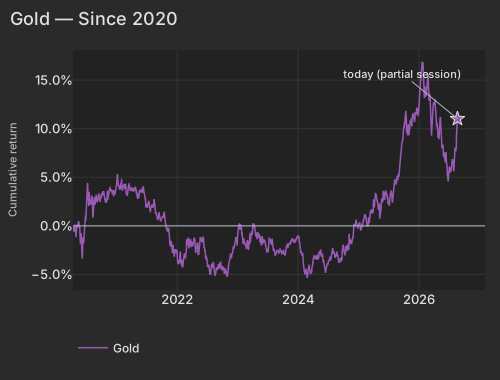
One theme is running on its own clock. The Gold factor added +0.59% at z=+1.8, its gold-miner bucket up +2.32%, with GDX +1.96% on the day and +36.72% over twenty sessions. The completed five-day run through yesterday's close was +2.90% at z=+4.0 — the strongest of every overlapping five-day window since 2020.
| Date | Cumret Pct |
|---|---|
| 2020-04-13 | -0.06 |
| 2020-05-05 | -0.17 |
| 2020-05-28 | -1.41 |
| 2020-06-19 | -0.61 |
| 2020-07-14 | 2.65 |
| 2020-08-05 | 3.11 |
| 2020-08-27 | 2.57 |
| 2020-09-21 | 2.85 |
| 2020-10-13 | 3.36 |
| 2020-11-04 | 2.69 |
| 2020-11-27 | 3.75 |
| 2020-12-21 | 3.31 |
| 2021-01-14 | 4.11 |
| 2021-02-08 | 3.99 |
| 2021-03-03 | 3.27 |
| 2021-03-25 | 3.66 |
| 2021-04-19 | 3.65 |
| 2021-05-11 | 3.10 |
| 2021-06-03 | 3.66 |
| 2021-06-25 | 2.35 |
| 2021-07-20 | 1.60 |
| 2021-08-11 | 2.16 |
| 2021-09-02 | 0.83 |
| 2021-09-27 | 0.47 |
| 2021-10-19 | 1.07 |
| 2021-11-10 | -0.53 |
| 2021-12-03 | -2.78 |
| 2021-12-28 | -2.60 |
| 2022-01-20 | -2.63 |
| 2022-02-11 | -3.08 |
| 2022-03-08 | -1.28 |
| 2022-03-30 | -1.92 |
| 2022-04-22 | -2.25 |
| 2022-05-16 | -2.49 |
| 2022-06-08 | -1.32 |
| 2022-07-01 | -3.37 |
| 2022-07-26 | -4.42 |
| 2022-08-17 | -4.84 |
| 2022-09-09 | -3.97 |
| 2022-10-03 | -4.16 |
| 2022-10-25 | -4.86 |
| 2022-11-16 | -3.45 |
| 2022-12-09 | -2.14 |
| 2023-01-04 | -0.48 |
| 2023-01-27 | -0.91 |
| 2023-02-21 | -1.86 |
| 2023-03-15 | -1.68 |
| 2023-04-06 | 0.28 |
| 2023-05-01 | -1.38 |
| 2023-05-23 | -1.16 |
| 2023-06-15 | -1.43 |
| 2023-07-11 | -2.05 |
| 2023-08-02 | -2.01 |
| 2023-08-24 | -2.61 |
| 2023-09-18 | -2.45 |
| 2023-10-10 | -2.85 |
| 2023-11-01 | -1.81 |
| 2023-11-24 | -1.67 |
| 2023-12-18 | -1.62 |
| 2024-01-11 | -1.69 |
| 2024-02-05 | -3.88 |
| 2024-02-28 | -5.36 |
| 2024-03-21 | -4.76 |
| 2024-04-15 | -3.24 |
| 2024-05-07 | -3.32 |
| 2024-05-30 | -2.93 |
| 2024-06-24 | -4.24 |
| 2024-07-17 | -3.21 |
| 2024-08-08 | -2.79 |
| 2024-08-30 | -3.13 |
| 2024-09-24 | -3.20 |
| 2024-10-16 | -2.60 |
| 2024-11-07 | -0.82 |
| 2024-12-02 | -1.25 |
| 2024-12-24 | 0.22 |
| 2025-01-21 | -0.23 |
| 2025-02-12 | 0.99 |
| 2025-03-07 | 0.62 |
| 2025-03-31 | 1.36 |
| 2025-04-23 | 2.75 |
| 2025-05-15 | 1.17 |
| 2025-06-09 | 3.06 |
| 2025-07-02 | 2.36 |
| 2025-07-25 | 2.77 |
| 2025-08-18 | 4.72 |
| 2025-09-10 | 6.33 |
| 2025-10-02 | 9.87 |
| 2025-10-24 | 9.89 |
| 2025-11-17 | 10.58 |
| 2025-12-10 | 10.94 |
| 2026-01-05 | 12.48 |
| 2026-01-28 | 16.84 |
| 2026-02-20 | 13.89 |
| 2026-03-16 | 12.09 |
| 2026-04-08 | 12.54 |
| 2026-04-30 | 9.81 |
| 2026-05-22 | 8.00 |
| 2026-06-16 | 7.56 |
| 2026-07-10 | 5.48 |
| 2026-08-03 | 5.60 |
| 2026-08-25 | 11.02 |
The horizon profile says how young this is. Gold exposure has sorted returns positively at one day, five days and twenty days, but at sixty-three the slope is essentially flat — this is a summer trade being priced hard, not a year-long grind.
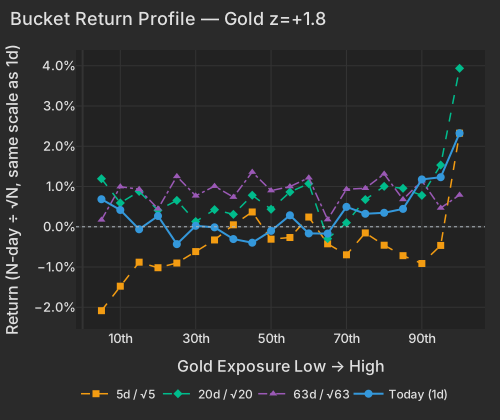
| Bucket | Ret 1D Pct | Ret 5D Norm Pct | Ret 20D Norm Pct | Ret 63D Norm Pct |
|---|---|---|---|---|
| 1 | 0.68 | -2.08 | 1.19 | 0.17 |
| 2 | 0.42 | -1.48 | 0.59 | 1.00 |
| 3 | -0.06 | -0.88 | 0.88 | 0.93 |
| 4 | 0.27 | -1.02 | 0.41 | 0.45 |
| 5 | -0.43 | -0.90 | 0.65 | 1.25 |
| 6 | 0.02 | -0.62 | 0.13 | 0.77 |
| 7 | -0.01 | -0.33 | 0.43 | 1.01 |
| 8 | -0.31 | 0.05 | 0.31 | 0.74 |
| 9 | -0.40 | 0.37 | 0.78 | 1.36 |
| 10 | -0.10 | -0.31 | 0.43 | 0.90 |
| 11 | 0.29 | -0.27 | 0.86 | 1.00 |
| 12 | -0.16 | 0.24 | 1.07 | 1.22 |
| 13 | -0.17 | -0.42 | -0.30 | 0.18 |
| 14 | 0.49 | -0.70 | 0.10 | 0.93 |
| 15 | 0.32 | -0.15 | 0.68 | 0.96 |
| 16 | 0.35 | -0.46 | 1.00 | 1.31 |
| 17 | 0.44 | -0.72 | 0.96 | 0.68 |
| 18 | 1.18 | -0.91 | 0.78 | 1.14 |
| 19 | 1.23 | -0.46 | 1.53 | 0.47 |
| 20 | 2.32 | 2.32 | 3.94 | 0.79 |
Oil was not the only thing pushing the belly of the curve down. The morning's data was uniformly soft — the Philadelphia Fed's service-sector gauge swung into contraction, Richmond manufacturing missed, and consumer confidence hit a seven-month low — so part of the bond rally is a growth read wearing an inflation costume. The equity evidence arrived in one name: Dick's Sporting Goods fell -30.62% in the regular session, erasing $4.79B, after posting adjusted earnings of $3.53 per share on $5.59B of revenue against expectations of $3.76 and $5.65B and cutting its annual outlook, with Foot Locker comparable sales down 3.6%CNBC. The read-through took Nike to a 12-year lowFT, and staples were the second-weakest sector at -0.76%.
The bid was also narrow. Small and mid caps went nowhere — IJR -0.05%, MDY -0.07% — while the top fifty high-beta momentum names ran +2.38% against -0.14% for the rest of the universe. Beta's sixty-three-day return is still -6.58%; today buys back a fraction of that. Bank of America's Systematic Flows Monitor put trend-follower equity exposure back at pre-conflict levels as of the August 21 session, with sell triggers around a 3% decline in the S&P 500 — thin room above a rally this concentrated. Stock-specific moves took 75.3% of cross-sectional variance today against a one-year average of 66.3%, which is the arithmetic of a session where two software names lost a tenth of their value after the bell and the index still closed green: Intuit fell -3.48% in the regular session and a further -6.55% in late trading on its fiscal-2027 outlook, and nCino added -13.97% after the bell on its second-quarter reportBloomberg.
Health care was the offset, up +1.12%: Moderna gained +14.48% in the regular session and $7.38B of market value after a Barclays price-target increase and analyst upgradesBloomberg, with Merck +4.02%. Nvidia rose +2.18% in the regular session into tomorrow's fiscal second-quarter reportBloomberg, and SMH's +1.88% today still leaves semiconductors -7.96% over five sessions. Whether the duration bid survives contact with that print is tomorrow's question.
The Philadelphia Fed Non-Manufacturing Survey, released at 8:30 AM ET, showed the current-activity index falling to -10.6 from 7.4 in July against a consensus of 3.6 — a regional service-sector contraction sitting alongside manufacturing activity that reached a five-year high earlier this month. The Richmond Fed Survey of Manufacturing Activity, released at 10:00 AM ET, slipped to 4 from 5 versus a forecast of 6, with new orders down to 3 and employment turning negative at -2, so the month's shipments came from working down backlog rather than fresh demand.
Consumer Confidence, also released at 10:00 AM ET, fell to a seven-month low, with fewer households describing jobs as plentiful. Equities decoupled from it, and the labor-market component is the piece that matters most going into the Jackson Hole symposium later this week.
Variance decomposition: live intraday — 20260825 session, bracketed against its trailing-year range. Factor returns are trailing through last close. Total cross-sectional dispersion: 23%ile of the past year.
Variance mix — % of total, today vs 1d ago vs 1-yr avg
market 25%ile style 65%ile thematic 65%ile idiosyncratic 54%ile
Variance explained — today vs. factor's trailing-year range
Marker = the factor's share of today's total variance, placed in its own trailing-year range (box 25–75%ile, ticks 90%ile and max). Amber marker = unusually load-bearing today (≥90%ile of its own year). Factor name green = up today / red = down.
Correlation & dispersion — realized vs implied
Pairwise realized correlation (20d): 8.96% 5.4%ile since 2020 · 62%ile 3m
Top-500 pairwise: 10.40% 8.4%ile since 2020 · 43%ile 3m · implied (Cboe COR1M): 9.32 2.9%ile of its own history (gap +1.1pp)
Realized 20d vol (ann. pts): all stocks 49 vs VIXEQ 38 · index 13 vs VIX 15 · style factors 25 87%ile
20-day window (19 completed days + today); percentiles vs model history since 2020; '3m' tokens rank vs the trailing 63 trading days; definitions in Terms below. Implied prints (Cboe) are delayed ~15 min. as of 15:58 ET
Top 50 high-beta momentum names (eq-wt, since-2020 rank): +2.4% 81%ile · rest of market -0.1%
| Factor | Today | 1d | 5d | 20d | 60d |
|---|---|---|---|---|---|
| Style-Risk | |||||
| Beta | +1.20% z+1.2 | -1.41% | -0.81% | +3.39% | -8.06% |
| International | +0.27% z+0.9 | -0.04% | +0.99% | +0.48% | -0.19% |
| Residual Volatility | +0.09% z+0.2 | -0.44% | +0.40% | +4.00% | -2.30% |
| Style | |||||
| Value | -0.27% z-1.1 | +0.11% | -0.20% | -0.67% | -1.08% |
| Profitability | -0.20% z-1.1 | +0.17% | -0.14% | -1.49% | -1.04% |
| Leverage | +0.16% z+1.0 | -0.02% | -0.05% | -2.02% | -2.98% |
| Growth | -0.10% z-0.4 | -0.10% | -0.43% | +0.22% | +2.38% |
| Dividend Yield | +0.06% z+0.3 | -0.11% | -0.07% | +0.56% | -0.82% |
| Liquidity | +0.06% z+0.2 | -0.24% | -0.02% | +2.41% | -1.59% |
| Size | -0.06% z-0.2 | +0.25% | -0.36% | -0.06% | -1.88% |
| Style-Momentum | |||||
| Medium-Term Momentum | -0.22% z-0.8 | +0.08% | +0.99% | +1.06% | +1.63% |
| Short-Term Momentum | +0.19% z+0.6 | +0.22% | +0.66% | -3.16% | -8.13% |
| Long-Term Momentum | +0.03% z+0.0 | -0.44% | -1.97% | -0.86% | -4.60% |
| One-Day Momentum | +0.00% z+0.0 | -0.05% | +0.83% | -0.62% | +0.50% |
| Style-Positioning | |||||
| Short Interest | +0.09% z+0.6 | +0.05% | +0.43% | -0.48% | +0.90% |
| Hedge-Fund Ownership | +0.05% z+0.4 | +0.09% | +0.43% | +0.64% | +1.18% |
| Style-Flow | |||||
| Short-Sale Activity | -0.07% z-0.6 | -0.02% | +0.08% | +0.42% | +0.49% |
| Morning Activity | -0.00% z-0.0 | -0.06% | +0.76% | +2.22% | +1.19% |
| Thematic | |||||
| Gold | +0.59% z+1.8 | +0.06% | +2.90% | +4.43% | +2.84% |
| China | -0.15% z-0.4 | -0.17% | +0.09% | +0.01% | -1.77% |
| Oil | -0.13% z-0.3 | -0.51% | +0.30% | +4.08% | -0.89% |
| Treasury (Duration) | -0.07% z-0.2 | -0.11% | +0.38% | -0.19% | +0.40% |
| Semiconductors | -0.09% z-0.1 | -0.67% | -3.16% | -1.58% | -5.78% |
| Bitcoin / Crypto | -0.02% z-0.1 | +0.14% | +1.06% | +1.53% | +0.78% |
5/20/60d windows include today's session; 1d is the previous session.
Market variance share. The fraction of cross-sectional variance explained by the market factor — the attribution companion to pairwise correlation, not a substitute for it.
Factor z-score. Today's factor return divided by its daily-return standard deviation over ~1,600 trading days.
High-beta momentum cohort. US names above $2B market cap in the top quintile of both raw beta and 12-month momentum; membership frozen at each month's first business day. “Top 50” = the 50 strongest by combined rank.
Stock-specific (idiosyncratic) return. The part of a stock's move not explained by market, style, or thematic factors in our decomposition.
Data compiled by FactorPulse AI; edited and verified by Jeff Klein. For informational purposes only. Does not constitute financial advice, an investment recommendation, or an offer to buy or sell any securities. Always consult a qualified financial professional before making investment decisions.
For more on factor construction methodology, see www.factorpulse.com/glossary.