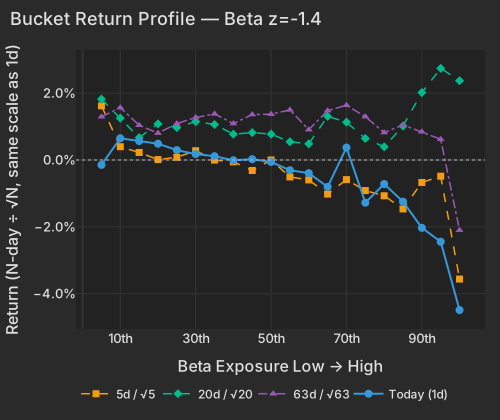
Nvidia reports fiscal Q2 on WednesdayEconomic Times, and the market de-risked the chip complex without selling the index. SPY is -0.28%, DIA +0.27%, and Consumer Staples +1.41%. Beta returned -1.37% at z=-1.42 and took 24.3% of the day's cross-sectional variance. The most market-sensitive names fell -4.49%; the least-sensitive end rose +0.37%. Semiconductors added -0.65% (z=-1.08) on top, with NVDA -2.94% and the Information Technology sector -1.83%.
| Factor | Return | Z-Score | 5d Z | 20d Z | 63d Z | Category | Direction |
|---|---|---|---|---|---|---|---|
| Beta | -1.37% | z=-1.42 | -2.16 | -0.04 | -0.72 | Style-Risk | High-beta names underperformed |
| Semiconductors | -0.65% | z=-1.08 | -3.09 | -1.35 | -1.47 | Thematic | Most chip-exposed underperformed |
| Oil | -0.50% | z=-1.05 | +0.67 | +1.57 | -0.36 | Thematic | Oil-exposed underperformed |
| Profitability | +0.18% | z=+0.97 | -0.10 | -1.52 | -0.78 | Style | More profitable outperformed |
| Liquidity | -0.25% | z=-0.90 | -0.14 | +1.41 | -0.62 | Style | Lowest-turnover names outperformed |
| Residual Volatility | -0.44% | z=-0.87 | +0.2 | +1.6 | -0.2 | Style-Risk | High-volatility names underperformed |
| Size | +0.24% | z=+0.67 | +0.09 | -0.07 | -0.73 | Style | Larger caps outperformed |
Micron is the case in point. The decomposition puts -3.82% of its move on style exposure — Beta alone -2.96% — against -1.10% for the stock's own move. The same shape runs through the rest of the high-beta group: MaxLinear -4.52%, Aehr Test Systems -5.20%, Unusual Machines -9.93%, and in the first two the stock-specific piece was actually positive. The fundamental memory story is real — DRAM and NAND contract prices are projected to rise 10–15% in Q3 against 70–75% in the prior quarterEconomic Times — and it is not what moved Micron today.
| Bucket | Ret 1D Pct | Ret 5D Norm Pct | Ret 20D Norm Pct | Ret 63D Norm Pct |
|---|---|---|---|---|
| 1 | -0.15 | 1.62 | 1.82 | 1.29 |
| 2 | 0.65 | 0.40 | 1.25 | 1.57 |
| 3 | 0.57 | 0.22 | 0.67 | 1.04 |
| 4 | 0.49 | 0.01 | 1.08 | 0.80 |
| 5 | 0.30 | 0.08 | 0.97 | 1.09 |
| 6 | 0.18 | 0.28 | 1.15 | 1.27 |
| 7 | 0.11 | -0.00 | 1.06 | 1.38 |
| 8 | -0.01 | -0.05 | 0.77 | 1.09 |
| 9 | 0.02 | -0.31 | 0.82 | 1.36 |
| 10 | -0.06 | 0.00 | 0.77 | 1.37 |
| 11 | -0.31 | -0.51 | 0.55 | 1.50 |
| 12 | -0.39 | -0.60 | 0.48 | 0.91 |
| 13 | -0.81 | -1.02 | 1.31 | 1.48 |
| 14 | 0.37 | -0.59 | 1.13 | 1.64 |
| 15 | -1.28 | -0.91 | 0.64 | 1.30 |
| 16 | -0.72 | -1.07 | 0.39 | 0.82 |
| 17 | -1.25 | -1.46 | 1.02 | 1.05 |
| 18 | -2.03 | -0.67 | 2.02 | 0.84 |
| 19 | -2.45 | -0.49 | 2.74 | 0.62 |
| 20 | -4.49 | -3.56 | 2.37 | -2.10 |
The semis leg is not new. The Semiconductors factor's completed five-day return through Friday was -4.18%, the 0.6th percentile of all five-day windows since 2020, and the most chip-exposed names have been marked down consistently at every horizon — a 20-day exposure slope of -0.94 and a 63-day slope of -0.91. SMH is -4.66% over five sessions. The beta leg is the new part: Beta's 20-day z is -0.04 on a 20-day return of -0.15%, flat. Memory shows both at once — DRAM fell -5.97% today and is still +8.42% over 20 sessions.
| ETF | Theme | Today | 1d Ago | 5d Ago | 20d Ago | 63d Ago |
|---|---|---|---|---|---|---|
| DRAM | memory chips & storage | -5.97% | +0.17% | +0.63% | +8.42% | +6.15% |
| ARKK | innovation growth | -2.66% | +3.53% | +6.30% | +19.92% | +12.52% |
| XAR | defense | -2.54% | +0.35% | -8.08% | +1.39% | +2.39% |
| SMH | semiconductors | -2.42% | -0.40% | -4.66% | -0.14% | -1.31% |
| XLK | technology | -1.78% | +0.11% | -3.53% | +4.22% | +2.64% |
| MTUM | momentum | -1.53% | +0.02% | -3.80% | -0.40% | +1.00% |
| QQQ | large cap growth | -0.96% | +0.35% | -2.41% | +4.27% | -0.15% |
| SPY | large cap | -0.28% | +0.41% | -1.37% | +3.63% | +3.10% |
| XLF | financials | +1.32% | +0.93% | -1.17% | +2.08% | +11.12% |
| XLP | consumer staples | +1.62% | +0.79% | -0.12% | +2.21% | +1.57% |
Defense sits in the same bucket and has been bleeding longer: XAR is -8.08% over five sessions, ITA -6.27%, and the defense names inside the top beta bucket fell -6.65% today. South Korea followed the chips down, EWY -2.50%.
Style factors took 30.8% of today's cross-sectional variance, against 9.1% in Friday's session and a 21.6% one-year average; the market leg took 3.2%. Over the trailing 20 sessions realized style volatility is running at 26.5 vol points, the 89.6th percentile since 2020, against index volatility of 12.6 points at the 28.4th. Implied prices the same shape: implied single-stock volatility (Cboe VIXEQ) at 38.12 versus implied index volatility (VIX) at 15.83.
The top 50 high-beta momentum names fell -4.05%, a bottom-7th-percentile day since 2020, while everything outside the screens was flat at +0.10%; the broader version of the cohort lost -2.54%. The group was down as much as -5.92% shortly after 10:00 before recovering a third of it. The more a name fit the high-beta momentum profile, the harder it fell. Who was selling does not show up in the ownership lenses: Hedge-Fund Ownership returned +0.06% (z=+0.51) and is flat on a raw basis (z=+0.17), so the names hedge funds own most were left alone. What the group does carry is a retail tilt — its habitual early-session trading runs +1.29σ above the universe.
That tilt is where the month's money has been made. Morning Activity, which ranks names by their trailing-20-day tendency to trade early and is fixed before the open, has just completed its strongest 20-day stretch since 2020: +2.37%, the 99.9th percentile of all 20-day windows, at z=+4.22 on the 20-day horizon. Today it did not extend — the factor was flat at -0.03% (z=-0.24) and the pressure arrived through Beta instead. A book that has been earning this month's returns from retail-heavy, high-beta names got paid on the exposure and hit on the risk in the same week.
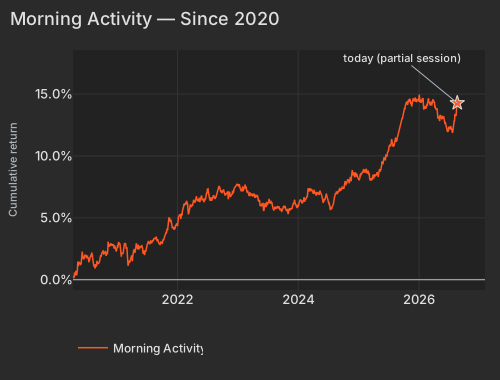
| Date | Cumret Pct |
|---|---|
| 2020-04-09 | 0.20 |
| 2020-05-04 | 0.50 |
| 2020-05-27 | 1.26 |
| 2020-06-18 | 1.83 |
| 2020-07-13 | 1.63 |
| 2020-08-04 | 1.94 |
| 2020-08-26 | 1.14 |
| 2020-09-18 | 1.50 |
| 2020-10-12 | 2.15 |
| 2020-11-03 | 2.13 |
| 2020-11-25 | 2.82 |
| 2020-12-18 | 2.70 |
| 2021-01-13 | 2.95 |
| 2021-02-05 | 2.11 |
| 2021-03-02 | 2.63 |
| 2021-03-24 | 1.68 |
| 2021-04-16 | 2.48 |
| 2021-05-10 | 2.81 |
| 2021-06-02 | 2.63 |
| 2021-06-24 | 2.30 |
| 2021-07-19 | 2.91 |
| 2021-08-10 | 3.26 |
| 2021-09-01 | 3.09 |
| 2021-09-24 | 3.10 |
| 2021-10-18 | 3.60 |
| 2021-11-09 | 4.74 |
| 2021-12-02 | 4.24 |
| 2021-12-27 | 4.45 |
| 2022-01-19 | 5.30 |
| 2022-02-10 | 6.13 |
| 2022-03-07 | 5.69 |
| 2022-03-29 | 5.88 |
| 2022-04-21 | 6.45 |
| 2022-05-13 | 6.62 |
| 2022-06-07 | 6.50 |
| 2022-06-30 | 7.02 |
| 2022-07-25 | 6.54 |
| 2022-08-16 | 6.63 |
| 2022-09-08 | 7.46 |
| 2022-09-30 | 7.09 |
| 2022-10-24 | 6.95 |
| 2022-11-15 | 7.03 |
| 2022-12-08 | 7.22 |
| 2023-01-03 | 7.61 |
| 2023-01-26 | 7.20 |
| 2023-02-17 | 7.37 |
| 2023-03-14 | 6.80 |
| 2023-04-05 | 6.82 |
| 2023-04-28 | 6.70 |
| 2023-05-22 | 6.03 |
| 2023-06-14 | 6.00 |
| 2023-07-10 | 6.34 |
| 2023-08-01 | 5.98 |
| 2023-08-23 | 5.76 |
| 2023-09-15 | 5.61 |
| 2023-10-09 | 5.94 |
| 2023-10-31 | 5.72 |
| 2023-11-22 | 5.74 |
| 2023-12-15 | 6.19 |
| 2024-01-10 | 6.22 |
| 2024-02-02 | 6.38 |
| 2024-02-27 | 6.65 |
| 2024-03-20 | 7.16 |
| 2024-04-12 | 7.03 |
| 2024-05-06 | 6.98 |
| 2024-05-29 | 6.57 |
| 2024-06-21 | 6.96 |
| 2024-07-16 | 5.68 |
| 2024-08-07 | 6.32 |
| 2024-08-29 | 7.01 |
| 2024-09-23 | 7.38 |
| 2024-10-15 | 7.93 |
| 2024-11-06 | 7.79 |
| 2024-11-29 | 8.48 |
| 2024-12-23 | 8.55 |
| 2025-01-17 | 8.64 |
| 2025-02-11 | 8.72 |
| 2025-03-06 | 8.44 |
| 2025-03-28 | 8.14 |
| 2025-04-22 | 8.51 |
| 2025-05-14 | 8.77 |
| 2025-06-06 | 9.84 |
| 2025-07-01 | 10.38 |
| 2025-07-24 | 11.06 |
| 2025-08-15 | 11.40 |
| 2025-09-09 | 12.32 |
| 2025-10-01 | 13.60 |
| 2025-10-23 | 14.42 |
| 2025-11-14 | 14.19 |
| 2025-12-09 | 14.41 |
| 2026-01-02 | 14.64 |
| 2026-01-27 | 14.54 |
| 2026-02-19 | 14.13 |
| 2026-03-13 | 14.07 |
| 2026-04-07 | 14.31 |
| 2026-04-29 | 13.11 |
| 2026-05-21 | 12.96 |
| 2026-06-15 | 12.50 |
| 2026-07-09 | 12.23 |
| 2026-07-31 | 12.46 |
| 2026-08-24 | 14.28 |
Staples and financials absorbed it, with Walmart +2.69% and Costco +1.93% leading the staples move. Profitability +0.18% (z=+0.97) and Size +0.24% (z=+0.67) point the same way. The long end helped: the 30-year Treasury yield fell 4.3 bps to 5.233% and the 10-year 3.4 bps to 4.704%CNBC, with TLT +0.61%. That followed Bessent signaling that the near-$1 trillion Treasury General Account is available to fund the department's doubled long-end buybacksCNBC. Gold held its run, GLD +0.80% on 2.6× the typical session paceEconomic Times, with GDX +0.73% and +36.69% over 20 sessions. Crude went the other way as oil executives described a bearish crude market against firmer refined productsBloomberg: the Oil factor returned -0.50% (z=-1.05) with the most oil-exposed exploration names down -2.21% and XOP -1.66%.
Single-stock moves took 60.3% of the cross-section, slightly below their 66.3% one-year average — this was a factor day. The exceptions were loud. Magna fell -7.14% in the session and Lear -5.09%, essentially all of it their own moves, after Trump signaled 50% tariffs on Canadian cars, trucks and steel and Canada answered with counter-tariffs on U.S. rail equipment and machineryNYT. Azenta dropped -12.10% after disclosing in an August 22 8-K that chief executive John Marotta had resigned. Etsy went the other way at +7.15%, almost entirely stock-specific, on the day the flagship equal-weight S&P fund's $100 billion milestone pulled buying into non-mega-cap index constituentsBloomberg. JB Hunt fell -5.56% with no driver in the day's coverage. PDD, which reported before the open, ended the regular session -1.40% as an earnings-per-share beat offset a revenue shortfallBloomberg; Fabrinet fell -3.66% into tonight's report.
The unresolved question into Wednesday is which clock the chip complex is on. The Semiconductors factor has been grinding down for five sessions and three months; the beta punishment behind today's biggest single-name losses is a week old, and the memory names it hit are still higher over 20 sessions. Nvidia's print lands Wednesday with the options market pricing roughly a 6% moveEconomic Times.
Variance decomposition: live intraday — 20260824 session, bracketed against its trailing-year range. Factor returns are trailing through last close. Total cross-sectional dispersion: 18%ile of the past year.
Variance mix — % of total, today vs 1d ago vs 1-yr avg
market 45%ile style 88%ile thematic 93.2%ile idiosyncratic 23%ile
Variance explained — today vs. factor's trailing-year range
Marker = the factor's share of today's total variance, placed in its own trailing-year range (box 25–75%ile, ticks 90%ile and max). Amber marker = unusually load-bearing today (≥90%ile of its own year). Factor name green = up today / red = down.
Correlation & dispersion — realized vs implied
Pairwise realized correlation (20d): 8.59% 4.7%ile since 2020 · 57%ile 3m
Top-500 pairwise: 10.12% 7.6%ile since 2020 · 38%ile 3m · implied (Cboe COR1M): 9.31 2.9%ile of its own history (gap +0.8pp)
Realized 20d vol (ann. pts): all stocks 50 vs VIXEQ 38 · index 13 vs VIX 16 · style factors 26 90%ile
20-day window (19 completed days + today); percentiles vs model history since 2020; '3m' tokens rank vs the trailing 63 trading days; definitions in Terms below. Implied prints (Cboe) are delayed ~15 min. as of 15:58 ET
Top 50 high-beta momentum names (eq-wt, since-2020 rank): -4.0% 7.0%ile · rest of market +0.1%
| Factor | Today | 1d | 5d | 20d | 60d |
|---|---|---|---|---|---|
| Style-Risk | |||||
| Beta | -1.37% z-1.4 | +0.33% | -4.69% | -0.15% | -8.83% |
| Residual Volatility | -0.44% z-0.9 | +0.01% | +0.27% | +3.52% | -1.44% |
| International | -0.02% z-0.1 | +0.17% | +0.80% | +0.17% | -0.49% |
| Style | |||||
| Profitability | +0.18% z+1.0 | -0.05% | -0.04% | -1.29% | -1.11% |
| Liquidity | -0.25% z-0.9 | -0.18% | -0.08% | +1.72% | -1.74% |
| Size | +0.24% z+0.7 | -0.19% | +0.07% | -0.11% | -1.68% |
| Dividend Yield | -0.11% z-0.6 | -0.13% | -0.10% | +0.12% | -0.81% |
| Growth | -0.08% z-0.3 | -0.10% | -0.41% | +0.53% | +2.75% |
| Value | +0.08% z+0.3 | -0.18% | -0.09% | -0.23% | -0.90% |
| Leverage | -0.01% z-0.0 | -0.24% | -0.42% | -2.25% | -3.29% |
| Style-Momentum | |||||
| Short-Term Momentum | +0.20% z+0.7 | +0.39% | +0.01% | -3.73% | -8.21% |
| Long-Term Momentum | -0.40% z-0.6 | -0.41% | -2.55% | -2.72% | -5.38% |
| Medium-Term Momentum | +0.06% z+0.2 | +0.50% | +1.49% | +1.76% | +2.25% |
| One-Day Momentum | -0.06% z-0.2 | -0.17% | +0.22% | +0.60% | +1.42% |
| Style-Positioning | |||||
| Hedge-Fund Ownership | +0.06% z+0.5 | -0.07% | +0.47% | +0.50% | +0.98% |
| Short Interest | +0.04% z+0.2 | -0.00% | +0.65% | -0.10% | +1.13% |
| Style-Flow | |||||
| Morning Activity | -0.03% z-0.2 | +0.17% | +0.98% | +2.37% | +1.23% |
| Short-Sale Activity | -0.02% z-0.2 | -0.05% | +0.17% | +0.61% | +0.55% |
| Thematic | |||||
| Semiconductors | -0.65% z-1.1 | -0.87% | -4.18% | -3.65% | -6.84% |
| Oil | -0.50% z-1.1 | +0.07% | +0.71% | +3.35% | -0.58% |
| China | -0.18% z-0.5 | +0.06% | +0.30% | +0.53% | -2.29% |
| Treasury (Duration) | -0.11% z-0.3 | +0.13% | +0.59% | -0.02% | +0.83% |
| Bitcoin / Crypto | +0.10% z+0.3 | +0.01% | +1.07% | +1.32% | +0.35% |
| Gold | +0.06% z+0.2 | +0.59% | +2.47% | +3.62% | +2.08% |
5/20/60d windows include today's session; 1d is the previous session.
Factor z-score. Today's factor return divided by its daily-return standard deviation over ~1,600 trading days.
High-beta momentum cohort. US names above $2B market cap in the top quintile of both raw beta and 12-month momentum; membership frozen at each month's first business day. “Top 50” = the 50 strongest by combined rank.
Stock-specific (idiosyncratic) return. The part of a stock's move not explained by market, style, or thematic factors in our decomposition.
VIXEQ / DSPX / COR1M. Cboe implied indices: single-stock volatility, dispersion, and 1-month implied correlation (top-50 S&P names). Quotes delayed ~15 minutes.
Data compiled by FactorPulse AI; edited and verified by Jeff Klein. For informational purposes only. Does not constitute financial advice, an investment recommendation, or an offer to buy or sell any securities. Always consult a qualified financial professional before making investment decisions.
For more on factor construction methodology, see www.factorpulse.com/glossary.