Treasury Secretary Scott Bessent could fund expanded government bond buybacks out of the roughly $950 billion sitting in the Treasury General Account — a strategy he has described as a Treasury Twist, aimed at long-duration paper, as CNBC reported. The curve answered where the buying would go and nowhere else: the 30-Year is 5.238% and the 20-Year 5.226%, both 3.8 basis points lower, against a 2-Year unchanged at 4.238%, as CNBC reported. TLT is +0.53%; the fund is still -1.44% over 20 sessions and -2.58% over 63, so this is one morning's answer to a supply problem that has been running for months.
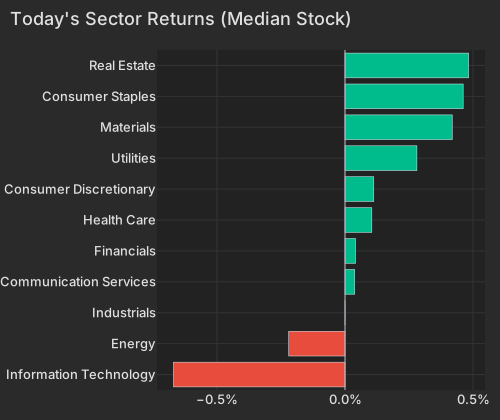
The equity cross-section is not treating cheaper long money as a green light for risk. Real estate leads the sector medians at +0.56%, materials +0.52% and consumer staples +0.47%, while the median information technology name is -0.83%. Beta is -0.59% at z=-0.6, and the top 50 high-beta momentum names are -2.15% against +0.15% for everything outside the screen. Nucor is +3.93% and Steel Dynamics +3.71% behind the steelmaker's second-quarter beat.
| Factor | Return | Z-Score | 5d Z | 20d Z | 63d Z | Category | Direction |
|---|---|---|---|---|---|---|---|
| Liquidity | -0.31% | z=-1.1 | -0.2 | +1.4 | -0.7 | Style | Lowest-turnover names outperformed the most-liquid |
| Semiconductors | -0.44% | z=-0.7 | -2.9 | -1.3 | -1.4 | Thematic | Chip-exposed names lagged |
| Short-Sale Activity | -0.07% | z=-0.6 | +0.5 | +1.2 | +0.7 | Style-Flow | Barely short-sold names beat the heavily short-sold T+1 |
| Beta | -0.59% | z=-0.6 | -1.8 | +0.2 | -0.6 | Style-Risk | Higher-beta names underperformed |
| Gold | +0.10% | z=+0.3 | +3.5 | +2.5 | +1.0 | Thematic | Gold-exposed names outperformed |
| Short Interest | +0.03% | z=+0.2 | +1.7 | -0.1 | +1.1 | Style-Positioning | Flat |
| Medium-Term Momentum | -0.02% | z=-0.1 | +2.2 | +1.3 | +1.0 | Style-Momentum | Flat |
| Sector | Median Ret Pct |
|---|---|
| Information Technology | -0.67 |
| Energy | -0.22 |
| Industrials | 0.00 |
| Communication Services | 0.04 |
| Financials | 0.04 |
| Health Care | 0.10 |
| Consumer Discretionary | 0.11 |
| Utilities | 0.28 |
| Materials | 0.42 |
| Consumer Staples | 0.46 |
| Real Estate | 0.48 |
Cheaper long-end funding should be the friend of long-duration equities. It is not buying them anything this morning. The Semiconductors factor is -0.44% at z=-0.7, extending a completed five-day run of -3.96% and a 20-day run of -3.43%. Memory chips are where it bites hardest: the DRAM ETF is -3.40% after +8.42% over the trailing 20 sessions, with Micron -3.02% and Sandisk -5.31%, erasing $12.4B of market value. Sandisk's fall is almost none of its own doing — the style block accounts for -4.06% of it and the stock's own move for just -0.62%, so this is the beta and turnover axis, not a memory-pricing story. Nvidia reports Wednesday and PCE inflation, as bea.gov reported, follows later in the week, as Bloomberg reported; chip exposure is being lightened into both.
| ETF | Theme | Today | 1d Ago | 5d Ago | 20d Ago | 63d Ago |
|---|---|---|---|---|---|---|
| GLD | gold | +0.87% | +1.95% | +5.45% | +13.84% | +1.53% |
| GDX | gold miners | +0.70% | +2.98% | +14.29% | +36.69% | +19.58% |
| TLT | long-term bonds | +0.53% | -0.35% | +0.01% | -1.44% | -2.58% |
| XLP | consumer staples | +0.49% | +0.79% | -0.12% | +2.21% | +1.57% |
| QQQ | large cap growth | -0.61% | +0.35% | -2.41% | +4.27% | -0.15% |
| AIPO | AI power infrastructure | -1.11% | -0.21% | -6.53% | -1.43% | -9.91% |
| SMH | semiconductors | -1.33% | -0.40% | -4.66% | -0.14% | -1.31% |
| DRAM | memory chips & storage | -3.40% | +0.17% | +0.63% | +8.42% | +6.15% |
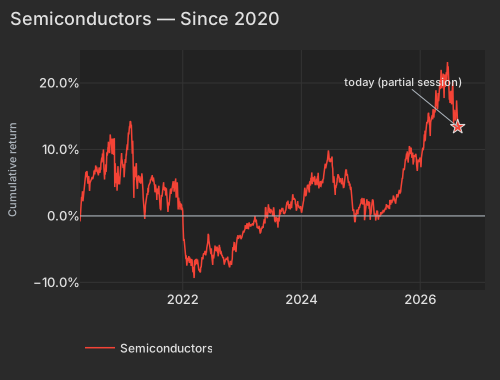
| Date | Cumret Pct |
|---|---|
| 2020-04-09 | -0.83 |
| 2020-05-04 | 3.13 |
| 2020-05-27 | 4.90 |
| 2020-06-18 | 5.53 |
| 2020-07-13 | 6.99 |
| 2020-08-04 | 6.76 |
| 2020-08-26 | 9.40 |
| 2020-09-18 | 7.28 |
| 2020-10-12 | 10.99 |
| 2020-11-03 | 9.19 |
| 2020-11-25 | 4.78 |
| 2020-12-18 | 7.85 |
| 2021-01-13 | 8.54 |
| 2021-02-05 | 12.53 |
| 2021-03-02 | 10.13 |
| 2021-03-24 | 5.55 |
| 2021-04-16 | 5.25 |
| 2021-05-10 | 0.42 |
| 2021-06-02 | 4.23 |
| 2021-06-24 | 5.67 |
| 2021-07-19 | 4.73 |
| 2021-08-10 | 3.54 |
| 2021-09-01 | 4.13 |
| 2021-09-24 | 3.50 |
| 2021-10-18 | 3.42 |
| 2021-11-09 | 4.91 |
| 2021-12-02 | 3.13 |
| 2021-12-27 | 1.64 |
| 2022-01-19 | -6.07 |
| 2022-02-10 | -6.46 |
| 2022-03-07 | -8.48 |
| 2022-03-29 | -6.44 |
| 2022-04-21 | -8.41 |
| 2022-05-13 | -5.70 |
| 2022-06-07 | -3.55 |
| 2022-06-30 | -6.06 |
| 2022-07-25 | -4.73 |
| 2022-08-16 | -4.36 |
| 2022-09-08 | -6.34 |
| 2022-09-30 | -6.63 |
| 2022-10-24 | -7.25 |
| 2022-11-15 | -4.02 |
| 2022-12-08 | -2.88 |
| 2023-01-03 | -3.08 |
| 2023-01-26 | -1.54 |
| 2023-02-17 | -1.50 |
| 2023-03-14 | -1.15 |
| 2023-04-05 | -1.70 |
| 2023-04-28 | -2.44 |
| 2023-05-22 | -0.66 |
| 2023-06-14 | 1.76 |
| 2023-07-10 | 0.37 |
| 2023-08-01 | -0.13 |
| 2023-08-23 | 0.99 |
| 2023-09-15 | 0.32 |
| 2023-10-09 | 1.96 |
| 2023-10-31 | 1.61 |
| 2023-11-22 | 2.65 |
| 2023-12-15 | 1.61 |
| 2024-01-10 | 1.25 |
| 2024-02-02 | 3.50 |
| 2024-02-27 | 4.68 |
| 2024-03-20 | 5.17 |
| 2024-04-12 | 5.89 |
| 2024-05-06 | 4.83 |
| 2024-05-29 | 7.85 |
| 2024-06-21 | 8.76 |
| 2024-07-16 | 6.14 |
| 2024-08-07 | 4.66 |
| 2024-08-29 | 5.26 |
| 2024-09-23 | 4.51 |
| 2024-10-15 | 5.04 |
| 2024-11-06 | 2.73 |
| 2024-11-29 | -0.82 |
| 2024-12-23 | 1.36 |
| 2025-01-17 | 1.82 |
| 2025-02-11 | 2.18 |
| 2025-03-06 | 0.23 |
| 2025-03-28 | 0.37 |
| 2025-04-22 | -0.58 |
| 2025-05-14 | 0.62 |
| 2025-06-06 | 0.94 |
| 2025-07-01 | 2.40 |
| 2025-07-24 | 2.80 |
| 2025-08-15 | 2.98 |
| 2025-09-09 | 4.57 |
| 2025-10-01 | 7.98 |
| 2025-10-23 | 8.76 |
| 2025-11-14 | 8.99 |
| 2025-12-09 | 9.25 |
| 2026-01-02 | 8.79 |
| 2026-01-27 | 11.45 |
| 2026-02-19 | 14.29 |
| 2026-03-13 | 14.50 |
| 2026-04-07 | 15.95 |
| 2026-04-29 | 18.20 |
| 2026-05-21 | 20.14 |
| 2026-06-15 | 21.62 |
| 2026-07-09 | 18.61 |
| 2026-07-31 | 15.96 |
| 2026-08-24 | 13.41 |
Liquidity prints the largest z-score on the board at z=-1.1 (-0.31%): the lowest-turnover names beat the most-liquid, most heavily optioned end of the market. Read it with Beta rather than next to it — across the universe the two exposure vectors correlate 0.58, so these are not two signals but one position being reduced. The names in that highest-turnover bucket identify it: Oklo, TeraWulf, Rigetti, UiPath and Applied Digital, down roughly -0.73% as a group, the speculative end of AI power and data centres. Beta is carrying 21% of session-so-far cross-sectional variance, which makes it the axis the market is sorting on before the bell.
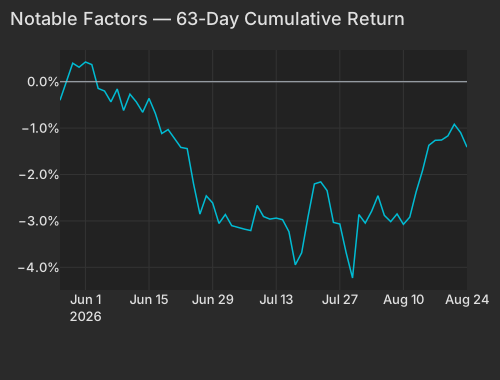
| Factor | Display Name | Cumret Pct |
|---|---|---|
| liquidity | Liquidity | -1.41 |
Gold is the other beneficiary and it is not a dollar trade: the Gold factor added +2.51% over the past five sessions and +3.66% over 20, with the dollar index firmer at 98.98, up +0.19%, as CNBC reported. Spot bullion advanced 0.5% to $4,627.42 an ounce on the fourth day of its run, as the Economic Times reported. Metals equities getting paid while the currency strengthens is the awkward fact for anyone treating this as a straight easing trade.
PDD is +3.87% and adding $4.8B of market value after a bottom-line beat offset a revenue shortfall, with management warning on the end of duty-free treatment for small parcels; China proxies are not following, FXI -1.39% and KWEB -1.24%. Wabtec is -3.15%, effectively all of it the stock's own move, after Bloomberg's Daybreak Europe reported Canada hitting the US with counter-tariffs; Ottawa has paused negotiations with Washington until after the midterms. United Microelectronics is +5.34% on a stock-specific move with no driver yet in the coverage — a foundry ripping while the Semiconductors factor bleeds is worth a look before the open.
The long end has one morning's answer to a supply problem that has been building for months, and the equities most exposed to that problem are being sold anyway. Nvidia on Wednesday decides which of those two facts survives the week; Fed Chair Kevin Warsh speaks Friday, as Bloomberg reported.
Variance decomposition: live intraday — 20260824 session, bracketed against its trailing-year range. Factor returns are trailing through last close. Total cross-sectional dispersion: 0.8%ile of the past year.
Variance mix — % of total, today vs 1d ago vs 1-yr avg
market 26%ile style 90%ile thematic 73%ile idiosyncratic 26%ile
Variance explained — today vs. factor's trailing-year range
Marker = the factor's share of today's total variance, placed in its own trailing-year range (box 25–75%ile, ticks 90%ile and max). Amber marker = unusually load-bearing today (≥90%ile of its own year). Factor name green = up today / red = down.
Correlation & dispersion — realized vs implied
Pairwise realized correlation (20d): 9.67% 6.5%ile since 2020 · 64%ile 3m
Top-500 pairwise: 10.87% 9.5%ile since 2020 · 62%ile 3m · implied (Cboe COR1M): 8.34 1.9%ile of its own history (gap +2.5pp)
Realized 20d vol (ann. pts): all stocks 50 vs VIXEQ 38 · index 13 vs VIX 16 · style factors 26 89%ile
20-day window (19 completed days + today); percentiles vs model history since 2020; '3m' tokens rank vs the trailing 63 trading days; definitions in Terms below. Implied prints (Cboe) are delayed ~15 min. as of 07:58 ET
Top 50 high-beta momentum names (eq-wt, since-2020 rank): -2.1% 18%ile · rest of market +0.1%
| Factor | Today | 1d | 5d | 20d | 60d |
|---|---|---|---|---|---|
| Style-Risk | |||||
| Beta | -0.59% z-0.6 | +0.33% | -3.90% | +0.63% | -8.05% |
| Residual Volatility | -0.21% z-0.4 | +0.01% | +0.50% | +3.75% | -1.20% |
| International | -0.09% z-0.3 | +0.17% | +0.73% | +0.10% | -0.56% |
| Style | |||||
| Liquidity | -0.31% z-1.1 | -0.18% | -0.15% | +1.66% | -1.81% |
| Dividend Yield | -0.07% z-0.4 | -0.13% | -0.05% | +0.16% | -0.77% |
| Growth | -0.07% z-0.3 | -0.10% | -0.40% | +0.54% | +2.76% |
| Profitability | -0.04% z-0.2 | -0.05% | -0.27% | -1.52% | -1.34% |
| Size | -0.08% z-0.2 | -0.19% | -0.25% | -0.43% | -2.00% |
| Value | +0.01% z+0.1 | -0.18% | -0.16% | -0.29% | -0.96% |
| Leverage | +0.00% z+0.0 | -0.24% | -0.41% | -2.24% | -3.28% |
| Style-Momentum | |||||
| Long-Term Momentum | -0.29% z-0.4 | -0.41% | -2.44% | -2.61% | -5.26% |
| One-Day Momentum | +0.08% z+0.3 | -0.17% | +0.35% | +0.73% | +1.55% |
| Short-Term Momentum | +0.07% z+0.2 | +0.39% | -0.12% | -3.86% | -8.34% |
| Medium-Term Momentum | -0.02% z-0.1 | +0.50% | +1.41% | +1.68% | +2.17% |
| Style-Positioning | |||||
| Short Interest | +0.03% z+0.2 | -0.00% | +0.64% | -0.11% | +1.12% |
| Hedge-Fund Ownership | +0.02% z+0.1 | -0.07% | +0.43% | +0.46% | +0.94% |
| Style-Flow | |||||
| Short-Sale Activity | -0.07% z-0.6 | -0.05% | +0.13% | +0.56% | +0.50% |
| Morning Activity | +0.02% z+0.1 | +0.17% | +1.02% | +2.42% | +1.28% |
| Thematic | |||||
| Semiconductors | -0.44% z-0.7 | -0.87% | -3.96% | -3.43% | -6.62% |
| Gold | +0.10% z+0.3 | +0.59% | +2.51% | +3.66% | +2.12% |
| Treasury (Duration) | +0.10% z+0.3 | +0.13% | +0.80% | +0.19% | +1.04% |
| Bitcoin / Crypto | -0.08% z-0.3 | +0.01% | +0.89% | +1.14% | +0.17% |
| Oil | -0.13% z-0.3 | +0.07% | +1.08% | +3.72% | -0.22% |
| China | -0.07% z-0.2 | +0.06% | +0.41% | +0.64% | -2.18% |
5/20/60d windows include today's session; 1d is the previous session.
Factor z-score. Today's factor return divided by its daily-return standard deviation over ~1,600 trading days.
High-beta momentum cohort. US names above $2B market cap in the top quintile of both raw beta and 12-month momentum; membership frozen at each month's first business day. “Top 50” = the 50 strongest by combined rank.
Stock-specific (idiosyncratic) return. The part of a stock's move not explained by market, style, or thematic factors in our decomposition.
Data compiled by FactorPulse AI; edited and verified by Jeff Klein. For informational purposes only. Does not constitute financial advice, an investment recommendation, or an offer to buy or sell any securities. Always consult a qualified financial professional before making investment decisions.
For more on factor construction methodology, see www.factorpulse.com/glossary.