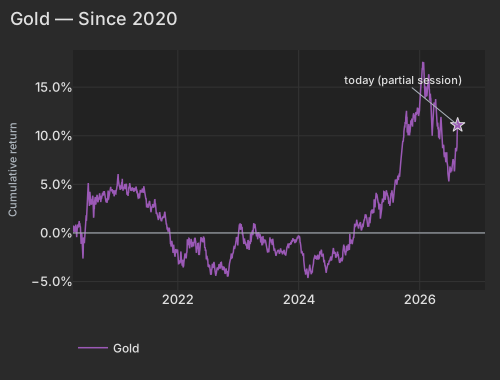
Scott Bessent's expanded long-dated buyback did not cap the long end — the 30-year closed at 5.273%, up 3.6 basis points on the day — and the cross-section spent the session paying the two trades it has paid all month: long gold exposure, short levered balance sheets. The Gold factor rose +0.60% at z=+1.85 on top of the strongest five-day run of any window since 2020, while Leverage sits at a 20-day z=-3.4. Three-quarters of today's cross-sectional variance was still stock-specific, and the largest single moves belonged to Alibaba and Robinhood.
Treasury Secretary Scott Bessent announced an expansion of long-dated bond buybacks intended to steady multi-year highs in long-term yieldsBloomberg. The curve went the other way: the 30-year finished at 5.273% and the 10-year at 4.734%, both 3.6 basis points higher, with the 2-year up 4.7CNBC. The dollar index slipped to 98.83, six points below its June highCNBC, spot gold pushed to a three-month highEconomic Times, and the equity market repriced the same axis it has been repriced since the start of August.
| Factor | Return | Z-Score | 5d Z | 20d Z | 63d Z | Category | Direction |
|---|---|---|---|---|---|---|---|
| Gold | +0.60% | +1.9 | +3.7 | +2.4 | +0.7 | Thematic | Continuation |
| Medium-Term Momentum | +0.46% | +1.6 | +2.2 | +1.8 | +1.2 | Style-Momentum | 1-month trend continuing |
| Morning Activity | +0.20% | +1.6 | +4.0 | +4.3 | +1.4 | Style-Flow | Continuation |
| Semiconductors | -0.85% | -1.4 | -1.7 | -1.8 | -1.3 | Thematic | Continuation |
| Leverage | -0.23% | -1.3 | -1.4 | -3.4 | -2.2 | Style | Continuation |
| Short-Term Momentum | +0.37% | +1.2 | -0.6 | -3.5 | -3.2 | Style-Momentum | Last week's movers continued |
| Hedge-Fund Ownership | -0.07% | -0.7 | +2.1 | +0.9 | +0.7 | Style-Positioning | Mild drag |
Gold is where the conviction is. The factor's five-day cumulative return through last night's close, +2.66%, is the largest of all 1,596 overlapping five-day windows since 2020, and the gold axis carried 99.4th-percentile variance over that stretch — a thematic factor that normally sits in the background is now one of the load-bearing pieces of the cross-section. The top gold-exposure names gained +2.84% today; Harmony Gold rose +6.93% with almost all of it factor-driven, and GDX closed +3.04% for a 20-day gain of +33.10%.
| Date | Cumret Pct |
|---|---|
| 2020-04-08 | 0.04 |
| 2020-05-01 | 0.12 |
| 2020-05-26 | -0.45 |
| 2020-06-17 | -0.47 |
| 2020-07-10 | 4.38 |
| 2020-08-03 | 3.51 |
| 2020-08-25 | 2.94 |
| 2020-09-17 | 3.82 |
| 2020-10-09 | 4.29 |
| 2020-11-02 | 3.31 |
| 2020-11-24 | 4.35 |
| 2020-12-17 | 4.40 |
| 2021-01-12 | 4.94 |
| 2021-02-04 | 4.34 |
| 2021-03-01 | 3.95 |
| 2021-03-23 | 4.57 |
| 2021-04-15 | 4.55 |
| 2021-05-07 | 3.59 |
| 2021-06-01 | 4.44 |
| 2021-06-23 | 3.46 |
| 2021-07-16 | 2.93 |
| 2021-08-09 | 2.60 |
| 2021-08-31 | 1.88 |
| 2021-09-23 | 1.23 |
| 2021-10-15 | 2.18 |
| 2021-11-08 | 0.35 |
| 2021-12-01 | -1.52 |
| 2021-12-23 | -1.82 |
| 2022-01-18 | -2.93 |
| 2022-02-09 | -2.83 |
| 2022-03-04 | -1.17 |
| 2022-03-28 | -1.47 |
| 2022-04-20 | -0.80 |
| 2022-05-12 | -2.28 |
| 2022-06-06 | -0.55 |
| 2022-06-29 | -2.55 |
| 2022-07-22 | -4.29 |
| 2022-08-15 | -3.72 |
| 2022-09-07 | -3.27 |
| 2022-09-29 | -3.82 |
| 2022-10-21 | -3.65 |
| 2022-11-14 | -2.84 |
| 2022-12-07 | -1.48 |
| 2022-12-30 | -1.29 |
| 2023-01-25 | 0.61 |
| 2023-02-16 | -0.98 |
| 2023-03-13 | -0.85 |
| 2023-04-04 | 0.54 |
| 2023-04-27 | -0.20 |
| 2023-05-19 | -0.81 |
| 2023-06-13 | -0.76 |
| 2023-07-07 | -1.68 |
| 2023-07-31 | -0.60 |
| 2023-08-22 | -2.16 |
| 2023-09-14 | -1.84 |
| 2023-10-06 | -1.74 |
| 2023-10-30 | -1.22 |
| 2023-11-21 | -0.83 |
| 2023-12-14 | -0.83 |
| 2024-01-09 | -0.39 |
| 2024-02-01 | -2.09 |
| 2024-02-26 | -4.43 |
| 2024-03-19 | -4.20 |
| 2024-04-11 | -2.36 |
| 2024-05-03 | -2.63 |
| 2024-05-28 | -2.22 |
| 2024-06-20 | -3.76 |
| 2024-07-15 | -2.63 |
| 2024-08-06 | -1.92 |
| 2024-08-28 | -2.28 |
| 2024-09-20 | -2.77 |
| 2024-10-14 | -2.31 |
| 2024-11-05 | -1.75 |
| 2024-11-27 | -0.46 |
| 2024-12-20 | 1.15 |
| 2025-01-16 | 0.25 |
| 2025-02-10 | 1.93 |
| 2025-03-05 | 1.61 |
| 2025-03-27 | 2.18 |
| 2025-04-21 | 3.97 |
| 2025-05-13 | 1.62 |
| 2025-06-05 | 4.21 |
| 2025-06-30 | 3.71 |
| 2025-07-23 | 3.82 |
| 2025-08-14 | 5.23 |
| 2025-09-08 | 6.56 |
| 2025-09-30 | 9.84 |
| 2025-10-22 | 10.33 |
| 2025-11-13 | 11.14 |
| 2025-12-08 | 11.42 |
| 2025-12-31 | 12.14 |
| 2026-01-26 | 17.28 |
| 2026-02-18 | 14.32 |
| 2026-03-12 | 13.83 |
| 2026-04-06 | 13.23 |
| 2026-04-28 | 10.68 |
| 2026-05-20 | 9.54 |
| 2026-06-12 | 7.40 |
| 2026-07-08 | 6.50 |
| 2026-07-30 | 7.38 |
| 2026-08-21 | 11.10 |
The mirror image of the gold bid is a month-long tax on debt-heavy equity. Leverage fell -0.23% today at z=-1.3, but the structural print is the 20-day z=-3.4 and the 63-day z=-2.2: the most levered names have lost -2.60% against the least levered over 20 sessions and -2.93% over 63. Utilities are where it bites hardest — XLU fell -2.14%, Sempra closed -5.18% and American Electric Power -3.71% as 30-year yields sat at 19-year highs and Texas moved to pause new data-center grid approvalsMorningstar. TLT, down -1.87% over 63 sessions, says the same thing from the bond side.
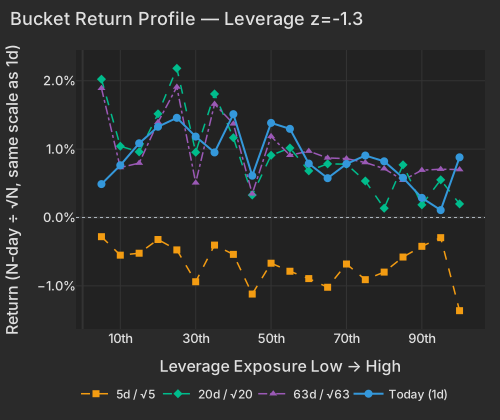
| Bucket | Ret 1D Pct | Ret 5D Norm Pct | Ret 20D Norm Pct | Ret 63D Norm Pct |
|---|---|---|---|---|
| 1 | 0.49 | -0.28 | 2.02 | 1.89 |
| 2 | 0.76 | -0.55 | 1.04 | 0.73 |
| 3 | 1.09 | -0.52 | 0.96 | 0.80 |
| 4 | 1.33 | -0.32 | 1.52 | 1.39 |
| 5 | 1.46 | -0.47 | 2.18 | 1.91 |
| 6 | 1.18 | -0.94 | 0.95 | 0.51 |
| 7 | 0.95 | -0.40 | 1.81 | 1.66 |
| 8 | 1.51 | -0.54 | 1.17 | 1.37 |
| 9 | 0.61 | -1.12 | 0.33 | 0.35 |
| 10 | 1.38 | -0.67 | 0.91 | 1.19 |
| 11 | 1.30 | -0.79 | 1.02 | 0.91 |
| 12 | 0.79 | -0.89 | 0.68 | 0.97 |
| 13 | 0.57 | -1.02 | 0.78 | 0.87 |
| 14 | 0.78 | -0.68 | 0.78 | 0.86 |
| 15 | 0.91 | -0.91 | 0.53 | 0.80 |
| 16 | 0.82 | -0.80 | 0.14 | 0.71 |
| 17 | 0.58 | -0.58 | 0.77 | 0.54 |
| 18 | 0.29 | -0.42 | 0.19 | 0.69 |
| 19 | 0.11 | -0.30 | 0.55 | 0.71 |
| 20 | 0.88 | -1.36 | 0.20 | 0.70 |
| ETF | Theme | Today | 1d Ago | 5d Ago | 20d Ago | 63d Ago |
|---|---|---|---|---|---|---|
| BITO | crypto | +6.63% | +6.05% | +14.60% | +11.86% | -7.45% |
| ARKK | innovation growth | +3.48% | -0.05% | +0.82% | +12.79% | +9.80% |
| GDX | gold miners | +2.87% | +2.59% | +13.12% | +33.10% | +15.62% |
| XLB | materials | +2.14% | -0.19% | +0.21% | +4.24% | +5.43% |
| GLD | gold | +1.93% | +0.34% | +4.09% | +11.77% | -0.51% |
| SPY | large cap | +0.38% | -0.84% | -1.96% | +3.31% | +2.88% |
| SMH | semiconductors | -0.46% | +0.31% | -4.49% | -3.02% | -0.36% |
| TLT | long-term bonds | -0.37% | -0.82% | -0.30% | -1.00% | -1.87% |
| XLU | utilities | -2.14% | -0.57% | -0.61% | -5.24% | -1.66% |
| WGMI | crypto miners | -2.55% | +3.90% | -0.82% | -19.48% | -18.14% |
The least-discussed number in the file is Morning Activity. Its exposure is a standing tilt fixed before the open — which names habitually run volume-heavy mornings over the prior 20 sessions, a group that skews retail and international — and that group outperformed again today, +0.20% at z=+1.6. Its 20-day cumulative +2.44% is the highest of all 1,581 twenty-day windows since 2020 at z=+4.3. Today's marquee movers sit squarely in that end of the market: Robinhood closed +13.76% with Bitcoin up 9% past $79,000Bloomberg, TMC gained +21.03% after NOAA advanced its consolidated commercial deep-sea mining application in the Federal RegisterNYT, Tesla closed +5.10%, and Virtu closed +11.17%.
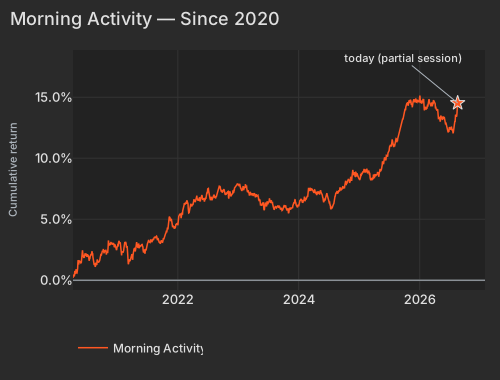
| Date | Cumret Pct |
|---|---|
| 2020-04-08 | 0.18 |
| 2020-05-01 | 0.59 |
| 2020-05-26 | 1.41 |
| 2020-06-17 | 2.10 |
| 2020-07-10 | 1.98 |
| 2020-08-03 | 2.26 |
| 2020-08-25 | 1.34 |
| 2020-09-17 | 1.72 |
| 2020-10-09 | 2.51 |
| 2020-11-02 | 2.42 |
| 2020-11-24 | 3.14 |
| 2020-12-17 | 2.94 |
| 2021-01-12 | 3.23 |
| 2021-02-04 | 2.25 |
| 2021-03-01 | 2.73 |
| 2021-03-23 | 1.72 |
| 2021-04-15 | 2.58 |
| 2021-05-07 | 2.72 |
| 2021-06-01 | 2.93 |
| 2021-06-23 | 2.48 |
| 2021-07-16 | 3.11 |
| 2021-08-09 | 3.45 |
| 2021-08-31 | 3.37 |
| 2021-09-23 | 3.19 |
| 2021-10-15 | 3.68 |
| 2021-11-08 | 4.84 |
| 2021-12-01 | 4.41 |
| 2021-12-23 | 4.54 |
| 2022-01-18 | 5.35 |
| 2022-02-09 | 6.16 |
| 2022-03-04 | 6.26 |
| 2022-03-28 | 6.12 |
| 2022-04-20 | 6.70 |
| 2022-05-12 | 6.71 |
| 2022-06-06 | 6.64 |
| 2022-06-29 | 7.16 |
| 2022-07-22 | 6.84 |
| 2022-08-15 | 6.81 |
| 2022-09-07 | 7.52 |
| 2022-09-29 | 7.22 |
| 2022-10-21 | 7.05 |
| 2022-11-14 | 7.10 |
| 2022-12-07 | 7.22 |
| 2022-12-30 | 7.82 |
| 2023-01-25 | 7.35 |
| 2023-02-16 | 7.77 |
| 2023-03-13 | 7.03 |
| 2023-04-04 | 6.97 |
| 2023-04-27 | 6.86 |
| 2023-05-19 | 6.33 |
| 2023-06-13 | 6.08 |
| 2023-07-07 | 6.40 |
| 2023-07-31 | 6.19 |
| 2023-08-22 | 5.92 |
| 2023-09-14 | 5.79 |
| 2023-10-06 | 6.12 |
| 2023-10-30 | 5.80 |
| 2023-11-21 | 5.96 |
| 2023-12-14 | 6.41 |
| 2024-01-09 | 6.41 |
| 2024-02-01 | 6.50 |
| 2024-02-26 | 6.91 |
| 2024-03-19 | 7.36 |
| 2024-04-11 | 7.23 |
| 2024-05-03 | 7.17 |
| 2024-05-28 | 6.77 |
| 2024-06-20 | 7.02 |
| 2024-07-15 | 5.90 |
| 2024-08-06 | 6.50 |
| 2024-08-28 | 7.22 |
| 2024-09-20 | 7.46 |
| 2024-10-14 | 8.15 |
| 2024-11-05 | 8.24 |
| 2024-11-27 | 8.89 |
| 2024-12-20 | 8.77 |
| 2025-01-16 | 8.74 |
| 2025-02-10 | 8.96 |
| 2025-03-05 | 8.83 |
| 2025-03-27 | 8.31 |
| 2025-04-21 | 8.62 |
| 2025-05-13 | 9.04 |
| 2025-06-05 | 10.06 |
| 2025-06-30 | 10.50 |
| 2025-07-23 | 11.37 |
| 2025-08-14 | 11.61 |
| 2025-09-08 | 12.45 |
| 2025-09-30 | 13.45 |
| 2025-10-22 | 14.42 |
| 2025-11-13 | 14.45 |
| 2025-12-08 | 14.71 |
| 2025-12-31 | 14.58 |
| 2026-01-26 | 14.86 |
| 2026-02-18 | 14.40 |
| 2026-03-12 | 14.34 |
| 2026-04-06 | 14.59 |
| 2026-04-28 | 13.25 |
| 2026-05-20 | 13.21 |
| 2026-06-12 | 12.86 |
| 2026-07-08 | 12.47 |
| 2026-07-30 | 12.76 |
| 2026-08-21 | 14.53 |
The institutional end has not had the same month. Goldman Sachs' Hedge Fund Trend Monitor, covering nearly 1,000 funds, put US equity hedge funds up 10.0% year to date through August 19 and gross leverage still elevated versus long-run averages after July's reduction, with systematic long-short funds down 1.4% on Wednesday, August 19 — their sharpest daily decline in over two years. Our direct lens is milder today: Hedge-Fund Ownership fell -0.07% residualized and -0.13% on a raw basis, so the more hedge-fund-held names lagged slightly rather than being hit.
What argues against reading today as a factor day at all is the variance mix. Idiosyncratic moves took 75.4% of cross-sectional variance against a one-year average of 66.2%, and the whole style block took 10.2%. Alibaba closed -8.47%, erasing $27.1B of market value, after June-quarter capital expenditure rose 75% year over year to RMB 67.7 billion and free cash flow flipped to an outflow; Morningstar cut its fair value estimate 11% on the cash-flow miss. Southern Copper closed +8.67% with no story attached to it in today's coverage — the market marked it up on its own. Those were the day's biggest moves, and neither belongs to gold or to leverage.
That is the shape of this whole tape. Over the trailing 20 sessions the index leg has explained just 6.4% of cross-sectional variance — 5.5th percentile since 2020, a level that has been pinned there for weeks rather than set today — while realized style volatility runs at 26.9 vol points, 90.6th percentile, and the VIX marked 15.14. A quiet index sitting on top of a churning cross-section is exactly the configuration in which a z=-3.4 leverage drag and a record gold run can both exist without moving SPY more than +0.38%.
Among reporters, Ross Stores closed +4.52% after second-quarter EPS of $2.66 against $1.94 consensus and 10% comparable sales growthMarketWatch. OSI Systems closed -5.06% on a fourth-quarter revenue miss and conservative fiscal-2027 guidance despite record annual earnings and backlogthe SEC. Workday closed +1.37% and Intuit +1.44% — muted reactions in a week whose next scheduled catalyst is Nvidia.
The New York Fed Staff Nowcast, released at 12:45 PM ET, trimmed its Q3 2026 GDP bea.gov estimate to 2.0% from 2.1% the prior week, with negative retail sales census.gov surprises outweighing favorable CPI bls.gov contributions and a 50% probability interval of 0.9% to 3.1%. The gap with the Atlanta Fed's GDPNow, still at 4.0% for the same quarter, is now wide enough that the two models are telling different stories about the same economy.
Variance decomposition: live intraday — 20260821 session, bracketed against its trailing-year range. Factor returns are trailing through last close. Total cross-sectional dispersion: 22%ile of the past year.
Variance mix — % of total, today vs 1d ago vs 1-yr avg
market 77%ile style 24%ile thematic 63%ile idiosyncratic 54%ile
Variance explained — today vs. factor's trailing-year range
Marker = the factor's share of today's total variance, placed in its own trailing-year range (box 25–75%ile, ticks 90%ile and max). Amber marker = unusually load-bearing today (≥90%ile of its own year). Factor name green = up today / red = down.
Correlation & dispersion — realized vs implied
Pairwise realized correlation (20d): 8.62% 4.8%ile since 2020 · 57%ile 3m
Top-500 pairwise: 9.84% 6.8%ile since 2020 · 33%ile 3m · implied (Cboe COR1M): 8.31 1.9%ile of its own history (gap +1.5pp)
Realized 20d vol (ann. pts): all stocks 50 vs VIXEQ 38 · index 13 vs VIX 15 · style factors 27 90.6%ile
20-day window (19 completed days + today); percentiles vs model history since 2020; '3m' tokens rank vs the trailing 63 trading days; definitions in Terms below. Implied prints (Cboe) are delayed ~15 min. as of 15:58 ET
Top 50 high-beta momentum names (eq-wt, since-2020 rank): -0.7% 35%ile · rest of market +0.7%
| Factor | Today | 1d | 5d | 20d | 60d |
|---|---|---|---|---|---|
| Style-Risk | |||||
| International | +0.17% z+0.6 | +0.39% | +1.08% | +0.27% | -0.72% |
| Beta | +0.34% z+0.3 | -0.13% | -2.46% | +1.09% | -6.76% |
| Residual Volatility | -0.01% z-0.0 | +0.20% | +0.57% | +4.26% | -0.05% |
| Style | |||||
| Leverage | -0.23% z-1.3 | +0.12% | -0.55% | -2.60% | -3.32% |
| Value | -0.18% z-0.8 | +0.17% | -0.22% | -0.31% | -1.23% |
| Liquidity | -0.20% z-0.7 | +0.25% | +0.25% | +1.91% | -1.13% |
| Dividend Yield | -0.11% z-0.6 | +0.24% | +0.22% | -0.15% | -0.78% |
| Size | -0.20% z-0.6 | +0.10% | -0.12% | -0.82% | -2.01% |
| Growth | -0.12% z-0.5 | +0.02% | -0.33% | +0.67% | +3.01% |
| Profitability | -0.07% z-0.4 | +0.19% | -0.11% | -1.46% | -1.73% |
| Style-Momentum | |||||
| Medium-Term Momentum | +0.46% z+1.6 | -0.10% | +1.38% | +2.38% | +2.35% |
| Short-Term Momentum | +0.37% z+1.2 | +0.19% | -0.42% | -4.85% | -8.02% |
| One-Day Momentum | -0.20% z-0.7 | +0.57% | +0.29% | +1.33% | +1.63% |
| Long-Term Momentum | -0.40% z-0.6 | +0.30% | -0.86% | -4.23% | -5.48% |
| Style-Positioning | |||||
| Hedge-Fund Ownership | -0.07% z-0.7 | +0.11% | +0.51% | +0.46% | +0.84% |
| Short Interest | -0.03% z-0.2 | -0.31% | +0.42% | -0.00% | +1.23% |
| Style-Flow | |||||
| Morning Activity | +0.20% z+1.6 | +0.01% | +1.13% | +2.44% | +1.24% |
| Short-Sale Activity | -0.04% z-0.3 | +0.02% | +0.36% | +0.78% | +0.56% |
| Thematic | |||||
| Gold | +0.60% z+1.9 | +0.33% | +2.66% | +3.51% | +2.34% |
| Semiconductors | -0.85% z-1.4 | +0.33% | -2.29% | -4.96% | -7.26% |
| Treasury (Duration) | +0.11% z+0.3 | +0.08% | +0.73% | -0.29% | +1.12% |
| China | +0.04% z+0.1 | +0.22% | +0.27% | +0.80% | -2.26% |
| Oil | +0.05% z+0.1 | +0.77% | +1.84% | +3.28% | +0.10% |
| Bitcoin / Crypto | -0.00% z-0.0 | +0.58% | +1.05% | +1.45% | -0.02% |
5/20/60d windows include today's session; 1d is the previous session.
Market variance share. The fraction of cross-sectional variance explained by the market factor — the attribution companion to pairwise correlation, not a substitute for it.
Factor z-score. Today's factor return divided by its daily-return standard deviation over ~1,600 trading days.
Stock-specific (idiosyncratic) return. The part of a stock's move not explained by market, style, or thematic factors in our decomposition.
Data compiled by FactorPulse AI; edited and verified by Jeff Klein. For informational purposes only. Does not constitute financial advice, an investment recommendation, or an offer to buy or sell any securities. Always consult a qualified financial professional before making investment decisions.
For more on factor construction methodology, see www.factorpulse.com/glossary.