Walmart's US comparable sales did today's damage, not the risk complex: the stock closed down -9.08% and took $82 billion of market value with it, while Beta sat flat at z=-0.2 and stock-specific moves took 76.2% of cross-sectional variance. The second leg was Moderna handing back Wednesday's cancer-vaccine gain, with Short Interest at z=-1.9 as the most heavily shorted names underperformed the barely-shorted ones. Underneath, realized correlation has stopped setting new lows — the five-day gauge is back above its three-month median for the first time since the July stress.
Walmart's second quarter is the session. US comparable sales grew 2.6% against a 3.7% forecast, the slowest in six years, with prescription drug price deflation taking the Health & Wellness line down with it Bloomberg. The rest of the print was fine: revenue of $187.94B and adjusted EPS of $0.81 both beat, the full-year outlook went up, and the company said it is eligible for $2.9 billion of tariff refunds it intends to spend on keeping prices low CNBC. The market bought none of it and marked the stock down the most since 2022 Bloomberg. The other reporters went the other way: Deere closed +7.53% on Q3 EPS of $5.10 against $4.70 consensus and a raised full-year net income range of $4.75–5.00B CNBC, and Nordson closed +8.00% on a $2.41 adjusted EPS beat and narrowed guidance Bloomberg. NetEase closed -5.81% and Coty -9.08%; Ross Stores closed -2.51% and added +4.01% in late trading. Workday and Intuit report after the bell.
For a -0.90% day in SPY, the factor complex is remarkably quiet. Beta is flat at z=-0.2 — the market-sensitive names were neither dumped nor bid as a group. Stock-specific moves took 76.2% of cross-sectional variance against a 66.3% one-year average, and the style block collapsed to 9.1% from 52.6% in yesterday's session. Advance Auto Parts closed -24.59% with no driver anywhere in today's coverage; the market is repricing it on its own.
| Factor | Return | Z-Score | 5d Z | 20d Z | 63d Z | Category | Direction |
|---|---|---|---|---|---|---|---|
| One-Day Momentum | +0.55% | z=+1.9 | -0.3 | +1.0 | +1.2 | Style-Momentum | Yesterday's movers kept going |
| Short Interest | -0.32% | z=-1.9 | +0.3 | +0.3 | +1.0 | Style-Positioning | Most-shorted underperformed |
| Bitcoin / Crypto | +0.56% | z=+1.9 | +1.4 | +0.9 | +0.1 | Thematic | High-exposure names led |
| Oil | +0.75% | z=+1.6 | +1.9 | +1.1 | -0.1 | Thematic | Oil-levered names led |
| Hedge-Fund Ownership | +0.11% | z=+1.0 | +2.8 | +1.0 | +0.6 | Style-Positioning | HF-owned names ahead on the week |
| Profitability | +0.18% | z=+0.9 | -0.3 | -1.6 | -0.8 | Style | Profitable names outperformed |
| Short-Sale Activity | -0.02% | z=-0.1 | +1.6 | +1.8 | +0.7 | Style-Flow | No spread today |
| Beta | -0.15% | z=-0.2 | -1.2 | -0.3 | -0.4 | Style-Risk | Flat — not a driver |
The selling was broad even so. Industrials fell -1.66% and Health Care -1.62%, the equal-weighted universe was down -0.75%, small caps lagged again with IWM at -1.42%, and implied index volatility rose more than a point. A tape can be broadly lower and still be organised by nothing.
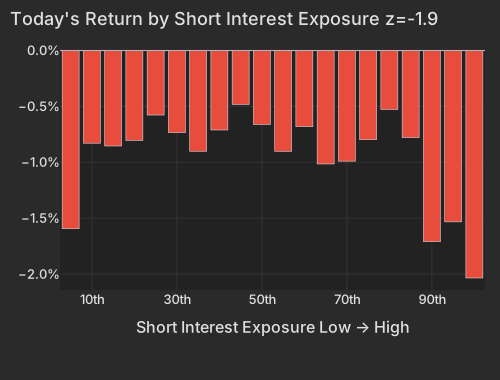
Moderna closed the session down -23.66%, $16 billion of market value gone, one day after Phase 3 cancer-vaccine data added roughly $45 billion Financial Times. With short interest at 13.5% of float Financial Times it carries the largest Short Interest exposure of any major mover, and the factor returned -0.32% at z=-1.9, with the most heavily shorted bucket down -2.0%. That is the model's most persistent style drag paying again; yesterday's print, when the shorted names ran, is the exception to flag, not the new state of the world. XBI fell -3.38% after gaining +5.90% in the prior session and +33.73% over the past 63.
| Bucket | Avg Ret Pct |
|---|---|
| 1 | -1.59 |
| 2 | -0.83 |
| 3 | -0.85 |
| 4 | -0.80 |
| 5 | -0.58 |
| 6 | -0.73 |
| 7 | -0.90 |
| 8 | -0.71 |
| 9 | -0.48 |
| 10 | -0.66 |
| 11 | -0.90 |
| 12 | -0.68 |
| 13 | -1.01 |
| 14 | -0.99 |
| 15 | -0.80 |
| 16 | -0.53 |
| 17 | -0.78 |
| 18 | -1.71 |
| 19 | -1.53 |
| 20 | -2.04 |
One-Day Momentum returned +0.55% at z=+1.9, and the work was done on the left: yesterday's biggest losers fell a further -2.4%. Set that against the one-week lookback and the horizon split is the finding. Short-Term Momentum's completed 20-day return is -5.74%, the 0.3rd percentile of every 20-day window since 2020, at a 20-day z of -4.2 and a 63-day z of -3.4. For a month now, moves have persisted one session and then been faded inside the week.
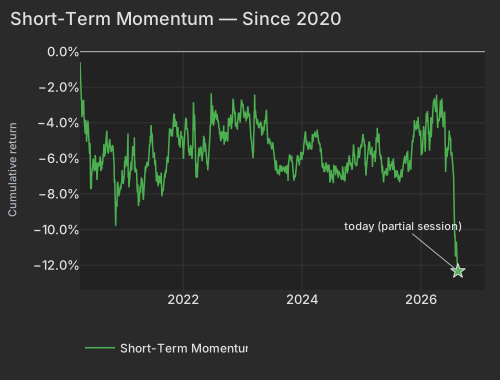
| Date | Cumret Pct |
|---|---|
| 2020-04-07 | -0.58 |
| 2020-04-30 | -3.32 |
| 2020-05-22 | -4.48 |
| 2020-06-16 | -7.66 |
| 2020-07-09 | -5.81 |
| 2020-07-31 | -6.25 |
| 2020-08-24 | -6.35 |
| 2020-09-16 | -4.76 |
| 2020-10-08 | -5.16 |
| 2020-10-30 | -5.88 |
| 2020-11-23 | -7.45 |
| 2020-12-16 | -7.63 |
| 2021-01-11 | -6.15 |
| 2021-02-03 | -7.44 |
| 2021-02-26 | -5.49 |
| 2021-03-22 | -6.81 |
| 2021-04-14 | -7.96 |
| 2021-05-06 | -7.48 |
| 2021-05-28 | -6.37 |
| 2021-06-22 | -4.58 |
| 2021-07-15 | -6.15 |
| 2021-08-06 | -7.39 |
| 2021-08-30 | -7.82 |
| 2021-09-22 | -6.33 |
| 2021-10-14 | -4.42 |
| 2021-11-05 | -3.47 |
| 2021-11-30 | -4.28 |
| 2021-12-22 | -4.73 |
| 2022-01-14 | -3.90 |
| 2022-02-08 | -5.44 |
| 2022-03-03 | -5.10 |
| 2022-03-25 | -6.29 |
| 2022-04-19 | -5.51 |
| 2022-05-11 | -4.98 |
| 2022-06-03 | -6.50 |
| 2022-06-28 | -4.05 |
| 2022-07-21 | -3.46 |
| 2022-08-12 | -4.28 |
| 2022-09-06 | -4.84 |
| 2022-09-28 | -4.88 |
| 2022-10-20 | -3.83 |
| 2022-11-11 | -3.45 |
| 2022-12-06 | -3.82 |
| 2022-12-29 | -2.87 |
| 2023-01-24 | -3.92 |
| 2023-02-15 | -3.77 |
| 2023-03-10 | -5.67 |
| 2023-04-03 | -4.05 |
| 2023-04-26 | -4.10 |
| 2023-05-18 | -3.85 |
| 2023-06-12 | -5.03 |
| 2023-07-06 | -5.31 |
| 2023-07-28 | -6.11 |
| 2023-08-21 | -6.38 |
| 2023-09-13 | -6.61 |
| 2023-10-05 | -6.37 |
| 2023-10-27 | -6.14 |
| 2023-11-20 | -7.03 |
| 2023-12-13 | -6.16 |
| 2024-01-08 | -5.85 |
| 2024-01-31 | -5.27 |
| 2024-02-23 | -5.42 |
| 2024-03-18 | -4.64 |
| 2024-04-10 | -4.68 |
| 2024-05-02 | -6.13 |
| 2024-05-24 | -6.46 |
| 2024-06-18 | -6.35 |
| 2024-07-12 | -7.28 |
| 2024-08-05 | -6.64 |
| 2024-08-27 | -6.95 |
| 2024-09-19 | -7.22 |
| 2024-10-11 | -6.65 |
| 2024-11-04 | -6.61 |
| 2024-11-26 | -6.30 |
| 2024-12-19 | -5.92 |
| 2025-01-15 | -5.03 |
| 2025-02-07 | -6.37 |
| 2025-03-04 | -5.82 |
| 2025-03-26 | -5.72 |
| 2025-04-17 | -4.87 |
| 2025-05-12 | -6.83 |
| 2025-06-04 | -6.76 |
| 2025-06-27 | -6.69 |
| 2025-07-22 | -6.32 |
| 2025-08-13 | -6.92 |
| 2025-09-05 | -6.62 |
| 2025-09-29 | -6.02 |
| 2025-10-21 | -6.69 |
| 2025-11-12 | -5.10 |
| 2025-12-05 | -4.19 |
| 2025-12-30 | -4.70 |
| 2026-01-23 | -4.56 |
| 2026-02-17 | -3.76 |
| 2026-03-11 | -4.26 |
| 2026-04-02 | -3.22 |
| 2026-04-27 | -3.85 |
| 2026-05-19 | -3.74 |
| 2026-06-11 | -5.41 |
| 2026-07-07 | -4.89 |
| 2026-07-29 | -8.51 |
| 2026-08-20 | -12.33 |
The conditions for that pattern are all in place. Implied single-stock volatility (Cboe VIXEQ) is 38.26, the 81st percentile of its own history, while implied index volatility has come down 22% from its July 29 high of 20.66. Goldman Sachs Prime Brokerage reported clients as net buyers of US equities for five consecutive sessions in the week ended August 14, at +2.1 standard deviations of buying velocity, with gross leverage at 203.5% — the 4th percentile of the past year. Our own ownership lens agrees on direction: Hedge-Fund Ownership carries a 5-day z=+2.8, the hedge-fund-owned names outperforming through the week. The same desk put global momentum down 4.7 standard deviations in today's session; the US cross-section does not show it — Long-Term Momentum +0.35%, Short-Term Momentum +0.15%, Medium-Term Momentum -0.12%. Different construction and a wider universe, but on a move that size the two should at least point the same way.
Oil returned +0.75% at z=+1.6 and Bitcoin / Crypto +0.56% at z=+1.9 — the only two thematic factors carrying a real signal. Bitcoin rose 11% to a two-month high near $71,000, adding about $190 billion of crypto market value after the pro-crypto policy push around the Crypto CLARITY Act Economic Times; Coinbase closed +7.38%. Crude firmed after the Trump administration escalated its economic blockade of Iran, aimed at collapsing the roughly 1.5 million barrels a day Tehran still exports Bloomberg. Aerospace and defense kept sliding with no fresh catalyst in the coverage.
| ETF | Theme | Today | 1d Ago | 5d Ago | 20d Ago | 63d Ago |
|---|---|---|---|---|---|---|
| BITO | crypto | +6.12% | +5.96% | +8.19% | +3.35% | -11.74% |
| USO | oil | +2.69% | +0.19% | +2.84% | -0.58% | -14.42% |
| GDX | gold miners | +2.41% | +9.42% | +7.00% | +26.93% | +16.17% |
| SPY | large cap | -0.90% | +0.21% | -0.44% | +2.90% | +4.82% |
| XLP | consumer staples | -1.44% | +1.12% | +1.72% | +2.56% | +0.52% |
| XLV | healthcare | -1.79% | +3.51% | +4.30% | +10.19% | +19.25% |
| ITB | homebuilders | -2.50% | +3.10% | +1.11% | +4.00% | +15.11% |
| XBI | biotech | -3.38% | +5.90% | +6.37% | +11.47% | +33.73% |
| XAR | defense | -4.33% | -2.18% | -3.15% | +7.49% | +9.50% |
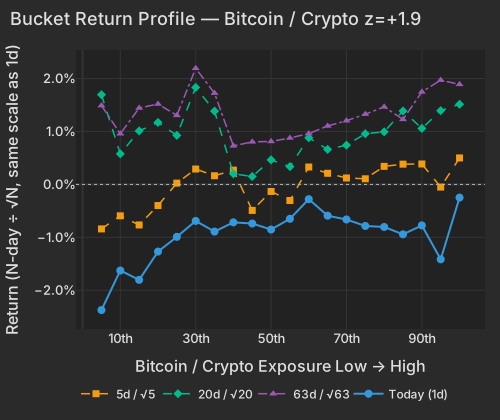
| Bucket | Ret 1D Pct | Ret 5D Norm Pct | Ret 20D Norm Pct | Ret 63D Norm Pct |
|---|---|---|---|---|
| 1 | -2.37 | -0.84 | 1.70 | 1.49 |
| 2 | -1.63 | -0.59 | 0.58 | 0.96 |
| 3 | -1.80 | -0.77 | 1.01 | 1.44 |
| 4 | -1.27 | -0.40 | 1.17 | 1.52 |
| 5 | -0.99 | 0.02 | 0.93 | 1.30 |
| 6 | -0.69 | 0.29 | 1.83 | 2.19 |
| 7 | -0.89 | 0.16 | 1.38 | 1.72 |
| 8 | -0.72 | 0.27 | 0.20 | 0.73 |
| 9 | -0.74 | -0.49 | 0.15 | 0.80 |
| 10 | -0.85 | -0.13 | 0.46 | 0.81 |
| 11 | -0.65 | -0.30 | 0.34 | 0.88 |
| 12 | -0.28 | 0.33 | 0.88 | 0.96 |
| 13 | -0.59 | 0.21 | 0.66 | 1.10 |
| 14 | -0.66 | 0.12 | 0.74 | 1.20 |
| 15 | -0.78 | 0.11 | 0.96 | 1.33 |
| 16 | -0.80 | 0.34 | 0.99 | 1.46 |
| 17 | -0.94 | 0.38 | 1.39 | 1.23 |
| 18 | -0.77 | 0.39 | 1.06 | 1.75 |
| 19 | -1.42 | -0.05 | 1.39 | 1.97 |
| 20 | -0.25 | 0.50 | 1.51 | 1.89 |
The Philadelphia Fed's manufacturing index printed 47.4 against a 25.0 consensus and jobless claims fell to 206,000, and the curve read it as growth: the 10-year yield rose 4.7bp to 4.70% and the 30-year 5.3bp to 5.25%, against 0.6bp at the 2-year CNBC. Rate-sensitive equities wore it — homebuilders gave back a chunk of a 63-day run that is still +15.11% in ITB, and TLT fell -0.86%. Treasury Secretary Bessent's signal that the upsized buyback program could be expanded further did not hold the long end down Bloomberg, and precious metals kept bidding with the dollar unchanged at 98.88 CNBC.
Realized 20-day pairwise correlation is 8.08%, the 3.6th percentile since 2020 — but it has stopped making new lows. Against the past three months it sits mid-pack at the 44th percentile, and the five-day gauge at 7.58% has climbed back above its three-month median, at the 54th percentile versus the 40th at the prior close. The implied side moved with it: implied index volatility (Cboe VIX) rose 1.14 to 16.03 and implied one-month single-stock correlation (Cboe COR1M) rose 1.38 to 9.33, still the 2.9th percentile of its own 20-year history. Today's session ran a market share of variance of 9.4%, an ordinary day inside a month where the index leg has explained 6.0% of the cross-section. The index leg is waking up while single names still do all the work — which is precisely the configuration that lets Walmart drop nine points and Deere gain eight on the same tape.
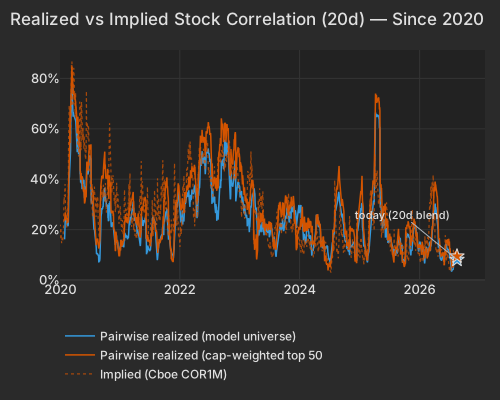
| Series | Today Pct | Prev Close Pct |
|---|---|---|
| pairwise_model | 8.08 | 7.88 |
| pairwise_top500 | 9.42 | 10.09 |
| implied_cor1m |
Initial Claims the BLS, released at 8:30 AM ET, fell 6,000 to a seasonally adjusted 206,000 for the week ended August 15, below the 210,000 consensus, while continuing claims rose 18,000 to 1.799 million — low firing, slow hiring. The Philadelphia Fed Manufacturing Survey, released at 8:30 AM ET, jumped to 47.4 from 41.4 against a 25.0 consensus, with the employment component up 18 points to 27.9 and future activity expectations at a 43-year high; prices paid eased to 40.9.
Variance decomposition: live intraday — 20260820 session, bracketed against its trailing-year range. Factor returns are trailing through last close. Total cross-sectional dispersion: 33%ile of the past year.
Variance mix — % of total, today vs 1d ago vs 1-yr avg
market 71%ile style 20%ile thematic 87%ile idiosyncratic 56%ile
Variance explained — today vs. factor's trailing-year range
Marker = the factor's share of today's total variance, placed in its own trailing-year range (box 25–75%ile, ticks 90%ile and max). Amber marker = unusually load-bearing today (≥90%ile of its own year). Factor name green = up today / red = down.
Correlation & dispersion — realized vs implied
Pairwise realized correlation (20d): 8.08% 3.6%ile since 2020 · 44%ile 3m
Top-500 pairwise: 9.42% 5.8%ile since 2020 · 32%ile 3m · implied (Cboe COR1M): 9.33 2.9%ile of its own history (gap +0.1pp)
5-day gauge: 7.58% — 54%ile of the past 3 months (lifting off the record lows)
Realized 20d vol (ann. pts): all stocks 51 vs VIXEQ 38 · index 12 vs VIX 16 · style factors 28 93.7%ile
20-day window (19 completed days + today); percentiles vs model history since 2020; '3m' tokens rank vs the trailing 63 trading days; definitions in Terms below. Implied prints (Cboe) are delayed ~15 min. as of 15:58 ET
High-beta momentum cohort (eq-wt, since-2020 rank): -0.7% 33%ile · rest of market -0.6%
| Factor | Today | 1d | 5d | 20d | 60d |
|---|---|---|---|---|---|
| Style-Risk | |||||
| International | +0.36% z+1.2 | +0.20% | +0.82% | -0.01% | -1.05% |
| Residual Volatility | +0.20% z+0.4 | +0.54% | +0.44% | +3.62% | -0.16% |
| Beta | -0.15% z-0.1 | -0.79% | -2.50% | -1.44% | -6.71% |
| Style | |||||
| Dividend Yield | +0.25% z+1.4 | -0.13% | +0.42% | -0.22% | -0.85% |
| Profitability | +0.18% z+0.9 | -0.25% | -0.14% | -1.34% | -1.56% |
| Liquidity | +0.25% z+0.9 | +0.09% | +1.00% | +1.43% | -0.52% |
| Leverage | +0.14% z+0.8 | -0.08% | -0.35% | -2.42% | -2.62% |
| Value | +0.17% z+0.7 | -0.04% | +0.11% | +0.12% | -0.70% |
| Size | +0.12% z+0.3 | -0.47% | -0.23% | -0.57% | -1.89% |
| Growth | +0.01% z+0.0 | -0.16% | -0.25% | +0.83% | +3.06% |
| Style-Momentum | |||||
| One-Day Momentum | +0.55% z+1.9 | +0.48% | -0.20% | +1.26% | +1.85% |
| Long-Term Momentum | +0.35% z+0.5 | -1.46% | +0.13% | -5.16% | -5.41% |
| Short-Term Momentum | +0.15% z+0.5 | -0.32% | -1.02% | -5.74% | -8.50% |
| Medium-Term Momentum | -0.12% z-0.4 | +0.73% | +0.65% | +2.58% | +1.73% |
| Style-Positioning | |||||
| Short Interest | -0.32% z-1.9 | +0.60% | +0.12% | +0.19% | +1.57% |
| Hedge-Fund Ownership | +0.11% z+1.0 | +0.26% | +0.70% | +0.49% | +1.07% |
| Style-Flow | |||||
| Short-Sale Activity | -0.02% z-0.1 | +0.20% | +0.39% | +0.89% | +0.65% |
| Morning Activity | +0.00% z+0.0 | +0.65% | +0.87% | +2.16% | +0.89% |
| Thematic | |||||
| Bitcoin / Crypto | +0.56% z+1.9 | +0.35% | +0.96% | +1.16% | +0.22% |
| Oil | +0.75% z+1.6 | +0.10% | +2.06% | +2.44% | -0.61% |
| Gold | +0.32% z+1.0 | +1.34% | +2.08% | +3.11% | +1.57% |
| Semiconductors | +0.37% z+0.6 | -1.86% | -0.82% | -5.46% | -6.65% |
| China | +0.21% z+0.5 | +0.13% | -0.25% | +0.88% | -2.35% |
| Treasury (Duration) | +0.06% z+0.2 | +0.35% | +0.63% | -0.26% | +1.10% |
5/20/60d windows include today's session; 1d is the previous session.
Pairwise realized correlation. Index variance net of the weighted idiosyncratic diagonal, over the cross terms — the estimator used for implied-correlation indices. 20-day window unless noted; history since 2020.
Market variance share. The fraction of cross-sectional variance explained by the market factor — the attribution companion to pairwise correlation, not a substitute for it.
Factor z-score. Today's factor return divided by its daily-return standard deviation over ~1,600 trading days.
Conditional importance. A factor's relative share of what a tree-based fit of today's stock returns explains; sums to 100% across factors.
High-beta momentum cohort. US names above $2B market cap in the top quintile of both raw beta and 12-month momentum; membership frozen at each month's first business day. “Top 50” = the 50 strongest by combined rank.
Dispersion (realized). Total cross-sectional volatility net of the market component; high dispersion is the flip side of low correlation.
Stock-specific (idiosyncratic) return. The part of a stock's move not explained by market, style, or thematic factors in our decomposition.
VIXEQ / DSPX / COR1M. Cboe implied indices: single-stock volatility, dispersion, and 1-month implied correlation (top-50 S&P names). Quotes delayed ~15 minutes.
Data compiled by FactorPulse AI; edited and verified by Jeff Klein. For informational purposes only. Does not constitute financial advice, an investment recommendation, or an offer to buy or sell any securities. Always consult a qualified financial professional before making investment decisions.
For more on factor construction methodology, see www.factorpulse.com/glossary.