Moderna and Merck reported that their personalized mRNA melanoma vaccine, combined with Merck's Keytruda, met its primary endpoint on recurrence-free survival in a Phase 3 trial of more than 1,100 patientsCNBCBloomberg. Moderna closed the session up +177.19%, Merck up +12.85% for $41.2B of added market value, and BioNTech — the other name in individualized cancer vaccines — up +21.89%. XBI rose +5.73% on 2.2× its usual pace and XLV +3.62%. SPY, meanwhile, added +0.18%.
| Factor | Return | Z-Score | 5d Z | 20d Z | 63d Z | Category | Direction |
|---|---|---|---|---|---|---|---|
| Short Interest | +1.05% | z=+6.23 | +2.54 | +1.01 | +1.57 | Style-Positioning | Most-shorted names outperformed |
| Morning Activity | +0.73% | z=+5.83 | +3.40 | +3.67 | +1.11 | Style-Flow | Habitually morning-heavy names led |
| Gold | +1.75% | z=+5.43 | +2.82 | +2.25 | +0.31 | Thematic | High gold exposure outperformed |
| Semiconductors | -1.87% | z=-3.09 | -1.14 | -1.87 | -1.04 | Thematic | High chip exposure lagged |
| Profitability | -0.55% | z=-2.90 | -1.20 | -1.88 | -1.14 | Style | More profitable names lagged |
| Growth | -0.55% | z=-2.29 | -0.81 | +0.69 | +1.15 | Style | Faster-growing names lagged |
| Long-Term Momentum | -1.24% | z=-1.90 | -0.2 | -1.6 | -0.9 | Style-Momentum | 12-month winners lagged |
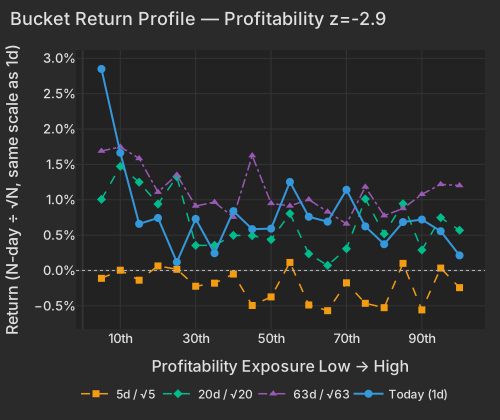
It did not land on quality. Profitability fell -0.55% at z=-2.90 with its least-profitable decile up +2.85%, and the biotech names inside that decile — Insmed, Rhythm, Madrigal, Iovance — gained +4.80% as a group. Growth ran z=-2.29 even with Eli Lilly closing +4.46% on obesity-pill prescription data. Bloomberg put the day's short squeeze in the sector at $5 billion, carrying XBI to its highest level since 2021Bloomberg; our own lens says the same thing from the exposure side, with Short Interest at +1.05% — Moderna itself carried a 3.8-sigma short-interest tilt fixed before the open. That direction runs against the largest persistent style drag in the model, where the most-shorted names normally lose, and it is not new: the same spread has paid over five days (z=+2.54) and three months (z=+1.57).
| Bucket | Ret 1D Pct | Ret 5D Norm Pct | Ret 20D Norm Pct | Ret 63D Norm Pct |
|---|---|---|---|---|
| 1 | 2.85 | -0.11 | 1.01 | 1.69 |
| 2 | 1.66 | 0.00 | 1.47 | 1.75 |
| 3 | 0.66 | -0.14 | 1.25 | 1.58 |
| 4 | 0.74 | 0.06 | 0.94 | 1.11 |
| 5 | 0.12 | 0.02 | 1.33 | 1.35 |
| 6 | 0.73 | -0.22 | 0.35 | 0.91 |
| 7 | 0.24 | -0.18 | 0.36 | 0.97 |
| 8 | 0.84 | -0.05 | 0.50 | 0.75 |
| 9 | 0.58 | -0.50 | 0.49 | 1.62 |
| 10 | 0.59 | -0.37 | 0.44 | 0.95 |
| 11 | 1.25 | 0.11 | 0.80 | 0.91 |
| 12 | 0.76 | -0.49 | 0.24 | 1.00 |
| 13 | 0.69 | -0.57 | 0.07 | 0.83 |
| 14 | 1.14 | -0.17 | 0.31 | 0.66 |
| 15 | 0.62 | -0.46 | 1.01 | 1.18 |
| 16 | 0.37 | -0.53 | 0.52 | 0.78 |
| 17 | 0.68 | 0.10 | 0.94 | 0.88 |
| 18 | 0.72 | -0.56 | 0.29 | 1.08 |
| 19 | 0.56 | 0.03 | 0.75 | 1.22 |
| 20 | 0.21 | -0.24 | 0.57 | 1.20 |
The pushback on all of it: Short Interest took none of the model's conditional importance today, while Semiconductors took 34%. The loudest print in the factor set is not the one explaining the cross-section.
Gold rose +1.75% at z=+5.43, the top of its since-2020 distribution across 1,665 sessions, and its exposure axis took 3.5% of cross-sectional variance — more than any other factor today. GDX gained +9.44% on 2.1× the typical pace, Agnico Eagle +10.54% and Newmont +7.77% pushing Materials to +2.95%, the strongest sector on the board. Perpetua Resources' +9.63% was almost entirely the gold axis rather than anything about the company; Hecla's +14.09% was its own move.
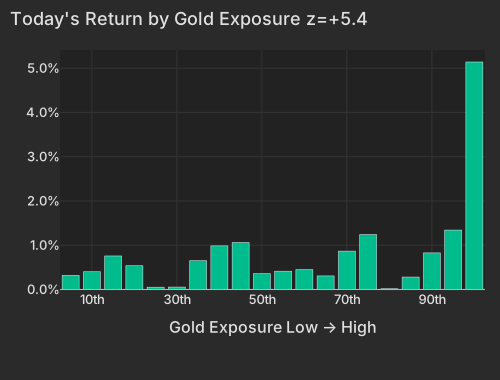
| Bucket | Avg Ret Pct |
|---|---|
| 1 | 0.32 |
| 2 | 0.40 |
| 3 | 0.76 |
| 4 | 0.54 |
| 5 | 0.05 |
| 6 | 0.05 |
| 7 | 0.65 |
| 8 | 0.99 |
| 9 | 1.06 |
| 10 | 0.36 |
| 11 | 0.41 |
| 12 | 0.45 |
| 13 | 0.31 |
| 14 | 0.87 |
| 15 | 1.24 |
| 16 | 0.02 |
| 17 | 0.28 |
| 18 | 0.83 |
| 19 | 1.34 |
| 20 | 5.14 |
The mechanism was the dollar and the long end, not a rate cut being priced. The dollar index fell -0.85% to 98.81CNBC, and the 30-year Treasury yield dropped 10.1 basis points to 5.18% with the 10-year at 4.64%, down 6.9CNBC, after Treasury Secretary Scott Bessent doubled long-dated debt buybacks to steady the marketBloomberg. That rally happened despite July FOMC federalreserve.gov minutes, released at 2:00 PM ET, showing many officials ready to raise rates if inflation does not coolFT. Regional banks took the hawkish half of that: KRE fell -2.27% on twice its usual volume. Today's gold move also lands on an established run — GDX is up +19.89% over 20 sessions, and the factor's 20-day z is +2.25 — with the Iran conflict still unresolved in the backgroundNYT.
| ETF | Theme | Today | 1d Ago | 5d Ago | 20d Ago | 63d Ago |
|---|---|---|---|---|---|---|
| GDX | gold miners | +9.44% | -3.20% | -1.30% | +19.89% | +2.08% |
| XBI | biotech | +5.73% | +0.36% | +1.29% | +3.63% | +25.41% |
| GLD | gold bullion | +3.77% | -1.71% | -0.60% | +6.33% | -4.75% |
| XLV | healthcare | +3.62% | +1.60% | +1.02% | +5.92% | +16.48% |
| TLT | long-term Treasuries | +1.67% | +0.38% | -0.64% | -2.39% | -2.27% |
| SMH | semiconductors | -1.48% | -4.09% | -0.55% | -2.45% | +4.32% |
| MTUM | momentum factor | -1.69% | -3.19% | +1.13% | -0.85% | +5.94% |
| KRE | regional banks | -2.27% | -0.70% | +0.05% | +1.15% | +13.15% |
Semiconductors fell -1.87% at z=-3.09, its highest-exposure bucket down -3.70%, and this is the axis the model says mattered most. The declines were carried by the factor, not by company news: Seagate -7.58%, FormFactor -6.87% and Viavi -5.14% all show almost nothing stock-specific in the split. It is also continuation, not a break — the factor is down -5.04% over 20 sessions with a 20-day z of -1.87. SK Hynix announced a 40 trillion won buyback, roughly $30 billion, after a 50% two-month share-price declineBloomberg, and EWY rose +2.39% after falling -8.13% in the prior session. Analog Devices closed the regular session down -0.99% on its own report, then added +1.19% in late trading, with AI data-center demand behind the numbersMorningstar.
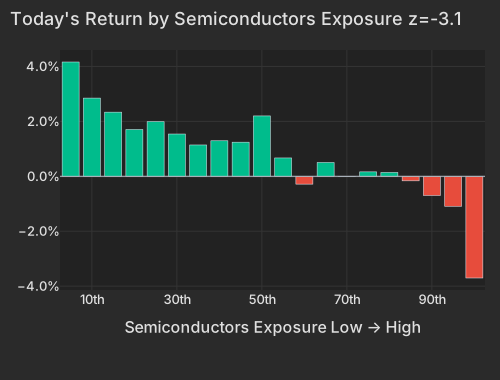
| Bucket | Avg Ret Pct |
|---|---|
| 1 | 4.16 |
| 2 | 2.85 |
| 3 | 2.34 |
| 4 | 1.70 |
| 5 | 1.99 |
| 6 | 1.54 |
| 7 | 1.14 |
| 8 | 1.29 |
| 9 | 1.24 |
| 10 | 2.20 |
| 11 | 0.67 |
| 12 | -0.28 |
| 13 | 0.50 |
| 14 | 0.00 |
| 15 | 0.16 |
| 16 | 0.14 |
| 17 | -0.16 |
| 18 | -0.70 |
| 19 | -1.09 |
| 20 | -3.70 |
The same pressure shows up in the high-beta momentum cohort, where the top 50 names fell -4.20%, inside the worst 6% of sessions since 2020, while the rest of the universe rose +0.93%. The more a name fit that profile, the harder it fell. Long-Term Momentum at -1.24%, z=-1.90, is the factor name for the same trade — its exposures correlate 0.60 with the group — and it took the largest style share of today's variance. This is now the third bruising session for that trade in a week, after August 12 and August 18, leaving the broader high-beta momentum group -14.90% below its peak as of yesterday's close. In yesterday's session the group traded below the market's volume pace, moved as one basket, and the easiest-to-sell names were hit hardest — the fingerprint of a systematic seller working through what it can clear first.
The reporters were a sideshow but a broad one: Estée Lauder closed +16.37% on a fiscal Q4 beat and improved guidance, adding $5.04BBloomberg, Target +4.51% and Lowe's +2.37% despite trimming its full-year targetsMorningstar, against TJX -4.07% and Keysight -6.06%.
Idiosyncratic risk explained 82.5% of today's cross-sectional variance against a one-year average of 66.5%, with the market factor at 1.4%. On the slower clock, 20-day realized pairwise correlation remains pinned near the bottom of its since-2020 range at 7.91%, and implied one-month single-stock correlation (Cboe COR1M) at 8.21 sits in the lowest 2% of its twenty-year history — the options market is priced for this to continue. A book hedged on style axes got no protection today; what moved it was one trial result and one gold print.
One quiet signal deserves its own line, because it has been building for a month. Morning Activity rose +0.73% at z=+5.83: the names that habitually run volume-heavy mornings — a retail- and international-skewing group, identified from trailing data before the open — beat the names whose volume spreads evenly through the day, and their 20-day run through yesterday's close is the strongest of any 20-day window since 2020.
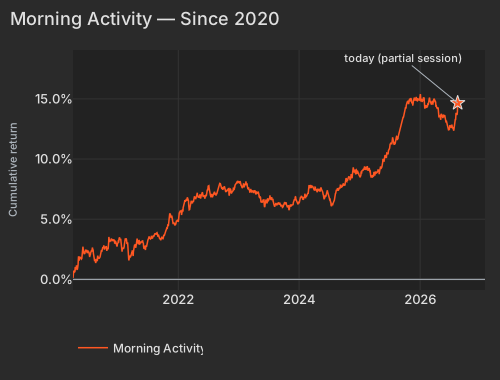
| Date | Cumret Pct |
|---|---|
| 2020-04-06 | 0.11 |
| 2020-04-29 | 1.04 |
| 2020-05-21 | 1.76 |
| 2020-06-15 | 2.21 |
| 2020-07-08 | 2.30 |
| 2020-07-30 | 2.45 |
| 2020-08-21 | 1.42 |
| 2020-09-15 | 1.84 |
| 2020-10-07 | 2.67 |
| 2020-10-29 | 2.53 |
| 2020-11-20 | 3.21 |
| 2020-12-15 | 3.00 |
| 2021-01-08 | 3.38 |
| 2021-02-02 | 2.58 |
| 2021-02-25 | 2.94 |
| 2021-03-19 | 1.89 |
| 2021-04-13 | 2.87 |
| 2021-05-05 | 3.04 |
| 2021-05-27 | 3.10 |
| 2021-06-21 | 2.82 |
| 2021-07-14 | 3.46 |
| 2021-08-05 | 3.66 |
| 2021-08-27 | 3.83 |
| 2021-09-21 | 3.35 |
| 2021-10-13 | 3.86 |
| 2021-11-04 | 4.56 |
| 2021-11-29 | 4.99 |
| 2021-12-21 | 4.87 |
| 2022-01-13 | 5.70 |
| 2022-02-07 | 6.29 |
| 2022-03-02 | 6.55 |
| 2022-03-24 | 6.38 |
| 2022-04-18 | 6.66 |
| 2022-05-10 | 6.81 |
| 2022-06-02 | 6.91 |
| 2022-06-27 | 7.40 |
| 2022-07-20 | 6.95 |
| 2022-08-11 | 7.12 |
| 2022-09-02 | 7.60 |
| 2022-09-27 | 7.49 |
| 2022-10-19 | 7.30 |
| 2022-11-10 | 7.41 |
| 2022-12-05 | 7.43 |
| 2022-12-28 | 8.19 |
| 2023-01-23 | 7.69 |
| 2023-02-14 | 7.89 |
| 2023-03-09 | 7.41 |
| 2023-03-31 | 7.40 |
| 2023-04-25 | 7.17 |
| 2023-05-17 | 6.46 |
| 2023-06-09 | 6.06 |
| 2023-07-05 | 6.64 |
| 2023-07-27 | 6.64 |
| 2023-08-18 | 6.23 |
| 2023-09-12 | 6.24 |
| 2023-10-04 | 6.35 |
| 2023-10-26 | 6.08 |
| 2023-11-17 | 6.10 |
| 2023-12-12 | 6.86 |
| 2024-01-05 | 6.59 |
| 2024-01-30 | 6.63 |
| 2024-02-22 | 7.11 |
| 2024-03-15 | 7.59 |
| 2024-04-09 | 7.67 |
| 2024-05-01 | 7.51 |
| 2024-05-23 | 7.32 |
| 2024-06-17 | 7.12 |
| 2024-07-11 | 6.39 |
| 2024-08-02 | 6.54 |
| 2024-08-26 | 7.36 |
| 2024-09-18 | 7.70 |
| 2024-10-10 | 8.26 |
| 2024-11-01 | 8.50 |
| 2024-11-25 | 9.20 |
| 2024-12-18 | 8.76 |
| 2025-01-14 | 8.91 |
| 2025-02-06 | 9.27 |
| 2025-03-03 | 9.27 |
| 2025-03-25 | 8.59 |
| 2025-04-16 | 8.91 |
| 2025-05-09 | 9.39 |
| 2025-06-03 | 10.04 |
| 2025-06-26 | 10.70 |
| 2025-07-21 | 11.60 |
| 2025-08-12 | 11.73 |
| 2025-09-04 | 12.40 |
| 2025-09-26 | 13.56 |
| 2025-10-20 | 14.80 |
| 2025-11-11 | 15.00 |
| 2025-12-04 | 14.85 |
| 2025-12-29 | 14.90 |
| 2026-01-22 | 14.88 |
| 2026-02-13 | 14.37 |
| 2026-03-10 | 14.73 |
| 2026-04-01 | 14.93 |
| 2026-04-24 | 13.97 |
| 2026-05-18 | 13.56 |
| 2026-06-10 | 13.03 |
| 2026-07-06 | 12.77 |
| 2026-07-28 | 12.47 |
| 2026-08-19 | 14.66 |
The loose end is after the bell: Ascendis Pharma closed the session +4.13% and then fell -11.90% in late trading, a move that belongs to whatever broke post-close rather than to today's factor structure, and no driver for it appears in the coverage yet. The larger unresolved question is the one the long end and the gold complex answered differently from regional banks: minutes showing officials ready to hike, met by a 10-basis-point rally in the 30-year and the strongest gold session in the model's history since 2020. September resolves that.
Variance decomposition: live intraday — 20260819 session, bracketed against its trailing-year range. Factor returns are trailing through last close. Total cross-sectional dispersion: 99.6%ile of the past year.
Variance mix — % of total, today vs 1d ago vs 1-yr avg
market 29%ile style 27%ile thematic 91.6%ile idiosyncratic 78%ile
Variance explained — today vs. factor's trailing-year range
Marker = the factor's share of today's total variance, placed in its own trailing-year range (box 25–75%ile, ticks 90%ile and max). Amber marker = unusually load-bearing today (≥90%ile of its own year). Factor name green = up today / red = down.
Correlation & dispersion — realized vs implied
Pairwise realized correlation (20d): 7.91% 3.0%ile since 2020 · 38%ile 3m
Top-500 pairwise: 10.04% 7.2%ile since 2020 · 40%ile 3m · implied (Cboe COR1M): 8.21 1.8%ile of its own history (gap +1.8pp)
Realized 20d vol (ann. pts): all stocks 51 vs VIXEQ 38 · index 12 vs VIX 15 · style factors 28 94.2%ile
20-day window (19 completed days + today); percentiles vs model history since 2020; '3m' tokens rank vs the trailing 63 trading days; definitions in Terms below. Implied prints (Cboe) are delayed ~15 min. as of 15:58 ET
Top 50 high-beta momentum names (eq-wt, since-2020 rank): -4.2% 6.2%ile · rest of market +0.9%
| Factor | Today | 1d | 5d | 20d | 60d |
|---|---|---|---|---|---|
| Style-Risk | |||||
| Residual Volatility | +0.64% z+1.3 | -0.04% | +1.05% | +3.40% | -0.55% |
| Beta | -0.67% z-0.7 | -2.71% | -2.51% | -1.71% | -4.23% |
| International | +0.16% z+0.5 | +0.06% | +0.21% | -0.54% | -1.35% |
| Style | |||||
| Profitability | -0.55% z-2.9 | -0.11% | -0.51% | -1.60% | -1.81% |
| Growth | -0.55% z-2.3 | -0.09% | -0.44% | +0.75% | +2.69% |
| Size | -0.46% z-1.3 | +0.39% | -0.29% | -0.95% | -2.22% |
| Dividend Yield | -0.19% z-1.1 | +0.03% | +0.25% | -0.61% | -1.18% |
| Leverage | -0.18% z-1.0 | -0.22% | -0.60% | -2.46% | -2.93% |
| Value | -0.14% z-0.6 | -0.13% | -0.08% | -0.12% | -0.72% |
| Liquidity | +0.04% z+0.1 | +0.01% | +1.16% | +0.94% | -1.22% |
| Style-Momentum | |||||
| Medium-Term Momentum | +0.61% z+2.1 | +0.31% | +0.47% | +2.03% | +1.73% |
| Long-Term Momentum | -1.24% z-1.9 | -0.59% | -0.30% | -4.52% | -4.70% |
| One-Day Momentum | +0.39% z+1.4 | -0.61% | -1.09% | +0.73% | +1.41% |
| Short-Term Momentum | -0.13% z-0.4 | -0.43% | -1.28% | -5.53% | -8.28% |
| Style-Positioning | |||||
| Short Interest | +1.05% z+6.2 | +0.32% | +0.96% | +0.76% | +2.24% |
| Hedge-Fund Ownership | +0.14% z+1.2 | +0.11% | +0.38% | +0.24% | +0.77% |
| Style-Flow | |||||
| Morning Activity | +0.73% z+5.8 | +0.18% | +0.95% | +2.05% | +1.08% |
| Short-Sale Activity | +0.18% z+1.7 | +0.02% | +0.42% | +0.69% | +0.71% |
| Thematic | |||||
| Gold | +1.75% z+5.4 | +0.15% | +2.03% | +3.24% | +1.86% |
| Semiconductors | -1.87% z-3.1 | -1.12% | -1.54% | -5.04% | -5.86% |
| Treasury (Duration) | +0.50% z+1.5 | +0.14% | +0.42% | +0.08% | +1.10% |
| Bitcoin / Crypto | +0.38% z+1.2 | +0.04% | +0.84% | +0.31% | -0.28% |
| Oil | -0.07% z-0.1 | +0.28% | +1.00% | +1.45% | -1.88% |
| China | -0.00% z-0.0 | +0.07% | -0.23% | -0.06% | -3.23% |
5/20/60d windows include today's session; 1d is the previous session.
Pairwise realized correlation. Index variance net of the weighted idiosyncratic diagonal, over the cross terms — the estimator used for implied-correlation indices. 20-day window unless noted; history since 2020.
Market variance share. The fraction of cross-sectional variance explained by the market factor — the attribution companion to pairwise correlation, not a substitute for it.
Factor z-score. Today's factor return divided by its daily-return standard deviation over ~1,600 trading days.
Conditional importance. A factor's relative share of what a tree-based fit of today's stock returns explains; sums to 100% across factors.
High-beta momentum cohort. US names above $2B market cap in the top quintile of both raw beta and 12-month momentum; membership frozen at each month's first business day. “Top 50” = the 50 strongest by combined rank.
Stock-specific (idiosyncratic) return. The part of a stock's move not explained by market, style, or thematic factors in our decomposition.
VIXEQ / DSPX / COR1M. Cboe implied indices: single-stock volatility, dispersion, and 1-month implied correlation (top-50 S&P names). Quotes delayed ~15 minutes.
Data compiled by FactorPulse AI; edited and verified by Jeff Klein. For informational purposes only. Does not constitute financial advice, an investment recommendation, or an offer to buy or sell any securities. Always consult a qualified financial professional before making investment decisions.
For more on factor construction methodology, see www.factorpulse.com/glossary.