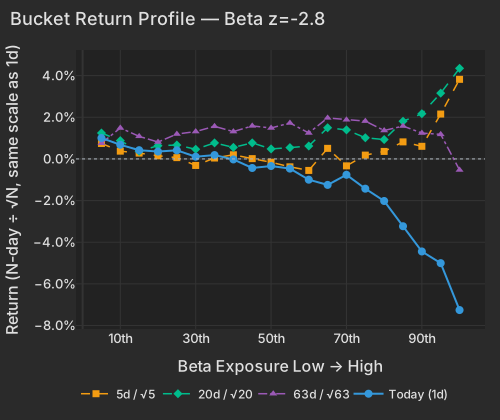
The Strait of Hormuz attacks gave the session its trigger, and the damage went down one axis only. The top 50 high-beta momentum names fell -7.93% while the rest of the universe was unchanged, with Beta at z=-2.8 taking 45.3% of the day's cross-sectional variance. The 30-year Treasury yield eased 2.2 bps on the session, so whatever hit the high-beta complex today, it was not a duration shock.
Two commercial vessels transiting the Strait of Hormuz were attacked, and President Trump said no talks are scheduled with Iran while teasing action in the StraitNYT. Energy took the bid — XLE +1.78%, with the S&P 500 energy index approaching its first record since MarchNYT — and equities paid for it in exactly one place. Beta returned -2.71% at z=-2.8, the highest-beta bucket dropped -7.26%, and its AI, semiconductor and data-center constituents (AOSL, NNE, POET, MRAM) were down -11.32% weighted. SPY, by comparison, closed -0.69%.
The cross-section reorganized along the risk axis rather than the index. Beta alone accounted for 45.3% of today's cross-sectional variance, the 98.6th percentile since 2020, and the style block as a whole took 53.5% against a one-year average of 21.5% — the axis a levered book actually loads on has rarely been this load-bearing. Semiconductors added -1.12% at z=-1.9, its highest-exposure bucket -5.49% with the memory and storage names inside it -9.41%. The two fast horizons agree on direction: One-Day Momentum at z=-2.3 (five-day z=-2.3) says yesterday's biggest gainers were sold hardest, their bucket -3.10%, and Short-Term Momentum extended the same reversion at z=-1.4.
| Factor | Return | Z-Score | 5d Z | 20d Z | 63d Z | Category | Direction |
|---|---|---|---|---|---|---|---|
| Beta | -2.71% | z=-2.8 | -0.4 | -0.3 | -0.1 | Style-Risk | High-beta names underperformed |
| One-Day Momentum | -0.63% | z=-2.3 | -2.3 | +0.5 | +0.8 | Style-Momentum | Yesterday's movers reversed |
| Short Interest | +0.32% | z=+1.9 | -0.9 | -0.9 | +0.8 | Style-Positioning | Most-shorted names outperformed |
| Semiconductors | -1.12% | z=-1.9 | +1.1 | -1.0 | -0.6 | Thematic | Semis exposure underperformed |
| Short-Term Momentum | -0.44% | z=-1.4 | -2.2 | -4.2 | -3.4 | Style-Momentum | Last week's movers reverted |
| Morning Activity | +0.20% | z=+1.6 | +0.5 | +2.3 | +0.4 | Style-Flow | Morning-heavy names outperformed |
| Bucket | Ret 1D Pct | Ret 5D Norm Pct | Ret 20D Norm Pct | Ret 63D Norm Pct |
|---|---|---|---|---|
| 1 | 1.00 | 0.74 | 1.24 | 0.75 |
| 2 | 0.68 | 0.37 | 0.88 | 1.49 |
| 3 | 0.42 | 0.28 | 0.37 | 1.08 |
| 4 | 0.35 | 0.15 | 0.63 | 0.81 |
| 5 | 0.41 | 0.06 | 0.67 | 1.19 |
| 6 | 0.11 | -0.31 | 0.46 | 1.31 |
| 7 | 0.18 | 0.04 | 0.77 | 1.57 |
| 8 | -0.03 | 0.20 | 0.55 | 1.31 |
| 9 | -0.44 | 0.01 | 0.77 | 1.58 |
| 10 | -0.34 | -0.16 | 0.48 | 1.49 |
| 11 | -0.46 | -0.38 | 0.54 | 1.72 |
| 12 | -1.00 | -0.55 | 0.62 | 1.25 |
| 13 | -1.25 | 0.51 | 1.50 | 1.97 |
| 14 | -0.76 | -0.33 | 1.39 | 1.88 |
| 15 | -1.43 | 0.18 | 1.02 | 1.81 |
| 16 | -2.02 | 0.36 | 0.93 | 1.36 |
| 17 | -3.23 | 0.82 | 1.81 | 1.58 |
| 18 | -4.44 | 0.61 | 2.17 | 1.24 |
| 19 | -5.01 | 2.15 | 3.16 | 1.18 |
| 20 | -7.26 | 3.82 | 4.35 | -0.53 |
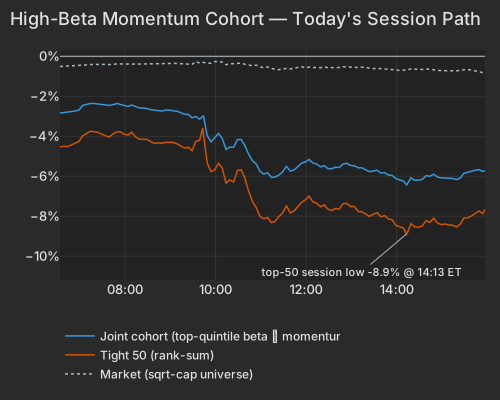
The high-beta momentum cohort is where this lands with force: the top 50 such names marked -7.93%, 15th-worst of 1,664 days since 2020, and the broader ~190-name group -5.84%, against +0.03% for names in neither screen. The selling spread across the group in its usual proportion, and it built through the afternoon to a low of -8.89% at 14:13 before a partial recovery. This is the second since-2020 extreme for the group in five sessions, after August 12. Short-Term Momentum's 20-day cumulative return of -5.80% sits in the bottom 0.2% of all 20-day windows since 2020 — each leg of this whipsaw, up and down, has been faded in turn.
| Series | Ret Pct |
|---|---|
| joint | -5.84 |
| tight50 | -7.93 |
| market | -0.80 |
| rest | 0.03 |
The names carrying it are not carrying stories. MaxLinear fell -13.78%, Wolfspeed -10.27%, Sandisk -9.53% and FormFactor -8.96%, each with a factor component near -9% to -10% and a stock-specific component of roughly zero. Micron closed the session -6.93% with style exposure explaining -7.56% of it and its own residual slightly positive: the day priced Micron as a beta-and-momentum position, not as a memory-chip company. The trailing columns below show what was being given back — memory chips and Korea had run hardest into today.
| ETF | Theme | Today | 1d Ago | 5d Ago | 20d Ago | 63d Ago |
|---|---|---|---|---|---|---|
| DRAM | memory chips & storage | -8.90% | +5.36% | +21.75% | +13.81% | +18.18% |
| EWY | south korea | -8.22% | +2.98% | +13.47% | +13.66% | +3.49% |
| SMH | semiconductors | -4.08% | +1.06% | +4.33% | +6.31% | +6.78% |
| ARKK | innovation growth | -3.21% | +0.80% | +1.63% | +9.07% | +9.15% |
| MTUM | momentum | -3.13% | +1.53% | +4.80% | +6.42% | +7.98% |
| XLK | technology | -2.47% | +0.16% | +2.15% | +8.31% | +7.98% |
| XLE | energy | +1.78% | +1.08% | +3.99% | +8.01% | +5.28% |
| XLV | healthcare | +1.58% | -0.19% | -0.83% | +4.90% | +15.13% |
| TLT | long-term bonds | +0.45% | -0.84% | -0.87% | -3.03% | -2.76% |
Hedge-Fund Ownership returned +0.11% at z=+1.0, and positive on a raw basis too, so hedge-fund-owned names were among the survivors rather than the victims. The top-50 group's own tilts point elsewhere: as of yesterday's snapshot it was retail-tilted on a heavy morning-activity reading (+1.21σ), flat on hedge-fund ownership and modestly less shorted than the universe (-0.67σ). In yesterday's session the group rose with volume running below the tape's pace — thin participation on the way up, before today's give-back. The trade is being sold; the direct lenses do not name who is selling it.
Short Interest ran the other way at z=+1.9, against the persistent drag that is one of the model's most reliable effects, and the composition matters: the print came from the barely-shorted end falling -2.62%, not from the crowded shorts rallying. Nor was this a rates event on the day. The 10-year Treasury yield sits at 4.71% and the 30-year at 5.29%, down 1.6 and 2.2 bps respectivelyCNBC, levels last seen in 2007 after a global bond sell-off driven by fiscal and inflation concernsEconomic Times. Long duration was the only thing that caught a bid, TLT +0.45%.
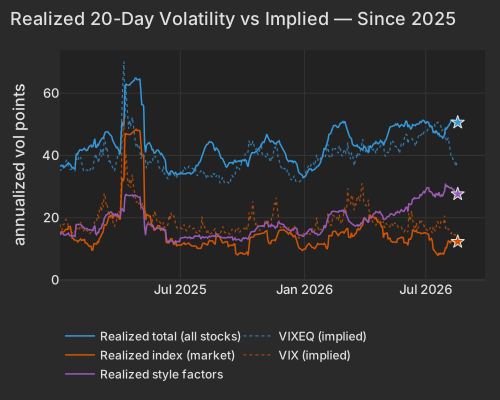
Realized style volatility is running at 27.6 vol points on the blended 20-day window, the 92.9th percentile since 2020, against a market leg of 12.3 points at the 25.7th. Implied volatility is priced for the same shape: index volatility (Cboe VIX) at 15.68, single-stock volatility (Cboe VIXEQ) at 37.78, with VIX 24% below its July 29 local high of 20.66. Pairwise realized correlation remains pinned near the low end of its since-2020 range at 8.16%, the 3.8th percentile. For a PM this is the whole point of today: index-level risk gauges will show almost nothing, and a book tilted to beta and twelve-month winners just took an eighth of its value out of the highest-conviction end.
| Series | Today Vol Pts | Prev Close Vol Pts |
|---|---|---|
| total | 50.60 | 50.80 |
| market | 12.30 | 12.39 |
| style | 27.60 | 27.86 |
Single-name prints ran wide of the factor story. Haemonetics closed +16.35% on a plasma-collection supply agreement with CSL Plasmathe SEC; UGI closed +9.78% after a reported KKR bid at $42.50 a share, a 21.1% premium to Monday's close; Targa closed +7.36% on 20-year Permian gathering and processing agreements with ExxonMobilCNBC. Baidu closed -12.76% after second-quarter results showed core advertising revenue down 19%Bloomberg. Klarna, which reported before the open, closed -22.99%, erasing $1.5B of market value. Mercury Systems closed -6.96% and then fell a further -15.41% in late trading, on a driver that has not yet reached the coverage. Meta closed -4.45%, taking $60.5B off its market value, none of it traceable to the day's factor complex.
Home Depot beat with second-quarter sales of $47.9 billion, up 5.7%, comparable sales up 1.7%, and reaffirmed annual guidanceBloomberg; the stock closed the session unchanged at +0.01%. Medtronic closed +1.77%, Palo Alto Networks -0.40%. Keysight closed -5.74% into its post-close report, carrying a +1.6σ semiconductor exposure straight into the worst possible tape for it. In Seoul the KOSPI gave up a 2.7% intraday advance to finish 1.55% lower as institutional selling overwhelmed early chip gainsEconomic Times — the same reversal EWY then priced at -8.22% through the US session. Two since-2020 extremes in five sessions, both in the same 50 names, and the ownership data still cannot say whose risk is coming off.
Variance decomposition: live intraday — 20260818 session, bracketed against its trailing-year range. Factor returns are trailing through last close. Total cross-sectional dispersion: 76%ile of the past year.
Variance mix — % of total, today vs 1d ago vs 1-yr avg
market 71%ile style 98.8%ile thematic 42%ile idiosyncratic 2.0%ile
Variance explained — today vs. factor's trailing-year range
Marker = the factor's share of today's total variance, placed in its own trailing-year range (box 25–75%ile, ticks 90%ile and max). Amber marker = unusually load-bearing today (≥90%ile of its own year). Factor name green = up today / red = down.
Correlation & dispersion — realized vs implied
Pairwise realized correlation (20d): 8.16% 3.8%ile since 2020 · 44%ile 3m
Top-500 pairwise: 10.60% 8.6%ile since 2020 · 51%ile 3m · implied (Cboe COR1M): 9.21 2.8%ile of its own history (gap +1.4pp)
Realized 20d vol (ann. pts): all stocks 51 vs VIXEQ 38 · index 12 vs VIX 16 · style factors 28 92.9%ile
20-day window (19 completed days + today); percentiles vs model history since 2020; '3m' tokens rank vs the trailing 63 trading days; definitions in Terms below. Implied prints (Cboe) are delayed ~15 min. as of 15:58 ET
Top 50 high-beta momentum names (eq-wt, since-2020 rank): -7.9% 0.8%ile worst since 2026-07-28 · rest of market +0.0%
| Factor | Today | 1d | 5d | 20d | 60d |
|---|---|---|---|---|---|
| Style-Risk | |||||
| Beta | -2.71% z-2.8 | +0.84% | -0.78% | -1.17% | -3.30% |
| International | +0.06% z+0.2 | +0.26% | -0.14% | -0.49% | -1.99% |
| Residual Volatility | -0.04% z-0.1 | -0.12% | +0.59% | +2.05% | -0.58% |
| Style | |||||
| Leverage | -0.20% z-1.2 | -0.14% | -0.04% | -1.84% | -2.73% |
| Size | +0.40% z+1.1 | +0.05% | +0.13% | -0.30% | -1.89% |
| Profitability | -0.10% z-0.5 | +0.14% | +0.20% | -0.96% | -1.19% |
| Value | -0.11% z-0.5 | -0.04% | -0.04% | +0.37% | -0.30% |
| Growth | -0.08% z-0.3 | +0.02% | +0.15% | +1.13% | +3.07% |
| Dividend Yield | +0.04% z+0.2 | +0.18% | +0.65% | -0.23% | -0.78% |
| Liquidity | -0.01% z-0.0 | +0.11% | +1.65% | +0.93% | -1.31% |
| Style-Momentum | |||||
| One-Day Momentum | -0.63% z-2.2 | +0.04% | -1.45% | +0.58% | +1.34% |
| Short-Term Momentum | -0.44% z-1.4 | -0.22% | -1.49% | -5.80% | -7.91% |
| Medium-Term Momentum | +0.28% z+1.0 | -0.01% | -0.34% | +0.70% | +1.60% |
| Long-Term Momentum | -0.63% z-1.0 | +1.28% | +2.05% | -3.05% | -3.51% |
| Style-Positioning | |||||
| Short Interest | +0.33% z+1.9 | -0.16% | -0.35% | -0.67% | +1.11% |
| Hedge-Fund Ownership | +0.11% z+1.0 | +0.10% | +0.16% | -0.12% | +0.33% |
| Style-Flow | |||||
| Morning Activity | +0.20% z+1.6 | +0.08% | +0.15% | +1.30% | +0.55% |
| Short-Sale Activity | +0.03% z+0.3 | +0.16% | +0.30% | +0.57% | +0.53% |
| Thematic | |||||
| Semiconductors | -1.12% z-1.9 | +1.22% | +1.48% | -2.56% | -3.89% |
| Oil | +0.25% z+0.5 | +0.65% | +1.13% | +1.36% | -1.47% |
| Gold | +0.14% z+0.4 | +0.24% | +0.12% | +2.00% | -0.47% |
| Treasury (Duration) | +0.14% z+0.4 | +0.04% | -0.35% | +0.27% | +0.56% |
| China | +0.09% z+0.2 | -0.20% | -0.59% | +0.35% | -3.36% |
| Bitcoin / Crypto | +0.03% z+0.1 | +0.09% | +0.50% | -0.35% | -1.22% |
5/20/60d windows include today's session; 1d is the previous session.
Pairwise realized correlation. Index variance net of the weighted idiosyncratic diagonal, over the cross terms — the estimator used for implied-correlation indices. 20-day window unless noted; history since 2020.
Factor z-score. Today's factor return divided by its daily-return standard deviation over ~1,600 trading days.
High-beta momentum cohort. US names above $2B market cap in the top quintile of both raw beta and 12-month momentum; membership frozen at each month's first business day. “Top 50” = the 50 strongest by combined rank.
Stock-specific (idiosyncratic) return. The part of a stock's move not explained by market, style, or thematic factors in our decomposition.
VIXEQ / DSPX / COR1M. Cboe implied indices: single-stock volatility, dispersion, and 1-month implied correlation (top-50 S&P names). Quotes delayed ~15 minutes.
Data compiled by FactorPulse AI; edited and verified by Jeff Klein. For informational purposes only. Does not constitute financial advice, an investment recommendation, or an offer to buy or sell any securities. Always consult a qualified financial professional before making investment decisions.
For more on factor construction methodology, see www.factorpulse.com/glossary.