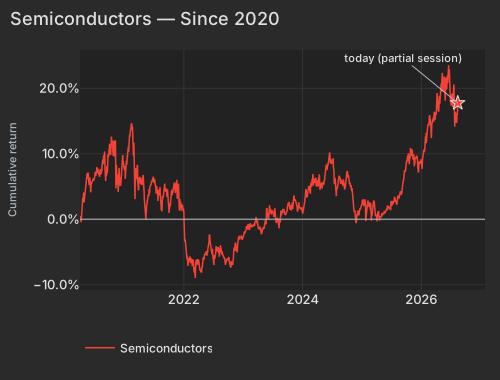
Memory chips did the work in a market that fell. The Semiconductors factor returned +1.23% at z=+2.0 and Long-Term Momentum +1.31% at z=+2.0 while SPY slipped -0.49%. Samsung's share gain landed on a complex whose prior five-day run already sat in the 99.7th percentile since 2020 — and Micron's +4.24% was almost entirely those factor axes rather than anything specific to Micron.
Samsung took 39.4% of global DRAM revenue in the first half of 2026, a 5.4-point year-over-year gain, with memory prices still climbing as capacity shifts toward high-bandwidth memory for AI data centersEconomic Times. That news hit a group already moving: Semiconductors carries z=+2.3 over five days, and the Roundhill Memory ETF (DRAM) rose +5.82% on top of +13.28% over the prior week. Micron added $47.6B of market value; SanDisk gained +8.94%.
| Factor | Return | Z-Score | 5d Z | 20d Z | 63d Z | Category | Direction |
|---|---|---|---|---|---|---|---|
| Semiconductors | +1.23% | z=+2.0 | +2.3 | 0.0 | -0.6 | Thematic | Against the quarter |
| Long-Term Momentum | +1.31% | z=+2.0 | +1.7 | -0.2 | -0.7 | Style-Momentum | 1-yr winners led |
| Oil | +0.62% | z=+1.3 | +0.7 | +0.7 | -0.6 | Thematic | Extends 20-day |
| Dividend Yield | +0.21% | z=+1.2 | +2.1 | +0.2 | -0.3 | Style | Low-payout names lagged |
| Short-Sale Activity | +0.12% | z=+1.1 | +1.5 | +0.8 | +0.4 | Style-Flow | Yesterday's short sales lost T+1 |
| Short Interest | -0.18% | z=-1.1 | -2.1 | -1.6 | +0.5 | Style-Positioning | Persistent drag paying |
| Hedge-Fund Ownership | +0.11% | z=+1.0 | +0.2 | -0.7 | -0.2 | Style-Positioning | HF-owned names led |
| Short-Term Momentum | -0.25% | z=-0.8 | -1.3 | -4.2 | -3.4 | Style-Momentum | Reversion continues |
| Beta | +0.81% | z=+0.8 | +1.1 | +0.9 | -0.0 | Style-Risk | High-beta names led |
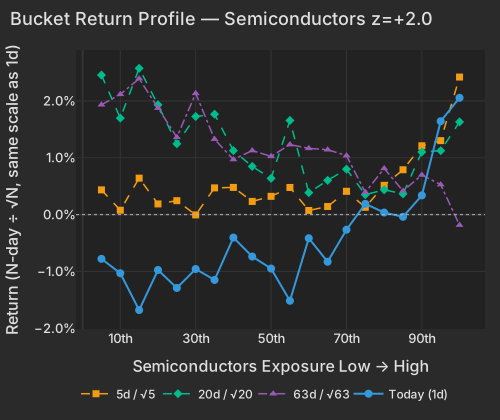
The gain rises steadily with exposure rather than sitting in a handful of names: the most-exposed semiconductor bucket returned +2.06%, with the memory and storage names inside it up +8.65% as a group and the AI and data-center names +6.11%. Long-Term Momentum shows the same shape at its winner end, +2.22%, where a cluster of biotech names (ALMS, KOD, DNTH, ORKA) sat alongside XBI +1.40%.
| Bucket | Ret 1D Pct | Ret 5D Norm Pct | Ret 20D Norm Pct | Ret 63D Norm Pct |
|---|---|---|---|---|
| 1 | -0.78 | 0.44 | 2.46 | 1.93 |
| 2 | -1.03 | 0.08 | 1.70 | 2.12 |
| 3 | -1.68 | 0.64 | 2.57 | 2.39 |
| 4 | -0.97 | 0.19 | 1.93 | 1.87 |
| 5 | -1.29 | 0.25 | 1.25 | 1.36 |
| 6 | -0.96 | -0.00 | 1.73 | 2.13 |
| 7 | -1.15 | 0.47 | 1.77 | 1.33 |
| 8 | -0.40 | 0.48 | 1.13 | 0.97 |
| 9 | -0.74 | 0.23 | 0.85 | 1.13 |
| 10 | -0.95 | 0.32 | 0.64 | 1.02 |
| 11 | -1.52 | 0.48 | 1.66 | 1.23 |
| 12 | -0.42 | 0.07 | 0.39 | 1.17 |
| 13 | -0.83 | 0.14 | 0.60 | 1.14 |
| 14 | -0.27 | 0.41 | 0.80 | 1.04 |
| 15 | 0.19 | 0.13 | 0.35 | 0.39 |
| 16 | 0.04 | 0.52 | 0.44 | 0.81 |
| 17 | -0.04 | 0.79 | 0.37 | 0.42 |
| 18 | 0.34 | 1.21 | 1.10 | 0.70 |
| 19 | 1.64 | 1.30 | 1.12 | 0.53 |
| 20 | 2.06 | 2.42 | 1.63 | -0.18 |
| ETF | Theme | Today | 1d Ago | 5d Ago | 20d Ago | 63d Ago |
|---|---|---|---|---|---|---|
| DRAM | memory chips & storage | +5.82% | +0.69% | +13.28% | +8.73% | +6.56% |
| EWY | south korea | +3.43% | +0.63% | +8.22% | +10.58% | -5.66% |
| USO | oil | +3.14% | +1.26% | +7.31% | +2.13% | -11.47% |
| XOP | oil producers | +1.71% | +0.74% | +8.47% | +6.06% | +6.66% |
| SMH | semiconductors | +1.09% | -0.22% | +0.88% | +5.62% | +1.64% |
| SPY | large cap | -0.49% | -0.20% | +0.40% | +4.45% | +3.77% |
| TLT | long-term bonds | -0.72% | -0.67% | -0.87% | -2.93% | -3.39% |
| XLP | consumer staples | -1.44% | +0.10% | +1.14% | +1.06% | +1.31% |
| BXSL | loans of private companies | -1.84% | -1.32% | +0.57% | +3.61% | +2.36% |
| IGV | software | -1.89% | -2.07% | +1.35% | +12.16% | +14.83% |
DRAM and XOP have both the five-day and the 63-day trend behind them; EWY and USO are still negative over the quarter.
Micron's factor exposures delivered +6.27% today while its own move subtracted -1.66%; SanDisk's factor pieces gave +6.71% against +2.59% of stock-specific return. Long-Term Momentum carried 12.9% of cross-sectional variance and Semiconductors 3.4%, both at the top of their own past-year ranges — the axes the book loads on were unusually load-bearing. Buying the one-year winners and the semiconductor exposure got you the memory trade; name selection inside it did not.
Risk appetite ran with it rather than against it. Beta returned +0.81% and Hedge-Fund Ownership +0.11% at z=+1.0, its more heavily hedge-fund-owned end leading. Short Interest at -0.18% (z=-1.1) had the most-shorted names lagging again — the model's persistent drag paying, with no sign of the shorts being squeezed.
The run is a week old and the quarter has not turned with it. The Semiconductors factor's trailing 63-day return is -2.98%, and its 20-day and 63-day exposure profiles still slope negative: high-exposure names lagged across that window. Short-horizon reversion has been the month's governing pattern, with Short-Term Momentum's trailing 20-day return at -5.80% (z=-4.2) as each week's leaders were faded in turn, and today's -0.25% extends it. A week-old bid sitting inside that pattern is the position most exposed to it.
| Date | Cumret Pct |
|---|---|
| 2020-04-02 | -0.21 |
| 2020-04-27 | 3.58 |
| 2020-05-19 | 6.84 |
| 2020-06-11 | 5.48 |
| 2020-07-06 | 7.21 |
| 2020-07-28 | 6.78 |
| 2020-08-19 | 8.70 |
| 2020-09-11 | 6.58 |
| 2020-10-05 | 10.42 |
| 2020-10-27 | 11.79 |
| 2020-11-18 | 5.39 |
| 2020-12-11 | 5.94 |
| 2021-01-06 | 6.18 |
| 2021-01-29 | 11.39 |
| 2021-02-23 | 11.00 |
| 2021-03-17 | 7.45 |
| 2021-04-09 | 5.93 |
| 2021-05-03 | 4.21 |
| 2021-05-25 | 3.30 |
| 2021-06-17 | 5.85 |
| 2021-07-12 | 5.10 |
| 2021-08-03 | 3.63 |
| 2021-08-25 | 3.39 |
| 2021-09-17 | 4.68 |
| 2021-10-11 | 2.03 |
| 2021-11-02 | 5.21 |
| 2021-11-24 | 3.70 |
| 2021-12-17 | 2.09 |
| 2022-01-11 | -3.11 |
| 2022-02-03 | -6.45 |
| 2022-02-28 | -6.39 |
| 2022-03-22 | -6.17 |
| 2022-04-13 | -7.67 |
| 2022-05-06 | -6.16 |
| 2022-05-31 | -4.42 |
| 2022-06-23 | -4.91 |
| 2022-07-18 | -5.18 |
| 2022-08-09 | -5.72 |
| 2022-08-31 | -5.56 |
| 2022-09-23 | -6.14 |
| 2022-10-17 | -7.15 |
| 2022-11-08 | -4.32 |
| 2022-12-01 | -3.38 |
| 2022-12-23 | -3.12 |
| 2023-01-19 | -1.90 |
| 2023-02-10 | -1.65 |
| 2023-03-07 | -0.93 |
| 2023-03-29 | -0.50 |
| 2023-04-21 | -1.71 |
| 2023-05-15 | -0.88 |
| 2023-06-07 | 0.02 |
| 2023-06-30 | 1.31 |
| 2023-07-25 | 0.11 |
| 2023-08-16 | -0.15 |
| 2023-09-08 | 1.19 |
| 2023-10-02 | 1.71 |
| 2023-10-24 | 2.15 |
| 2023-11-15 | 2.79 |
| 2023-12-08 | 1.94 |
| 2024-01-03 | 1.15 |
| 2024-01-26 | 3.66 |
| 2024-02-20 | 4.12 |
| 2024-03-13 | 5.68 |
| 2024-04-05 | 5.97 |
| 2024-04-29 | 5.53 |
| 2024-05-21 | 6.54 |
| 2024-06-13 | 9.39 |
| 2024-07-09 | 9.17 |
| 2024-07-31 | 4.97 |
| 2024-08-22 | 6.20 |
| 2024-09-16 | 5.04 |
| 2024-10-08 | 6.46 |
| 2024-10-30 | 4.57 |
| 2024-11-21 | 1.11 |
| 2024-12-16 | 0.65 |
| 2025-01-10 | 3.08 |
| 2025-02-04 | 1.69 |
| 2025-02-27 | 0.92 |
| 2025-03-21 | 2.11 |
| 2025-04-14 | 1.07 |
| 2025-05-07 | 0.94 |
| 2025-05-30 | 1.32 |
| 2025-06-24 | 1.50 |
| 2025-07-17 | 2.80 |
| 2025-08-08 | 2.83 |
| 2025-09-02 | 3.81 |
| 2025-09-24 | 7.19 |
| 2025-10-16 | 10.08 |
| 2025-11-07 | 9.81 |
| 2025-12-02 | 9.41 |
| 2025-12-24 | 8.63 |
| 2026-01-20 | 10.64 |
| 2026-02-11 | 14.12 |
| 2026-03-06 | 12.39 |
| 2026-03-30 | 15.15 |
| 2026-04-22 | 16.85 |
| 2026-05-14 | 21.78 |
| 2026-06-08 | 20.68 |
| 2026-07-01 | 19.58 |
| 2026-07-24 | 19.20 |
| 2026-08-17 | 17.75 |
The 30-year Treasury yield rose 5.1 bps to 5.317%, its highest since 2007, with the 10-year at 4.728%CNBCBloomberg. The damage went to software and staples, not to the one-year winners: IGV -1.89%, XLP -1.44%, and XLC -1.90% with Meta -3.53%. Credit-sensitive financials went with them — KKR fell -4.54% on credit concernsEconomic Times, Blackstone Secured Lending -1.84% with its second-quarter net investment income short of its distributionMorningstar, and XLF -0.96% on 2.3× the typical session pace.
The demand behind the memory prices is still being funded at that cost. Anthropic told investors its annualized revenue run rate passed $65B at the end of July, up from $47B in MayBloomberg, and the Microsoft-linked "Project Odyssey" data center bond drew more than $7.8B of orders at junk-level yields, letting the deal upsize to $3.9BBloomberg.
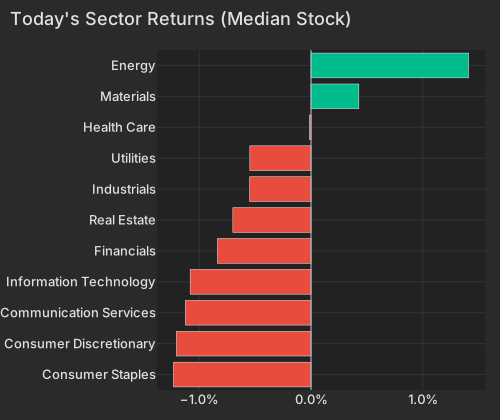
The Oil factor returned +0.62% (z=+1.3), its highest-exposure end up +1.31% and led by exploration and production names (SOC, KOS, NOG, PTEN), with USO +3.14% and XOP +1.71% as Washington signalled no urgency on a deal with IranBloomberg. Energy's median stock rose +1.16% against Communication Services' -1.58%. Dividend Yield's +0.21% came from its other end, where the no-payout consumer names — Caesars, CarMax, Penn — fell about -1.30% as a group alongside XLY -1.22%.
| Sector | Median Ret Pct |
|---|---|
| Consumer Staples | -1.23 |
| Consumer Discretionary | -1.20 |
| Communication Services | -1.12 |
| Information Technology | -1.08 |
| Financials | -0.84 |
| Real Estate | -0.70 |
| Industrials | -0.55 |
| Utilities | -0.55 |
| Health Care | -0.01 |
| Materials | 0.43 |
| Energy | 1.41 |
Underneath the factor story, single names did most of the moving: idiosyncratic return was 69.8% of cross-sectional variance against a 66.4% one-year average, with the market axis explaining just 2.3%. argenx rose +16.16% after Phase 3 ALKIVIA results met their primary endpointsBloomberg, adding $8.6B of market value, and Figure Technology gained +13.28% on marketplace scalingBloomberg. On a day when the index barely mattered, exposure to the winner axes was worth more than a view on any one name.
The question into tomorrow is arithmetic. Memory pricing is resetting the earnings power of a narrow set of names while the discount rate applied to every long-duration asset sits at a 19-year high. Today those two forces landed on entirely different tickers; the semiconductor factor's negative quarter is the reminder that they have landed on the same ones before.
Variance decomposition: live intraday — 20260817 session, bracketed against its trailing-year range. Factor returns are trailing through last close. Total cross-sectional dispersion: 36%ile of the past year.
Variance mix — % of total, today vs 1d ago vs 1-yr avg
market 38%ile style 70%ile thematic 91.6%ile idiosyncratic 39%ile
Variance explained — today vs. factor's trailing-year range
Marker = the factor's share of today's total variance, placed in its own trailing-year range (box 25–75%ile, ticks 90%ile and max). Amber marker = unusually load-bearing today (≥90%ile of its own year). Factor name green = up today / red = down.
| Factor | Today | 1d | 5d | 20d | 60d |
|---|---|---|---|---|---|
| Style-Risk | |||||
| International | +0.28% z+0.9 | -0.05% | -0.41% | -0.38% | -1.91% |
| Beta | +0.81% z+0.8 | +0.31% | +2.38% | +4.02% | +0.55% |
| Residual Volatility | -0.09% z-0.2 | -0.14% | +0.69% | +2.45% | -0.26% |
| Style | |||||
| Dividend Yield | +0.21% z+1.2 | +0.08% | +0.81% | +0.13% | -0.50% |
| Leverage | -0.17% z-1.0 | -0.05% | +0.35% | -1.48% | -2.28% |
| Profitability | +0.16% z+0.9 | -0.09% | +0.28% | -0.82% | -0.99% |
| Liquidity | +0.10% z+0.4 | +0.55% | +1.80% | +1.64% | -0.54% |
| Value | -0.00% z-0.0 | +0.16% | +0.33% | +0.55% | -0.10% |
| Growth | -0.00% z-0.0 | -0.03% | +0.10% | +0.99% | +3.00% |
| Size | +0.00% z+0.0 | -0.32% | -0.69% | -0.88% | -2.49% |
| Style-Momentum | |||||
| Long-Term Momentum | +1.31% z+2.0 | +0.55% | +2.52% | -0.71% | -2.46% |
| Short-Term Momentum | -0.25% z-0.8 | -0.19% | -0.90% | -5.80% | -7.80% |
| Medium-Term Momentum | -0.07% z-0.2 | -0.26% | -0.79% | -0.47% | +1.15% |
| One-Day Momentum | +0.02% z+0.1 | -0.67% | -0.69% | +0.94% | +2.17% |
| Style-Positioning | |||||
| Short Interest | -0.18% z-1.1 | -0.32% | -0.80% | -1.21% | +0.67% |
| Hedge-Fund Ownership | +0.11% z+1.0 | +0.12% | +0.04% | -0.34% | +0.03% |
| Style-Flow | |||||
| Short-Sale Activity | +0.12% z+1.1 | +0.03% | +0.36% | +0.39% | +0.33% |
| Morning Activity | +0.09% z+0.7 | -0.04% | -0.08% | +1.23% | +0.28% |
| Thematic | |||||
| Semiconductors | +1.23% z+2.0 | +0.58% | +3.04% | +0.00% | -2.27% |
| Oil | +0.62% z+1.3 | +0.28% | +0.71% | +1.53% | -1.66% |
| Gold | +0.31% z+1.0 | +0.02% | +0.03% | +2.15% | -0.78% |
| China | -0.19% z-0.5 | -0.46% | -0.67% | +0.13% | -3.39% |
| Bitcoin / Crypto | +0.13% z+0.4 | -0.07% | +0.26% | +0.01% | -0.79% |
| Treasury (Duration) | +0.05% z+0.1 | +0.04% | -0.36% | +0.29% | +0.30% |
5/20/60d windows include today's session; 1d is the previous session.
Market variance share. The fraction of cross-sectional variance explained by the market factor — the attribution companion to pairwise correlation, not a substitute for it.
Factor z-score. Today's factor return divided by its daily-return standard deviation over ~1,600 trading days.
Stock-specific (idiosyncratic) return. The part of a stock's move not explained by market, style, or thematic factors in our decomposition.
Data compiled by FactorPulse AI; edited and verified by Jeff Klein. For informational purposes only. Does not constitute financial advice, an investment recommendation, or an offer to buy or sell any securities. Always consult a qualified financial professional before making investment decisions.
For more on factor construction methodology, see www.factorpulse.com/glossary.