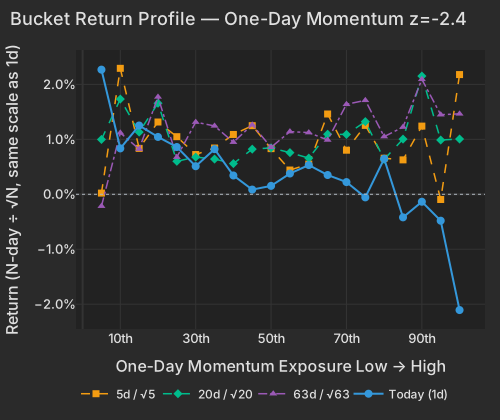
The cross-section spent Friday trading its own one-day memory: names sold Thursday were bought back and Thursday's gainers were given up, at a spread ranking in the bottom 1.3% of sessions since 2020. The macro that owned the headlines — a 0.6% drop in July retail sales, a 25-year high in long-bond funding costs — left almost no fingerprint on the factor structure, with the Treasury (Duration) factor at z=+0.09. What actually moved money was single names: Broadcom erased $118.1 billion, Reddit added $4.0 billion.
One-Day Momentum ran -0.67% at z=-2.4 — Thursday's most-punished names rose +2.27% as a group while Thursday's biggest gainers fell -2.11%. That spread carried 5.0% of the day's cross-sectional variance, a top-decile share for this factor against its own past year, and it did more work than anything on the calendar.
| Factor | Return | Z-Score | 5d Z | 20d Z | 63d Z | Category | Direction |
|---|---|---|---|---|---|---|---|
| One-Day Momentum | -0.67% | -2.35 | -1.16 | +0.52 | +1.30 | Style-Momentum | Thursday's losers bounced, Thursday's gainers sold |
| Liquidity | +0.55% | +1.97 | +2.39 | +1.87 | -0.17 | Style | Highest-turnover names led |
| Short Interest | -0.33% | -1.96 | -1.28 | -1.73 | +0.68 | Style-Positioning | Most-shorted names lagged the un-shorted |
| China | -0.44% | -1.08 | -0.51 | +0.35 | -1.12 | Thematic | China-revenue names lagged |
| Semiconductors | +0.58% | +0.96 | +1.20 | -0.39 | -1.10 | Thematic | Top-exposure bucket led, memory carrying it |
| Hedge-Fund Ownership | +0.09% | +0.85 | -0.57 | -1.04 | -0.33 | Style-Positioning | Hedge-fund-owned names modestly ahead |
| Short-Sale Activity | +0.05% | +0.47 | +0.74 | +0.48 | +0.39 | Style-Flow | Heavily short-sold names outperformed T+1 |
| Bucket | Ret 1D Pct | Ret 5D Norm Pct | Ret 20D Norm Pct | Ret 63D Norm Pct |
|---|---|---|---|---|
| 1 | 2.27 | 0.02 | 1.00 | -0.22 |
| 2 | 0.84 | 2.29 | 1.73 | 1.12 |
| 3 | 1.25 | 0.84 | 1.13 | 0.82 |
| 4 | 1.04 | 1.32 | 1.66 | 1.77 |
| 5 | 0.86 | 1.05 | 0.60 | 0.68 |
| 6 | 0.51 | 0.72 | 0.68 | 1.31 |
| 7 | 0.82 | 0.84 | 0.64 | 1.24 |
| 8 | 0.34 | 1.09 | 0.56 | 0.95 |
| 9 | 0.09 | 1.25 | 0.82 | 1.27 |
| 10 | 0.15 | 0.83 | 0.84 | 0.86 |
| 11 | 0.38 | 0.44 | 0.76 | 1.14 |
| 12 | 0.53 | 0.55 | 0.66 | 1.12 |
| 13 | 0.35 | 1.46 | 1.09 | 0.99 |
| 14 | 0.22 | 0.80 | 1.09 | 1.64 |
| 15 | -0.06 | 1.25 | 1.32 | 1.71 |
| 16 | 0.65 | 0.66 | 0.64 | 1.05 |
| 17 | -0.42 | 0.63 | 1.00 | 1.22 |
| 18 | -0.14 | 1.24 | 2.15 | 2.09 |
| 19 | -0.48 | -0.09 | 0.99 | 1.45 |
| 20 | -2.11 | 2.18 | 1.01 | 1.46 |
July retail sales fell -0.6% against a +0.1% consensusBloombergCENSUS, and the long end went up anyway — the 30-year at 5.257%, up 4.6 basis points, the 10-year at 4.688%CNBC. Thursday's $25 billion auction had already cleared at 5.216%, the highest in 25 yearsBloomberg. None of it registered as a duration event in the cross-section: the Treasury (Duration) factor sits at z=+0.09 and Value at z=+0.65, both inert. Long-duration software took the sharpest single-day hit regardless, with IGV -2.03% interrupting a +13.43% 20-day run, while energy and the gold miners carried the other end on Iran-driven crude strengthBloomberg. The dollar index at 99.645, -0.32%, helpedCNBC.
| ETF | Theme | Session | 1d Ago | 5d Ago | 20d Ago | 63d Ago |
|---|---|---|---|---|---|---|
| IGV | software | -2.03% | +3.10% | +6.90% | +13.43% | +19.95% |
| ARKK | innovation growth | -1.84% | +1.50% | +9.06% | +7.72% | +5.82% |
| TLT | long-term bonds | -0.68% | +0.58% | +0.08% | -1.92% | -2.61% |
| XLK | technology | -0.45% | +1.01% | +2.94% | +7.46% | +7.87% |
| SMH | semiconductors | -0.23% | +0.73% | +3.09% | +3.55% | +2.91% |
| DRAM | memory chips & storage | +0.70% | +3.89% | +10.67% | +8.77% | +4.38% |
| XLE | energy | +1.39% | +0.05% | +4.99% | +7.09% | +5.95% |
| XAR | defense | +1.54% | -0.42% | +3.25% | +12.75% | +8.14% |
| GDX | gold miners | +1.89% | -2.96% | +5.18% | +23.63% | -8.27% |
| WGMI | crypto miners | +2.76% | -4.00% | -2.37% | -1.64% | -19.65% |
Under a flat index — SPY -0.20% — the risk-seeking pockets were bid. Short Interest ran -0.33% at z=-2.0 with the barely-shorted bucket up +1.66%: the most-shorted names lagged again, the model's most persistent drag paying, and its 20-day z of -1.73 says that has been the pattern for weeks. Liquidity ran +0.55% at z=+2.0, driven entirely by its top bucket at +2.08% — the most heavily traded, most optionable names, where the crypto miners sat: WGMI +2.76% against BITO -0.76%, a bid in the equities and not the coin. The top 50 high-beta momentum names ran +2.36% against +0.05% for the rest of the universe, with the buying concentrated hard in the names that fit that profile most closely. This is the same complex that produced July's forced liquidation of Leopold Aschenbrenner's $45 billion Situational Awareness fund after a 40% drop in its AI-hardware bookWSJ.
The weekly lookback has been the one churning. Short-Term Momentum's completed 20-day return of -5.70% ranks in the bottom 0.2% of all 20-day windows since 2020, at z=-4.1, and today it added only -0.19%. One-Day Momentum's own three-month z is +1.30 — at the daily lookback the pattern since May has been continuation, and the factor's realized baseline at that horizon is weak enough that a single print is a diagnostic, not a regime. Today the churn reached down from the weekly clock to the daily one. The volatility configuration around it: implied index volatility at 14.28, down 31% from its July 29 high of 20.66, with implied single-stock volatility still at 36.43, the 75th percentile of its own history — the calm is in the index, not the names.
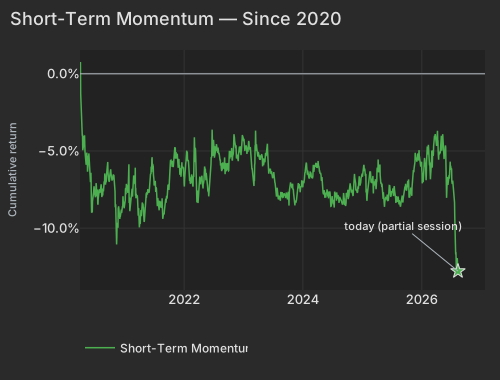
| Date | Cumret Pct |
|---|---|
| 2020-04-01 | 0.05 |
| 2020-04-24 | -4.02 |
| 2020-05-18 | -6.35 |
| 2020-06-10 | -8.26 |
| 2020-07-02 | -7.74 |
| 2020-07-27 | -7.85 |
| 2020-08-18 | -7.76 |
| 2020-09-10 | -6.69 |
| 2020-10-02 | -6.41 |
| 2020-10-26 | -6.57 |
| 2020-11-17 | -9.70 |
| 2020-12-10 | -8.79 |
| 2021-01-05 | -8.19 |
| 2021-01-28 | -8.37 |
| 2021-02-22 | -6.96 |
| 2021-03-16 | -7.90 |
| 2021-04-08 | -9.21 |
| 2021-04-30 | -9.60 |
| 2021-05-24 | -7.47 |
| 2021-06-16 | -6.38 |
| 2021-07-09 | -7.37 |
| 2021-08-02 | -8.85 |
| 2021-08-24 | -9.40 |
| 2021-09-16 | -7.90 |
| 2021-10-08 | -5.86 |
| 2021-11-01 | -5.64 |
| 2021-11-23 | -5.49 |
| 2021-12-16 | -6.22 |
| 2022-01-10 | -6.07 |
| 2022-02-02 | -6.53 |
| 2022-02-25 | -7.31 |
| 2022-03-21 | -8.33 |
| 2022-04-12 | -7.00 |
| 2022-05-05 | -6.69 |
| 2022-05-27 | -7.55 |
| 2022-06-22 | -4.73 |
| 2022-07-15 | -4.82 |
| 2022-08-08 | -5.27 |
| 2022-08-30 | -6.10 |
| 2022-09-22 | -6.02 |
| 2022-10-14 | -5.01 |
| 2022-11-07 | -3.97 |
| 2022-11-30 | -5.64 |
| 2022-12-22 | -4.68 |
| 2023-01-18 | -4.64 |
| 2023-02-09 | -4.91 |
| 2023-03-06 | -7.18 |
| 2023-03-28 | -4.90 |
| 2023-04-20 | -5.42 |
| 2023-05-12 | -5.51 |
| 2023-06-06 | -6.04 |
| 2023-06-29 | -6.71 |
| 2023-07-24 | -7.75 |
| 2023-08-15 | -8.04 |
| 2023-09-07 | -7.88 |
| 2023-09-29 | -8.13 |
| 2023-10-23 | -7.27 |
| 2023-11-14 | -8.30 |
| 2023-12-07 | -7.14 |
| 2024-01-02 | -7.31 |
| 2024-01-25 | -5.81 |
| 2024-02-16 | -6.33 |
| 2024-03-12 | -6.29 |
| 2024-04-04 | -6.05 |
| 2024-04-26 | -6.94 |
| 2024-05-20 | -7.86 |
| 2024-06-12 | -7.64 |
| 2024-07-08 | -8.31 |
| 2024-07-30 | -7.68 |
| 2024-08-21 | -8.08 |
| 2024-09-13 | -8.12 |
| 2024-10-07 | -7.51 |
| 2024-10-29 | -7.61 |
| 2024-11-20 | -7.10 |
| 2024-12-13 | -6.95 |
| 2025-01-08 | -6.60 |
| 2025-02-03 | -7.87 |
| 2025-02-26 | -7.05 |
| 2025-03-20 | -7.01 |
| 2025-04-11 | -5.77 |
| 2025-05-06 | -7.44 |
| 2025-05-29 | -8.14 |
| 2025-06-23 | -7.72 |
| 2025-07-16 | -7.66 |
| 2025-08-07 | -8.24 |
| 2025-08-29 | -8.32 |
| 2025-09-23 | -7.30 |
| 2025-10-15 | -6.84 |
| 2025-11-06 | -7.06 |
| 2025-12-01 | -5.50 |
| 2025-12-23 | -5.58 |
| 2026-01-16 | -5.93 |
| 2026-02-10 | -5.23 |
| 2026-03-05 | -5.52 |
| 2026-03-27 | -3.90 |
| 2026-04-21 | -5.12 |
| 2026-05-13 | -3.91 |
| 2026-06-05 | -8.04 |
| 2026-06-30 | -6.23 |
| 2026-07-23 | -7.87 |
| 2026-08-14 | -12.79 |
Broadcom closed the session -6.15%, erasing $118.1 billion, after reports that a critical VMware vCenter vulnerability is being actively exploited alongside institutional sellingBloomberg. Applied Materials fell -5.13% and $21.5 billion despite beating on revenue and guiding fourth-quarter sales above consensus, with the margin profile the sticking pointBloomberg. AMD went the other way, +6.49% and $51.2 billion added, almost none of it explained by the factor complex. The Semiconductors factor was positive through all of that, +0.58% at z=+0.96, because its top-exposure bucket at +2.37% is being carried by memory rather than large-cap logic — DRAM +0.70% on the session and +10.67% over five days, with SanDisk's pivot to long-term contracted supply the week's catalystMarketWatch and SK Hynix's $720 billion buildout the structural frame behind itCNBC.
The rest of the sweep was idiosyncratic in every direction. Reddit closed +12.55%, adding $4.0 billion, on its August 18 entry into the S&P 500 in place of AvalonBayCNBC. Nu Holdings rose +9.20% after its first billion-dollar quarterly profitCNBC. HeartFlow closed +35.79% on its Q2 report, then gave back -1.24% in late trading. Unusual Machines closed +25.21% as the White House announced 100% tariffs on imported drones, the same headline that took XAR +1.54% on 3.4× the typical session paceBloomberg. On the other side, Dillard's -8.77% and Viking Holdings -7.95% were the consumer casualties — but both moves are the stocks' own, not a discretionary factor being repriced.
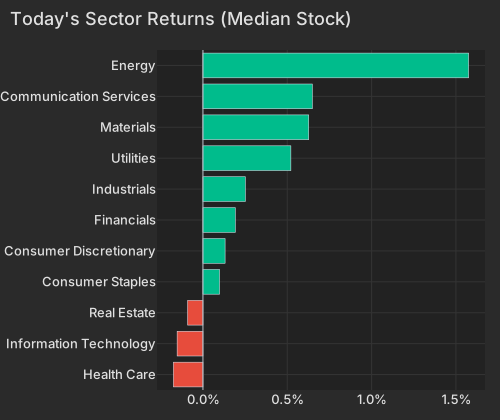
| Sector | Median Ret Pct |
|---|---|
| Health Care | -0.18 |
| Information Technology | -0.15 |
| Real Estate | -0.09 |
| Consumer Staples | 0.10 |
| Consumer Discretionary | 0.13 |
| Financials | 0.19 |
| Industrials | 0.25 |
| Utilities | 0.52 |
| Materials | 0.63 |
| Communication Services | 0.65 |
| Energy | 1.58 |
That is the read worth carrying into next week: 81.0% of today's cross-sectional variance was stock-specific against a 66.3% one-year average, and the market factor accounted for 0.4% of it, an 11th-percentile session since 2020. Trailing-20-day realized pairwise correlation of 8.22%, the 3.8th percentile since 2020, has been sitting near these levels for weeks. A book hedged at the index level is not hedged at all in this configuration — the payoff is in what each name did on its own, and the only cross-sectional axis reliably taking money off one side and putting it on the other is the day-old one.
Advance Retail Sales, released at 8:30 AM ET, showed July sales down -0.6% to $763.6 billion against a +0.1% consensus, the sharpest monthly decline since May 2025, with core spending excluding autos and gas off -0.2%CENSUS. The preliminary Michigan Consumer data.sca.isr.umich.edu Survey, released at 10:00 AM ET, fell to 68.4 from 70.1 and below the 71.0 consensus, with year-ahead inflation expectations unchanged at 2.9%Bloomberg. The New York Fed Staff Nowcast, published at 12:45 PM ET, trimmed Q3 GDP bea.gov to 2.1% from 2.2%, citing the retail sales contraction as the driver.
Variance decomposition: live intraday — 20260814 session, bracketed against its trailing-year range. Factor returns are trailing through last close. Total cross-sectional dispersion: 20%ile of the past year.
Variance mix — % of total, today vs 1d ago vs 1-yr avg
market 19%ile style 53%ile thematic 41%ile idiosyncratic 73%ile
Variance explained — today vs. factor's trailing-year range
Marker = the factor's share of today's total variance, placed in its own trailing-year range (box 25–75%ile, ticks 90%ile and max). Amber marker = unusually load-bearing today (≥90%ile of its own year). Factor name green = up today / red = down.
Correlation & dispersion — realized vs implied
Pairwise realized correlation (20d): 8.22% 3.8%ile since 2020 · 48%ile 3m
Top-500 pairwise: 10.55% 8.6%ile since 2020 · 54%ile 3m · implied (Cboe COR1M): 7.41 1.0%ile of its own history (gap +3.1pp)
Realized 20d vol (ann. pts): all stocks 51 vs VIXEQ 36 · index 12 vs VIX 14 · style factors 28 93.2%ile
20-day window (19 completed days + today); percentiles vs model history since 2020; '3m' tokens rank vs the trailing 63 trading days; definitions in Terms below. Implied prints (Cboe) are delayed ~15 min. as of 15:58 ET
Top 50 high-beta momentum names (eq-wt, since-2020 rank): +2.4% 81%ile · rest of market +0.1%
| Factor | Today | 1d | 5d | 20d | 60d |
|---|---|---|---|---|---|
| Style-Risk | |||||
| Beta | +0.30% z+0.3 | -0.29% | +0.42% | +3.31% | +1.83% |
| Residual Volatility | -0.14% z-0.3 | +0.71% | +1.17% | +3.00% | -0.44% |
| International | -0.01% z-0.0 | -0.21% | -0.50% | -0.66% | -2.08% |
| Style | |||||
| Liquidity | +0.55% z+2.0 | +0.46% | +1.48% | +2.31% | -0.94% |
| Size | -0.31% z-0.9 | +0.05% | -0.35% | -0.70% | -2.96% |
| Value | +0.15% z+0.7 | +0.07% | +0.38% | +0.56% | -0.05% |
| Dividend Yield | +0.10% z+0.6 | +0.14% | +0.45% | -0.05% | -0.64% |
| Profitability | -0.08% z-0.4 | +0.10% | -0.40% | -0.95% | -1.20% |
| Leverage | -0.06% z-0.3 | -0.01% | +0.01% | -1.49% | -2.07% |
| Growth | -0.02% z-0.1 | +0.21% | +0.42% | +1.13% | +2.85% |
| Style-Momentum | |||||
| One-Day Momentum | -0.67% z-2.4 | -0.24% | -0.73% | +0.66% | +2.25% |
| Medium-Term Momentum | -0.26% z-0.9 | -0.17% | -0.25% | -0.54% | +1.03% |
| Long-Term Momentum | +0.57% z+0.9 | -0.30% | +1.51% | -2.07% | -3.99% |
| Short-Term Momentum | -0.19% z-0.6 | -0.31% | -0.62% | -5.70% | -7.77% |
| Style-Positioning | |||||
| Short Interest | -0.33% z-2.0 | +0.07% | -0.48% | -1.31% | +0.89% |
| Hedge-Fund Ownership | +0.09% z+0.8 | -0.09% | -0.14% | -0.52% | -0.26% |
| Style-Flow | |||||
| Short-Sale Activity | +0.05% z+0.5 | +0.02% | +0.18% | +0.24% | +0.38% |
| Morning Activity | -0.00% z-0.0 | -0.00% | +0.27% | +1.17% | +0.14% |
| Thematic | |||||
| China | -0.44% z-1.1 | +0.35% | -0.46% | +0.64% | -3.46% |
| Semiconductors | +0.58% z+1.0 | -0.35% | +1.62% | -1.06% | -3.24% |
| Oil | +0.31% z+0.6 | -0.15% | +1.29% | +1.45% | -3.13% |
| Bitcoin / Crypto | -0.06% z-0.2 | +0.41% | +0.26% | +0.19% | -1.15% |
| Gold | +0.04% z+0.1 | -0.13% | +0.35% | +1.99% | -1.34% |
| Treasury (Duration) | +0.03% z+0.1 | -0.30% | -0.32% | -0.18% | +0.63% |
5/20/60d windows include today's session; 1d is the previous session.
Pairwise realized correlation. Index variance net of the weighted idiosyncratic diagonal, over the cross terms — the estimator used for implied-correlation indices. 20-day window unless noted; history since 2020.
Factor z-score. Today's factor return divided by its daily-return standard deviation over ~1,600 trading days.
High-beta momentum cohort. US names above $2B market cap in the top quintile of both raw beta and 12-month momentum; membership frozen at each month's first business day. “Top 50” = the 50 strongest by combined rank.
Stock-specific (idiosyncratic) return. The part of a stock's move not explained by market, style, or thematic factors in our decomposition.
Data compiled by FactorPulse AI; edited and verified by Jeff Klein. For informational purposes only. Does not constitute financial advice, an investment recommendation, or an offer to buy or sell any securities. Always consult a qualified financial professional before making investment decisions.
For more on factor construction methodology, see www.factorpulse.com/glossary.