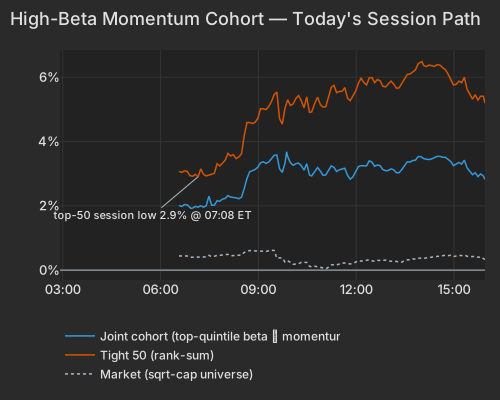
A benign July CPI print and two AI-infrastructure beats sent the most damaged high-beta names vertical: the top 50 high-beta momentum names ran +5.33% into the close, a 97.5th-percentile day since 2020, while everything outside the screen went nowhere at -0.13%. CoreWeave and Nebius supplied the fundamental news; the inflation data supplied the permission. The character of the day is the concentration — the closer a name sat to the high-beta momentum profile, the harder it ran.
CoreWeave closed +19.55% after reporting second-quarter revenue of $2.58B and a $104.2B backlogBloomberg, and Nebius closed +33.98% on revenue of $582.3M, more than four times last year'sEconomic Times. Both were their own stories — Nebius's stock-specific component was the biggest of its trailing year — but the read-through was factor-wide. Lumentum closed +13.72%, Micron gained +4.95%, Nvidia +2.97%.
| Factor | Return | Z-Score | 5d Z | 20d Z | 63d Z | Category | Direction |
|---|---|---|---|---|---|---|---|
| Liquidity | +0.62% | z=+2.3 | +0.95 | +0.76 | -0.55 | Style | Highest-turnover names led |
| Leverage | +0.36% | z=+2.1 | -0.80 | -1.97 | -1.62 | Style | Levered balance sheets led |
| Semiconductors | +1.16% | z=+1.9 | +1.01 | -0.59 | -1.04 | Thematic | Chip exposure led |
| Long-Term Momentum | +1.21% | z=+1.9 | +0.37 | -0.91 | -0.95 | Style-Momentum | One-year winners led |
| Beta | +1.13% | z=+1.2 | +0.4 | -0.0 | -0.2 | Style-Risk | High-beta led |
| Short Interest | -0.25% | z=-1.5 | -1.03 | -0.94 | +0.93 | Style-Positioning | Most-shorted names lagged |
| China | -0.45% | z=-1.1 | +0.18 | +0.23 | -0.98 | Thematic | China revenue lagged |
| Short-Term Momentum | -0.30% | z=-1.0 | +0.78 | -3.71 | -3.15 | Style-Momentum | Last week's leaders faded |
The concentration is the finding. The top 50 names moved 1.84 times the broader high-beta momentum group, far above the usual proportion — the better a name fit the profile, the harder it ran. That group came into the session badly damaged: as of last night's close the broader cohort sat 14.8% below its high. Leverage is the same picture from another angle — levered balance sheets gained +0.36% at z=+2.1 against a 20-day z of -2.0, reversing the sustained selling of levered names that ran through late July and early August.
| Series | Ret Pct |
|---|---|
| joint | 2.89 |
| tight50 | 5.33 |
| market | 0.34 |
| rest | -0.13 |
A PM reading the factor line alone would count four independent confirmations today. There are not four. Long-Term Momentum's stock-level exposures correlate 0.58 with the high-beta momentum screen and Beta's 0.56, with Residual Volatility at 0.42 and Liquidity at 0.27 — these prints are the same names appearing under different labels, not corroboration from separate corners of the cross-section. The one genuinely independent signal is Liquidity at z=+2.3: the highest-turnover, most heavily optioned names outperformed the lowest-turnover end, which at this extreme reads as options and hedging flow into the most tradeable names rather than anything fundamental.
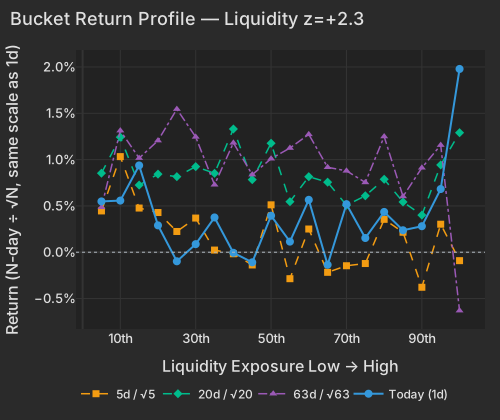
| Bucket | Ret 1D Pct | Ret 5D Norm Pct | Ret 20D Norm Pct | Ret 63D Norm Pct |
|---|---|---|---|---|
| 1 | 0.55 | 0.45 | 0.85 | 0.49 |
| 2 | 0.56 | 1.03 | 1.24 | 1.31 |
| 3 | 0.94 | 0.48 | 0.73 | 1.02 |
| 4 | 0.29 | 0.43 | 0.84 | 1.21 |
| 5 | -0.10 | 0.22 | 0.82 | 1.55 |
| 6 | 0.09 | 0.37 | 0.92 | 1.24 |
| 7 | 0.38 | 0.02 | 0.85 | 0.73 |
| 8 | -0.01 | -0.02 | 1.33 | 1.18 |
| 9 | -0.11 | -0.14 | 0.78 | 0.84 |
| 10 | 0.39 | 0.51 | 1.18 | 1.01 |
| 11 | 0.11 | -0.29 | 0.55 | 1.13 |
| 12 | 0.57 | 0.25 | 0.82 | 1.27 |
| 13 | -0.14 | -0.22 | 0.76 | 0.92 |
| 14 | 0.52 | -0.15 | 0.51 | 0.88 |
| 15 | 0.15 | -0.12 | 0.61 | 0.75 |
| 16 | 0.44 | 0.36 | 0.79 | 1.25 |
| 17 | 0.24 | 0.22 | 0.54 | 0.60 |
| 18 | 0.28 | -0.38 | 0.40 | 0.91 |
| 19 | 0.68 | 0.30 | 0.94 | 1.16 |
| 20 | 1.98 | -0.09 | 1.29 | -0.63 |
Application software funded the buying. IGV fell -0.89% on 1.5× its typical session pace, against +10.99% over 20 sessions — money moving from the software layer into the compute layerBloomberg. Home Depot closed -3.03%, nearly all of it the stock's own move, after saying CEO Ted Decker is taking a temporary medical leaveNYT. Homebuilders went the other way from the front end: ITB fell -2.07% with the 30-Year Treasury at 5.25%, up 1.8bp, even as the 2-Year slipped to 4.20%CNBC. China exposure lagged at -0.45%, z=-1.1, with KWEB -1.94% on 2.2× the typical pace.
| ETF | Theme | Today | 1d Ago | 5d Ago | 20d Ago | 63d Ago |
|---|---|---|---|---|---|---|
| DRAM | memory chips & storage | +7.78% | +2.60% | -7.29% | -16.89% | -7.61% |
| WGMI | crypto miners | +6.79% | +2.44% | -11.60% | -10.72% | -20.25% |
| EWY | south korea | +5.21% | +2.53% | -2.28% | -5.50% | -13.28% |
| SMH | semiconductors | +2.10% | +0.62% | -0.48% | -4.56% | -0.59% |
| MTUM | momentum | +2.16% | +0.33% | -1.60% | -3.57% | +0.55% |
| IGV | software | -0.89% | -1.04% | +1.88% | +10.99% | +14.59% |
| ITB | homebuilders | -2.07% | +2.14% | +1.02% | +3.47% | +9.85% |
| KWEB | china | -1.94% | -3.54% | -2.77% | +7.30% | -5.07% |
| VXX | volatility | -2.70% | -0.79% | -5.74% | -6.79% | -29.58% |
Energy sat the day out. XLE added +0.10% after +4.12% over five sessions, with Brent having touched $90 on August 11 amid the U.S.-Iran stalemateNYT, even as Pakistan's defense minister said the two sides were nearing an arrangement over the Strait of HormuzBloomberg.
Short-Term Momentum lost -0.30% today and has a 20-day z of -3.71 and a 63-day z of -3.15; its completed 20-day cumulative return through last night was -5.17%, inside the bottom 1% of all 20-day windows since 2020. That basket rebuilds from the prior week's leaders every session, so a run that deep means each successive week's winners got sold in turn. Today's buyers went for names that had already crashed, not for last week's leaders — which is why the beaten-up end ripped while the short-horizon trend factor stayed negative.
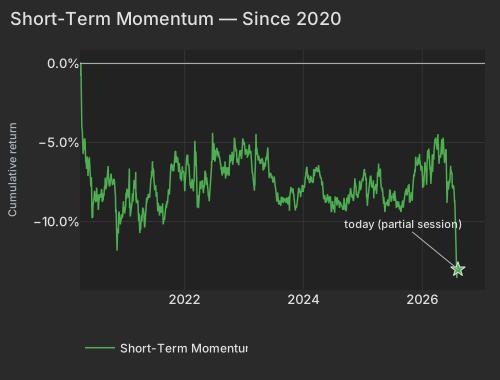
| Date | Cumret Pct |
|---|---|
| 2020-03-30 | 0.09 |
| 2020-04-22 | -5.49 |
| 2020-05-14 | -6.33 |
| 2020-06-08 | -7.19 |
| 2020-06-30 | -8.51 |
| 2020-07-23 | -8.76 |
| 2020-08-14 | -8.54 |
| 2020-09-08 | -7.63 |
| 2020-09-30 | -7.65 |
| 2020-10-22 | -7.31 |
| 2020-11-13 | -11.33 |
| 2020-12-08 | -9.88 |
| 2020-12-31 | -8.96 |
| 2021-01-26 | -7.51 |
| 2021-02-18 | -8.73 |
| 2021-03-12 | -8.55 |
| 2021-04-06 | -10.41 |
| 2021-04-28 | -9.84 |
| 2021-05-20 | -8.61 |
| 2021-06-14 | -6.79 |
| 2021-07-07 | -7.85 |
| 2021-07-29 | -9.29 |
| 2021-08-20 | -9.08 |
| 2021-09-14 | -9.01 |
| 2021-10-06 | -7.03 |
| 2021-10-28 | -6.50 |
| 2021-11-19 | -5.96 |
| 2021-12-14 | -7.45 |
| 2022-01-06 | -7.38 |
| 2022-01-31 | -7.40 |
| 2022-02-23 | -7.81 |
| 2022-03-17 | -8.21 |
| 2022-04-08 | -7.44 |
| 2022-05-03 | -7.76 |
| 2022-05-25 | -7.66 |
| 2022-06-17 | -6.18 |
| 2022-07-13 | -5.85 |
| 2022-08-04 | -5.90 |
| 2022-08-26 | -6.59 |
| 2022-09-20 | -7.00 |
| 2022-10-12 | -5.92 |
| 2022-11-03 | -5.05 |
| 2022-11-28 | -6.02 |
| 2022-12-20 | -5.82 |
| 2023-01-13 | -5.67 |
| 2023-02-07 | -5.53 |
| 2023-03-02 | -7.43 |
| 2023-03-24 | -5.55 |
| 2023-04-18 | -6.13 |
| 2023-05-10 | -6.34 |
| 2023-06-02 | -6.91 |
| 2023-06-27 | -7.20 |
| 2023-07-20 | -8.37 |
| 2023-08-11 | -8.72 |
| 2023-09-05 | -8.76 |
| 2023-09-27 | -8.58 |
| 2023-10-19 | -7.81 |
| 2023-11-10 | -8.75 |
| 2023-12-05 | -8.16 |
| 2023-12-28 | -7.93 |
| 2024-01-23 | -6.86 |
| 2024-02-14 | -7.27 |
| 2024-03-08 | -6.90 |
| 2024-04-02 | -6.84 |
| 2024-04-24 | -7.35 |
| 2024-05-16 | -8.76 |
| 2024-06-10 | -8.85 |
| 2024-07-03 | -8.99 |
| 2024-07-26 | -8.62 |
| 2024-08-19 | -8.82 |
| 2024-09-11 | -8.83 |
| 2024-10-03 | -8.58 |
| 2024-10-25 | -8.28 |
| 2024-11-18 | -7.49 |
| 2024-12-11 | -7.94 |
| 2025-01-06 | -7.19 |
| 2025-01-30 | -8.87 |
| 2025-02-24 | -7.29 |
| 2025-03-18 | -7.76 |
| 2025-04-09 | -7.16 |
| 2025-05-02 | -8.11 |
| 2025-05-27 | -8.81 |
| 2025-06-18 | -8.02 |
| 2025-07-14 | -8.57 |
| 2025-08-05 | -9.03 |
| 2025-08-27 | -9.32 |
| 2025-09-19 | -8.26 |
| 2025-10-13 | -7.97 |
| 2025-11-04 | -8.68 |
| 2025-11-26 | -6.04 |
| 2025-12-19 | -6.16 |
| 2026-01-14 | -7.52 |
| 2026-02-06 | -5.49 |
| 2026-03-03 | -6.96 |
| 2026-03-25 | -4.87 |
| 2026-04-17 | -6.34 |
| 2026-05-11 | -5.08 |
| 2026-06-03 | -7.29 |
| 2026-06-26 | -6.59 |
| 2026-07-21 | -8.41 |
| 2026-08-12 | -13.02 |
The index barely participated in any of it. The market component explained 1.8% of today's cross-sectional variance against a 23.2% style share and 72.6% idiosyncratic — implied single-stock correlation (Cboe COR1M) at 7.75 remains near the bottom of its roughly 20-year history, where it has been pinned for weeks. Implied index volatility (Cboe VIX) at 14.41 is down 30% from its 20-session high of 20.66 on July 29, while implied single-stock volatility (Cboe VIXEQ) at 37.65 still ranks in the 79th percentile of its own record. Calm index, loud single stocks.
Two things argue against reading today as a broad re-risking. In yesterday's session the high-beta momentum names traded on light volume — prices moved more than shares changed hands — and the top 50 carry a retail-heavy morning-activity tilt of +1.13σ, so the buyer is not attributed by our positioning lenses. And the most-shorted names lagged the barely-shorted at z=-1.5, the model's most persistent drag paying as usual; H&R Block, which carries a +3.1σ short-interest exposure, was the exception, closing +15.99% on its results before giving back -2.02% in late trading.
Two large moves are still looking for an explanation. Dell closed +9.74% with roughly two-thirds of the move its own and no story in today's coverage. And Cisco closed the regular session +2.78% and added a further +3.23% after the bell on a fiscal Q4 report that put FY2027 AI revenue guidance at $7.5 billionBloomberg — the same read-through arriving a session late, into names that never crashed in the first place.
The Consumer Price Index bls.gov, released at 8:30 AM ET, showed headline prices up 0.1% in July and 3.4% year over year, with core at 0.2% monthly and 2.5% annually — the energy index fell 1.5% on the month even as it remains 14.7% higher over twelve monthsBLS. Analysts described the print as benign, easing the pressure on the Federal Reserve as it weighs a rate increase, with falling energy prices doing most of the dampeningNYT.
Variance decomposition: live intraday — 20260812 session, bracketed against its trailing-year range. Factor returns are trailing through last close. Total cross-sectional dispersion: 56%ile of the past year.
Variance mix — % of total, today vs 1d ago vs 1-yr avg
market 33%ile style 75%ile thematic 51%ile idiosyncratic 42%ile
Variance explained — today vs. factor's trailing-year range
Marker = the factor's share of today's total variance, placed in its own trailing-year range (box 25–75%ile, ticks 90%ile and max). Amber marker = unusually load-bearing today (≥90%ile of its own year). Factor name green = up today / red = down.
Correlation & dispersion — realized vs implied
Pairwise realized correlation (20d): 7.88% 3.0%ile since 2020 · 40%ile 3m
Top-500 pairwise: 10.43% 8.3%ile since 2020 · 51%ile 3m · implied (Cboe COR1M): 7.75 1.3%ile of its own history (gap +2.7pp)
Realized 20d vol (ann. pts): all stocks 51 vs VIXEQ 38 · index 12 vs VIX 14 · style factors 29 96.2%ile
20-day window (19 completed days + today); percentiles vs model history since 2020; '3m' tokens rank vs the trailing 63 trading days; definitions in Terms below. Implied prints (Cboe) are delayed ~15 min. as of 15:58 ET
Top 50 high-beta momentum names (eq-wt, since-2020 rank): +5.3% 97.5%ile · rest of market -0.1%
| Factor | Today | 1d | 5d | 20d | 60d |
|---|---|---|---|---|---|
| Style-Risk | |||||
| Beta | +1.13% z+1.2 | +0.48% | +0.96% | -0.11% | -0.79% |
| International | -0.17% z-0.6 | -0.23% | -0.08% | -0.68% | -1.50% |
| Residual Volatility | +0.11% z+0.2 | +0.03% | +1.15% | +1.77% | -0.72% |
| Style | |||||
| Liquidity | +0.62% z+2.3 | +0.16% | +0.59% | +0.94% | -1.80% |
| Leverage | +0.36% z+2.1 | +0.21% | -0.31% | -1.51% | -2.00% |
| Dividend Yield | +0.20% z+1.1 | +0.18% | +0.30% | -0.06% | -0.86% |
| Profitability | +0.15% z+0.8 | -0.04% | -1.09% | -0.69% | -1.20% |
| Value | -0.14% z-0.6 | +0.22% | -0.28% | +0.46% | -0.38% |
| Size | -0.05% z-0.1 | -0.37% | -0.43% | -1.01% | -2.70% |
| Growth | +0.03% z+0.1 | -0.12% | +0.10% | +0.83% | +2.85% |
| Style-Momentum | |||||
| Long-Term Momentum | +1.21% z+1.9 | -0.20% | +0.54% | -2.65% | -5.07% |
| Short-Term Momentum | -0.30% z-1.0 | +0.18% | +0.55% | -5.17% | -7.64% |
| Medium-Term Momentum | -0.21% z-0.7 | -0.12% | -0.08% | +0.26% | +1.32% |
| One-Day Momentum | +0.04% z+0.1 | +0.15% | -0.17% | +1.23% | +3.48% |
| Style-Positioning | |||||
| Short Interest | -0.25% z-1.5 | -0.11% | -0.39% | -0.71% | +1.10% |
| Hedge-Fund Ownership | -0.06% z-0.6 | -0.02% | -0.22% | -0.61% | -0.27% |
| Style-Flow | |||||
| Morning Activity | -0.10% z-0.8 | -0.04% | +0.37% | +0.83% | +0.14% |
| Short-Sale Activity | +0.03% z+0.2 | +0.13% | -0.01% | +0.30% | +0.15% |
| Thematic | |||||
| Semiconductors | +1.16% z+1.9 | +0.44% | +1.36% | -1.59% | -4.43% |
| China | -0.45% z-1.1 | +0.01% | +0.17% | +0.41% | -3.42% |
| Treasury (Duration) | -0.24% z-0.7 | +0.13% | -0.20% | +0.60% | +1.25% |
| Gold | -0.19% z-0.6 | -0.02% | +1.28% | +1.84% | -1.62% |
| Oil | +0.13% z+0.3 | -0.13% | +1.49% | +1.16% | -2.92% |
| Bitcoin / Crypto | -0.01% z-0.0 | -0.25% | -0.13% | -0.68% | -1.70% |
5/20/60d windows include today's session; 1d is the previous session.
Factor z-score. Today's factor return divided by its daily-return standard deviation over ~1,600 trading days.
High-beta momentum cohort. US names above $2B market cap in the top quintile of both raw beta and 12-month momentum; membership frozen at each month's first business day. “Top 50” = the 50 strongest by combined rank.
Stock-specific (idiosyncratic) return. The part of a stock's move not explained by market, style, or thematic factors in our decomposition.
VIXEQ / DSPX / COR1M. Cboe implied indices: single-stock volatility, dispersion, and 1-month implied correlation (top-50 S&P names). Quotes delayed ~15 minutes.
Data compiled by FactorPulse AI; edited and verified by Jeff Klein. For informational purposes only. Does not constitute financial advice, an investment recommendation, or an offer to buy or sell any securities. Always consult a qualified financial professional before making investment decisions.
For more on factor construction methodology, see www.factorpulse.com/glossary.