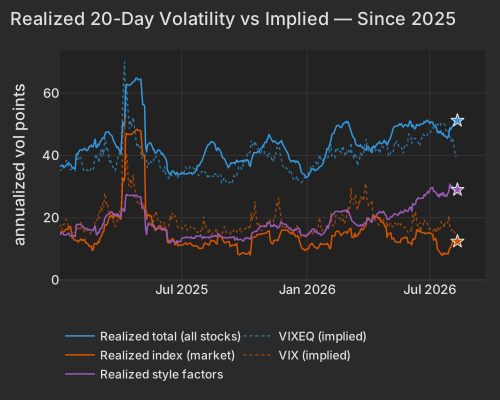
Taiwan Semiconductor reported July revenue of NT$467.58 billion, up 44.7% year on year, and raised its 2026 capital expenditure plan to between $60 billion and $64 billionCNBC. The equipment names took the money: KLA closed the session +3.87%, adding $10.1B of market value, and ASML rose +3.81%. The factor read is cleaner than the index read — Semiconductors at z=+0.8 with the top-exposure bucket up +1.6% and the low-exposure end flat, a right-sided move rather than a broad technology bid. Bernstein's upgraded 2026 wafer-fabrication-equipment spending forecast of $148 billion is the number the equipment complex is trading against.
| Factor | Return | Z-Score | 5d Z | 20d Z | 63d Z | Category | Direction |
|---|---|---|---|---|---|---|---|
| Semiconductors | +0.50% | +0.8 | -0.4 | -1.5 | -1.3 | Thematic | Most chip-exposed names led |
| Short-Term Momentum | +0.11% | +0.4 | -0.0 | -3.7 | -3.1 | Style-Momentum | Pause in a deep multi-week slide |
| Leverage | +0.26% | +1.5 | -2.2 | -2.3 | -1.8 | Style | Levered names bid after five down days |
| Dividend Yield | +0.20% | +1.1 | +0.1 | -0.6 | -0.8 | Style | Higher payout names outperformed |
| Size | -0.38% | -1.0 | -0.3 | -0.6 | -0.5 | Style | Smaller names outperformed |
| Long-Term Momentum | -0.19% | -0.3 | -0.8 | -1.8 | -1.2 | Style-Momentum | One-year winners still trailing laggards |
| Short Interest | -0.13% | -0.8 | -0.7 | -0.4 | +1.0 | Style-Positioning | Most heavily shorted names underperformed |
| Bitcoin / Crypto | -0.25% | -0.8 | -0.3 | -0.7 | -0.6 | Thematic | Crypto-exposed names lagged |
Semiconductors as a sector did not rally: SMH added only +0.89%, Broadcom fell -1.40% and Apple -1.05%. The money went where the capacity math bites. J.P. Morgan's estimate that DRAM contract prices will have risen 400% between 2024 and 2026, with Samsung and SK Hynix already committing 2027 capacity, is the read behind a +2.99% day in the memory-chip ETF and Korea outperforming. Software went the other way — IGV -1.27% after +13.28% over the prior 20 sessions — so this was not a duration-and-growth day dressed up as a chip day.
| ETF | Theme | Today | 1d Ago | 5d Ago | 20d Ago | 63d Ago |
|---|---|---|---|---|---|---|
| DRAM | memory chips & storage | +2.99% | -1.98% | -2.99% | -13.44% | -6.06% |
| EWY | south korea | +2.90% | -1.79% | +1.80% | -2.92% | -14.24% |
| AIPO | AI power infrastructure | +2.02% | -1.49% | +0.27% | -1.85% | -7.68% |
| XLU | utilities | +1.14% | -1.10% | -2.77% | -5.66% | -3.56% |
| SMH | semiconductors | +0.89% | -2.28% | +4.39% | -2.77% | +0.51% |
| IGV | software | -1.27% | +2.26% | +7.79% | +13.28% | +15.21% |
| FXI | china | -2.25% | +0.88% | +0.08% | +9.12% | -2.01% |
| KWEB | china internet | -3.62% | +1.60% | +1.32% | +11.02% | -1.46% |
Strip out the chip complex and there was no market to speak of: 88.7% of today's cross-sectional variance was idiosyncratic and realized correlation ran at 0.2% through the session, the 9th percentile since 2020. NIQ Global Intelligence closed +42.08% after a second-quarter beat and a swing to positive free cash flowBloomberg, its biggest company-specific move in a year by a wide margin. Sea Limited added +14.43% and $10.3B of market value on revenue of $7.8 billion, up 48.1% and ahead of consensus, with Shopee guided to a $1 billion adjusted EBITDA yearNasdaq. On the other side, On Holding fell -20.27% after cutting full-year constant-currency growth guidance to the low-20% range from at least 23%, erasing $2.61B; Life360 dropped -24.72% following its results; Tencent Music lost -11.97%, and the China complex went with it. Hub Group's -19.32% is almost entirely the stock's own move, and today's coverage carries no driver for it.
| Series | Today Vol Pts | Prev Close Vol Pts |
|---|---|---|
| total | 51.20 | 51.35 |
| market | 12.40 | 12.38 |
| style | 29.00 | 29.19 |
The chip reversal is one session; the momentum structure underneath it is a month old. Short-Term Momentum's completed 20-day cumulative return through the prior close was -5.09%, the bottom 1% of 1,581 overlapping 20-day windows since 2020, and today's +0.11% at z=+0.4 does nothing to it. Because that basket rebuilds from its own trailing week, the persistence means each successive set of recent leaders was handed back in turn — a churn pattern, not one directional position being sold for a month.
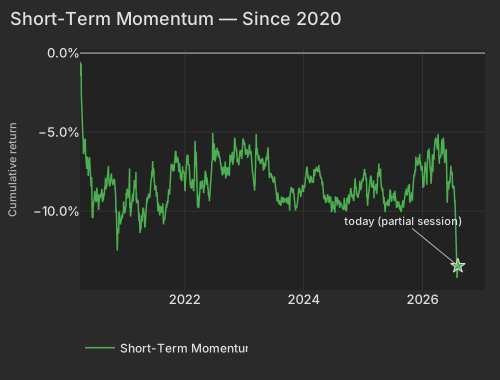
| Date | Cumret Pct |
|---|---|
| 2020-03-27 | -0.66 |
| 2020-04-21 | -5.95 |
| 2020-05-13 | -6.54 |
| 2020-06-05 | -8.15 |
| 2020-06-29 | -8.96 |
| 2020-07-22 | -9.52 |
| 2020-08-13 | -9.42 |
| 2020-09-04 | -8.62 |
| 2020-09-29 | -8.31 |
| 2020-10-21 | -8.17 |
| 2020-11-12 | -12.49 |
| 2020-12-07 | -10.42 |
| 2020-12-30 | -10.02 |
| 2021-01-25 | -8.50 |
| 2021-02-17 | -9.26 |
| 2021-03-11 | -9.50 |
| 2021-04-05 | -11.05 |
| 2021-04-27 | -10.10 |
| 2021-05-19 | -9.11 |
| 2021-06-11 | -7.93 |
| 2021-07-06 | -8.61 |
| 2021-07-28 | -10.02 |
| 2021-08-19 | -9.50 |
| 2021-09-13 | -9.79 |
| 2021-10-05 | -7.72 |
| 2021-10-27 | -7.48 |
| 2021-11-18 | -6.93 |
| 2021-12-13 | -7.72 |
| 2022-01-05 | -8.28 |
| 2022-01-28 | -7.10 |
| 2022-02-22 | -8.47 |
| 2022-03-16 | -8.51 |
| 2022-04-07 | -8.25 |
| 2022-05-02 | -8.55 |
| 2022-05-24 | -7.99 |
| 2022-06-16 | -7.30 |
| 2022-07-12 | -6.72 |
| 2022-08-03 | -6.64 |
| 2022-08-25 | -7.61 |
| 2022-09-19 | -7.75 |
| 2022-10-11 | -6.92 |
| 2022-11-02 | -6.30 |
| 2022-11-25 | -6.71 |
| 2022-12-19 | -6.70 |
| 2023-01-12 | -6.24 |
| 2023-02-06 | -5.85 |
| 2023-03-01 | -7.84 |
| 2023-03-23 | -6.00 |
| 2023-04-17 | -7.01 |
| 2023-05-09 | -7.18 |
| 2023-06-01 | -6.68 |
| 2023-06-26 | -7.95 |
| 2023-07-19 | -8.82 |
| 2023-08-10 | -9.57 |
| 2023-09-01 | -9.43 |
| 2023-09-26 | -9.25 |
| 2023-10-18 | -8.63 |
| 2023-11-09 | -9.43 |
| 2023-12-04 | -8.89 |
| 2023-12-27 | -8.33 |
| 2024-01-22 | -7.47 |
| 2024-02-13 | -8.23 |
| 2024-03-07 | -7.33 |
| 2024-04-01 | -7.48 |
| 2024-04-23 | -7.91 |
| 2024-05-15 | -9.24 |
| 2024-06-07 | -9.25 |
| 2024-07-02 | -9.36 |
| 2024-07-25 | -9.14 |
| 2024-08-16 | -9.40 |
| 2024-09-10 | -9.15 |
| 2024-10-02 | -9.13 |
| 2024-10-24 | -8.82 |
| 2024-11-15 | -7.92 |
| 2024-12-10 | -8.89 |
| 2025-01-03 | -8.11 |
| 2025-01-29 | -9.14 |
| 2025-02-21 | -7.75 |
| 2025-03-17 | -8.70 |
| 2025-04-08 | -7.51 |
| 2025-05-01 | -8.54 |
| 2025-05-23 | -9.56 |
| 2025-06-17 | -8.90 |
| 2025-07-11 | -9.00 |
| 2025-08-04 | -9.42 |
| 2025-08-26 | -10.04 |
| 2025-09-18 | -9.07 |
| 2025-10-10 | -8.58 |
| 2025-11-03 | -9.06 |
| 2025-11-25 | -6.55 |
| 2025-12-18 | -6.38 |
| 2026-01-13 | -8.46 |
| 2026-02-05 | -6.17 |
| 2026-03-02 | -7.77 |
| 2026-03-24 | -5.44 |
| 2026-04-16 | -6.57 |
| 2026-05-08 | -5.84 |
| 2026-06-02 | -7.11 |
| 2026-06-25 | -7.44 |
| 2026-07-20 | -8.65 |
| 2026-08-11 | -13.46 |
The longer horizon tells the same story with more conviction: Long-Term Momentum has scored one-year winners below one-year laggards across every horizon, with a 20-day rank correlation of -0.90, and today's -0.19% at z=-0.3 adds only marginal pressure to a slope already in place. Against that, the day's style return went to beta and balance sheet — the top 50 high-beta momentum names rose +2.0% while the rest of the universe managed +0.09% equal-weight, and Leverage returned +0.26% at z=+1.5 after five consecutive down days, with KKR +6.91% the loudest name in that group.
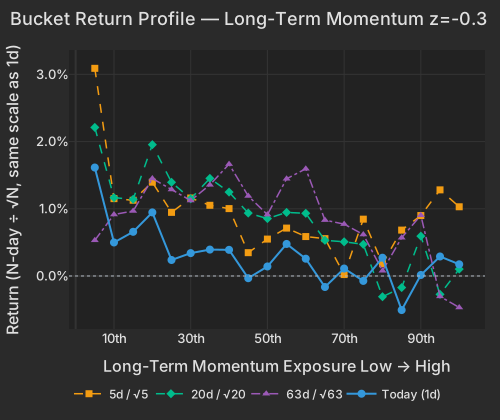
| Bucket | Ret 1D Pct | Ret 5D Norm Pct | Ret 20D Norm Pct | Ret 63D Norm Pct |
|---|---|---|---|---|
| 1 | 1.61 | 3.09 | 2.21 | 0.53 |
| 2 | 0.50 | 1.15 | 1.17 | 0.91 |
| 3 | 0.66 | 1.13 | 1.14 | 0.97 |
| 4 | 0.95 | 1.40 | 1.95 | 1.45 |
| 5 | 0.24 | 0.95 | 1.39 | 1.29 |
| 6 | 0.34 | 1.16 | 1.15 | 1.12 |
| 7 | 0.39 | 1.05 | 1.45 | 1.36 |
| 8 | 0.39 | 1.00 | 1.25 | 1.66 |
| 9 | -0.03 | 0.35 | 0.94 | 1.19 |
| 10 | 0.14 | 0.55 | 0.85 | 0.91 |
| 11 | 0.48 | 0.71 | 0.95 | 1.45 |
| 12 | 0.26 | 0.59 | 0.93 | 1.59 |
| 13 | -0.16 | 0.56 | 0.53 | 0.83 |
| 14 | 0.11 | 0.02 | 0.51 | 0.77 |
| 15 | -0.07 | 0.85 | 0.47 | 0.62 |
| 16 | 0.27 | 0.18 | -0.31 | 0.08 |
| 17 | -0.51 | 0.68 | -0.17 | 0.57 |
| 18 | 0.01 | 0.90 | 0.59 | 0.90 |
| 19 | 0.29 | 1.28 | -0.27 | -0.30 |
| 20 | 0.17 | 1.03 | 0.10 | -0.47 |
The front end helped the defensive corner of the cross-section: the 2-Year Treasury yield eased 1.3 bps to 4.226% and the 10-Year slipped to 4.694%, while the 30-Year was a touch higher at 5.246%CNBC. Dividend Yield returned +0.20% at z=+1.1, utilities led the sectors at +1.33% with Constellation Energy +3.37%, and Honeywell's -5.32% was the mirror image on the industrial side. After the bell, CoreWeave — up +2.31% in the session — added a further +7.63% in late trading on its report, which belongs to tomorrow's tape, not today's.
The New York Fed's Consumer Credit Panel, released at 11:00 AM ET, showed credit card balances transitioning into delinquency at 10.93%, the highest reading in over a decade, with total household debt at a record $17.80 trillion and auto-loan delinquencies also drifting higher. The researchers attribute the pressure to higher interest rates and the exhaustion of pandemic-era savings; a 2.5 percentage point gap between credit-bureau delinquency rates and bank regulatory filings is the detail worth watching before it shows up in consumer-lender credit costs.
Variance decomposition: live intraday — 20260811 session, bracketed against its trailing-year range. Factor returns are trailing through last close. Total cross-sectional dispersion: 34%ile of the past year.
Variance mix — % of total, today vs 1d ago vs 1-yr avg
market 15%ile style 14%ile thematic 59%ile idiosyncratic 93.2%ile
Variance explained — today vs. factor's trailing-year range
Marker = the factor's share of today's total variance, placed in its own trailing-year range (box 25–75%ile, ticks 90%ile and max). Amber marker = unusually load-bearing today (≥90%ile of its own year). Factor name green = up today / red = down.
Correlation & dispersion — realized vs implied
Pairwise realized correlation (20d): 7.67% 2.4%ile since 2020 · 32%ile 3m
Top-500 pairwise: 10.33% 8.1%ile since 2020 · 49%ile 3m · implied (Cboe COR1M): 8.94 2.5%ile of its own history (gap +1.4pp)
Realized 20d vol (ann. pts): all stocks 51 vs VIXEQ 39 · index 12 vs VIX 15 · style factors 29 96.2%ile
20-day window (19 completed days + today); percentiles vs model history since 2020; '3m' tokens rank vs the trailing 63 trading days; definitions in Terms below. Implied prints (Cboe) are delayed ~15 min. as of 16:21 ET
Top 50 high-beta momentum names (eq-wt, since-2020 rank): +2.0% 76%ile · rest of market +0.1%
| Factor | Today | 1d | 5d | 20d | 60d |
|---|---|---|---|---|---|
| Style-Risk | |||||
| International | -0.24% z-0.8 | +0.14% | +0.21% | -0.20% | -1.53% |
| Beta | +0.57% z+0.6 | -1.14% | -0.43% | -1.57% | -3.63% |
| Residual Volatility | +0.06% z+0.1 | +0.39% | +0.52% | +1.19% | -0.30% |
| Style | |||||
| Leverage | +0.26% z+1.5 | -0.50% | -0.86% | -1.76% | -2.77% |
| Dividend Yield | +0.20% z+1.1 | -0.18% | +0.03% | -0.47% | -1.10% |
| Size | -0.38% z-1.0 | +0.33% | -0.25% | -0.91% | -2.51% |
| Liquidity | +0.28% z+1.0 | -0.22% | -0.34% | +0.18% | -1.80% |
| Value | +0.20% z+0.8 | +0.05% | -0.45% | +0.60% | -0.25% |
| Growth | -0.09% z-0.4 | +0.31% | +0.41% | +0.79% | +3.03% |
| Profitability | -0.04% z-0.2 | -0.52% | -1.27% | -1.00% | -1.17% |
| Style-Momentum | |||||
| Medium-Term Momentum | -0.15% z-0.5 | +0.48% | +0.45% | +0.64% | +2.04% |
| Short-Term Momentum | +0.11% z+0.3 | +0.04% | -0.00% | -5.09% | -7.86% |
| One-Day Momentum | +0.10% z+0.3 | -0.03% | -0.57% | +0.74% | +3.71% |
| Long-Term Momentum | -0.19% z-0.3 | +0.28% | -1.16% | -5.08% | -6.72% |
| Style-Positioning | |||||
| Short Interest | -0.13% z-0.8 | +0.15% | -0.27% | -0.32% | +1.41% |
| Hedge-Fund Ownership | -0.01% z-0.1 | -0.04% | -0.03% | -0.27% | -0.20% |
| Style-Flow | |||||
| Short-Sale Activity | +0.10% z+0.9 | -0.08% | -0.11% | +0.28% | +0.18% |
| Morning Activity | -0.05% z-0.4 | +0.41% | +0.69% | +1.15% | +0.12% |
| Thematic | |||||
| Bitcoin / Crypto | -0.25% z-0.8 | +0.12% | -0.23% | -0.89% | -1.59% |
| Semiconductors | +0.50% z+0.8 | -0.19% | -0.56% | -3.99% | -6.57% |
| Treasury (Duration) | +0.13% z+0.4 | +0.10% | +0.37% | +0.96% | +1.25% |
| Oil | -0.14% z-0.3 | +1.17% | +0.91% | +0.37% | -2.37% |
| Gold | -0.07% z-0.2 | +0.62% | +2.08% | +1.98% | -2.46% |
| China | -0.01% z-0.0 | -0.00% | +0.32% | +1.21% | -3.16% |
5/20/60d windows include today's session; 1d is the previous session.
Factor z-score. Today's factor return divided by its daily-return standard deviation over ~1,600 trading days.
High-beta momentum cohort. US names above $2B market cap in the top quintile of both raw beta and 12-month momentum; membership frozen at each month's first business day. “Top 50” = the 50 strongest by combined rank.
Stock-specific (idiosyncratic) return. The part of a stock's move not explained by market, style, or thematic factors in our decomposition.
Data compiled by FactorPulse AI; edited and verified by Jeff Klein. For informational purposes only. Does not constitute financial advice, an investment recommendation, or an offer to buy or sell any securities. Always consult a qualified financial professional before making investment decisions.
For more on factor construction methodology, see www.factorpulse.com/glossary.