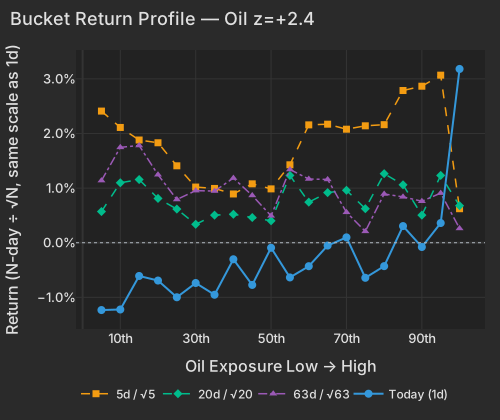
Iran's price for reopening the Strait of Hormuz — an end to the US shipping blockade plus compensation for damages — followed a failed round of talks with Oman and an attack on a Saudi refinery near the Red Sea, with Brent settling near $87 after gaining more than 5% over three sessions Bloomberg. The cross-section paid it immediately: the Oil factor's +1.13% ranks in the 99.4th percentile of sessions since 2020, and the ten exploration-and-production names at the top of the exposure ranking rose +7.10% on a weighted basis. Energy's median stock was up +4.11%, and XOP traded at 1.6× its typical session pace.
| Factor | Return | Z-Score | 5d Z | 20d Z | 63d Z | Category | Direction |
|---|---|---|---|---|---|---|---|
| Morning Activity | +0.39% | z=+3.1 | +2.58 | +2.00 | +0.57 | Style-Flow | Habitually morning-heavy names led |
| Leverage | -0.48% | z=-2.8 | -3.41 | -2.67 | -1.95 | Style | Most levered lagged |
| Profitability | -0.51% | z=-2.7 | -2.56 | -1.31 | -1.19 | Style | Most profitable lagged |
| Oil | +1.13% | z=+2.4 | +0.70 | +0.34 | -0.15 | Thematic | Oil-exposed led |
| Gold | +0.62% | z=+1.9 | +3.34 | +1.48 | -0.73 | Thematic | Gold-exposed led |
| Medium-Term Momentum | +0.44% | z=+1.5 | +0.7 | +0.5 | +0.8 | Style-Momentum | 20-day winners led |
| Beta | -1.07% | z=-1.1 | +0.6 | -0.2 | -0.5 | Style-Risk | Highest-beta lagged |
The energy move split cleanly between the factor and the company. Venture Global +7.32% and Equinor +4.31% were almost entirely the oil factor at work, with barely anything stock-specific in either. Helmerich & Payne rose +12.53% in the session with roughly four-fifths of it its own move, and Seadrill added +7.91% after reporting before the open. National Energy Services Reunited was the largest idiosyncratic mover in the universe at +23.44%; its second-quarter results, carried by Morningstar, showed revenue of $520.8m against $448.5m consensus and a first $0.10 quarterly dividend.
| Bucket | Ret 1D Pct | Ret 5D Norm Pct | Ret 20D Norm Pct | Ret 63D Norm Pct |
|---|---|---|---|---|
| 1 | -1.23 | 2.41 | 0.57 | 1.14 |
| 2 | -1.22 | 2.11 | 1.10 | 1.75 |
| 3 | -0.61 | 1.88 | 1.16 | 1.78 |
| 4 | -0.69 | 1.83 | 0.81 | 1.25 |
| 5 | -1.00 | 1.41 | 0.62 | 0.79 |
| 6 | -0.74 | 1.02 | 0.34 | 0.95 |
| 7 | -0.95 | 0.99 | 0.51 | 0.95 |
| 8 | -0.30 | 0.89 | 0.52 | 1.18 |
| 9 | -0.77 | 1.08 | 0.46 | 0.87 |
| 10 | -0.09 | 0.99 | 0.40 | 0.49 |
| 11 | -0.64 | 1.43 | 1.23 | 1.34 |
| 12 | -0.43 | 2.16 | 0.74 | 1.17 |
| 13 | -0.05 | 2.17 | 0.92 | 1.16 |
| 14 | 0.10 | 2.08 | 0.96 | 0.56 |
| 15 | -0.64 | 2.14 | 0.62 | 0.21 |
| 16 | -0.43 | 2.16 | 1.26 | 0.89 |
| 17 | 0.30 | 2.79 | 1.06 | 0.84 |
| 18 | -0.08 | 2.87 | 0.51 | 0.76 |
| 19 | 0.36 | 3.07 | 1.23 | 0.91 |
| 20 | 3.18 | 0.62 | 0.68 | 0.26 |
The metals bid did not go away either. The Gold factor added +0.62% at z=+1.93, extending a five-day run that ranks in the top 0.1% of five-day stretches since 2020, and SLV rose +3.38% at twice its typical pace. Barrick was the exception that mattered: it fell -6.09% in the session on more than three times normal volume, erasing over $4B of market value. Second-quarter adjusted EPS of $0.82 missed the high end of consensus at $0.94 on rising energy costs, and neither the 796,000-ounce production beat nor a $1.95B cash settlement from Newmont was enough FT. Nearly all of that was Barrick's own move — the gold factor was up while its biggest name was marked down.
The Leverage factor fell -0.48% at z=-2.78, its fifth consecutive down session. The completed five-day run through Friday came to -1.32% — the bottom 0.5% of every five-day window since 2020, and the most extreme since September 2022. Widening the lens does not soften it: -2.07% over 20 sessions at z=-2.67 and -2.68% over 63. The funding curve moved the same way today, with every tenor from three months to 30 years higher, the 10-year at 4.70% (+4.3 bps) and the five-year at 4.41% (+4.4 bps) CNBC.
| ETF | Theme | Today | 1d Ago | 5d Ago | 20d Ago | 63d Ago |
|---|---|---|---|---|---|---|
| USO | oil | +6.81% | -0.75% | -8.66% | +8.54% | -12.59% |
| XOP | oil E&P | +5.77% | -0.39% | -6.20% | +4.94% | +0.20% |
| XLE | energy | +4.70% | -1.13% | -3.44% | +4.39% | +2.77% |
| SLV | silver | +3.38% | +2.95% | +9.82% | +6.58% | -19.69% |
| ITB | homebuilders | -2.67% | +2.71% | +7.21% | +3.46% | +8.83% |
| SMH | semiconductors | -2.19% | +1.96% | +7.80% | -4.64% | +7.89% |
| VNQ | real estate | -1.44% | +0.40% | -0.53% | +1.14% | +2.12% |
| XLU | utilities | -1.12% | +0.53% | -1.67% | -3.96% | -3.35% |
| TLT | long bonds | -0.81% | +0.29% | +0.62% | -2.02% | -3.37% |
| HYG | high yield credit | -0.16% | +0.19% | +0.16% | -0.13% | -0.31% |
Homebuilders handed back a week's gain in a session, and the property and utility names went with them. Investment-grade credit lost -0.55% on duration alone; high yield barely moved at -0.16%, which is what keeps this from being a funding-stress story. What it is instead shows up in the horizon profile: the more levered the name, the worse it has done at one day, five, 20 and 63, with the same slope every time.
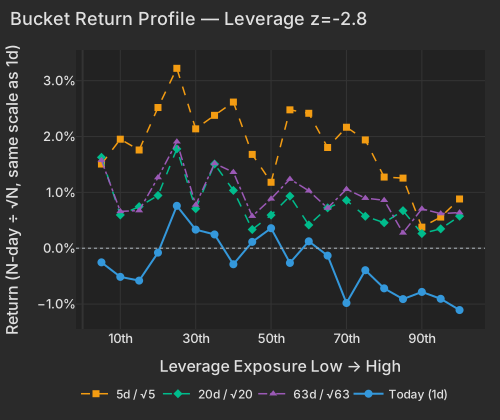
| Bucket | Ret 1D Pct | Ret 5D Norm Pct | Ret 20D Norm Pct | Ret 63D Norm Pct |
|---|---|---|---|---|
| 1 | -0.25 | 1.51 | 1.63 | 1.57 |
| 2 | -0.51 | 1.95 | 0.60 | 0.66 |
| 3 | -0.58 | 1.76 | 0.74 | 0.67 |
| 4 | -0.08 | 2.52 | 0.94 | 1.27 |
| 5 | 0.76 | 3.22 | 1.78 | 1.91 |
| 6 | 0.33 | 2.14 | 0.71 | 0.77 |
| 7 | 0.25 | 2.38 | 1.51 | 1.52 |
| 8 | -0.29 | 2.62 | 1.04 | 1.36 |
| 9 | 0.11 | 1.68 | 0.33 | 0.57 |
| 10 | 0.36 | 1.18 | 0.59 | 0.88 |
| 11 | -0.26 | 2.48 | 0.93 | 1.24 |
| 12 | 0.12 | 2.42 | 0.42 | 1.03 |
| 13 | -0.13 | 1.80 | 0.72 | 0.72 |
| 14 | -0.98 | 2.17 | 0.86 | 1.06 |
| 15 | -0.39 | 1.94 | 0.57 | 0.90 |
| 16 | -0.72 | 1.27 | 0.46 | 0.86 |
| 17 | -0.91 | 1.26 | 0.67 | 0.27 |
| 18 | -0.78 | 0.38 | 0.26 | 0.71 |
| 19 | -0.91 | 0.56 | 0.35 | 0.62 |
| 20 | -1.11 | 0.88 | 0.57 | 0.64 |
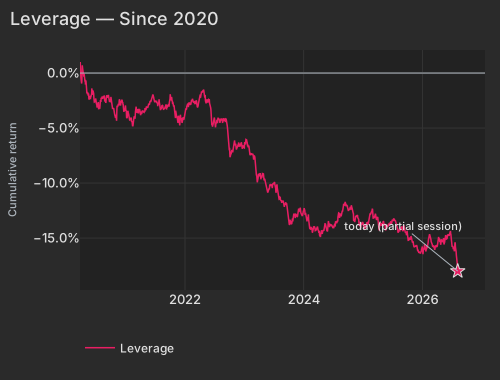
| Date | Cumret Pct |
|---|---|
| 2020-03-26 | 0.21 |
| 2020-04-20 | -0.33 |
| 2020-05-12 | -1.86 |
| 2020-06-04 | -1.96 |
| 2020-06-26 | -2.60 |
| 2020-07-21 | -3.27 |
| 2020-08-12 | -2.15 |
| 2020-09-03 | -2.37 |
| 2020-09-28 | -2.46 |
| 2020-10-20 | -3.19 |
| 2020-11-11 | -3.06 |
| 2020-12-04 | -2.50 |
| 2020-12-29 | -3.24 |
| 2021-01-22 | -4.04 |
| 2021-02-16 | -4.79 |
| 2021-03-10 | -3.27 |
| 2021-04-01 | -3.65 |
| 2021-04-26 | -3.57 |
| 2021-05-18 | -3.07 |
| 2021-06-10 | -2.28 |
| 2021-07-02 | -2.54 |
| 2021-07-27 | -2.38 |
| 2021-08-18 | -2.97 |
| 2021-09-10 | -3.32 |
| 2021-10-04 | -1.93 |
| 2021-10-26 | -2.98 |
| 2021-11-17 | -4.16 |
| 2021-12-10 | -4.09 |
| 2022-01-04 | -3.71 |
| 2022-01-27 | -2.74 |
| 2022-02-18 | -2.45 |
| 2022-03-15 | -2.56 |
| 2022-04-06 | -1.95 |
| 2022-04-29 | -1.86 |
| 2022-05-23 | -2.69 |
| 2022-06-15 | -4.22 |
| 2022-07-11 | -4.83 |
| 2022-08-02 | -4.25 |
| 2022-08-24 | -4.34 |
| 2022-09-16 | -4.43 |
| 2022-10-10 | -7.52 |
| 2022-11-01 | -6.25 |
| 2022-11-23 | -6.72 |
| 2022-12-16 | -6.63 |
| 2023-01-11 | -6.25 |
| 2023-02-03 | -7.24 |
| 2023-02-28 | -7.73 |
| 2023-03-22 | -9.62 |
| 2023-04-14 | -9.66 |
| 2023-05-08 | -9.64 |
| 2023-05-31 | -10.60 |
| 2023-06-23 | -10.46 |
| 2023-07-18 | -10.83 |
| 2023-08-09 | -11.27 |
| 2023-08-31 | -11.71 |
| 2023-09-25 | -12.31 |
| 2023-10-17 | -13.59 |
| 2023-11-08 | -12.77 |
| 2023-12-01 | -12.49 |
| 2023-12-26 | -12.99 |
| 2024-01-19 | -13.19 |
| 2024-02-12 | -14.01 |
| 2024-03-06 | -13.96 |
| 2024-03-28 | -13.95 |
| 2024-04-22 | -14.34 |
| 2024-05-14 | -13.70 |
| 2024-06-06 | -13.82 |
| 2024-07-01 | -14.10 |
| 2024-07-24 | -13.47 |
| 2024-08-15 | -12.95 |
| 2024-09-09 | -12.02 |
| 2024-10-01 | -12.32 |
| 2024-10-23 | -12.01 |
| 2024-11-14 | -13.40 |
| 2024-12-09 | -13.53 |
| 2025-01-02 | -13.60 |
| 2025-01-28 | -13.68 |
| 2025-02-20 | -12.77 |
| 2025-03-14 | -13.08 |
| 2025-04-07 | -13.51 |
| 2025-04-30 | -13.69 |
| 2025-05-22 | -14.30 |
| 2025-06-16 | -13.76 |
| 2025-07-10 | -13.21 |
| 2025-08-01 | -14.02 |
| 2025-08-25 | -14.18 |
| 2025-09-17 | -14.26 |
| 2025-10-09 | -15.20 |
| 2025-10-31 | -15.36 |
| 2025-11-24 | -15.71 |
| 2025-12-17 | -16.28 |
| 2026-01-12 | -16.06 |
| 2026-02-04 | -15.54 |
| 2026-02-27 | -15.37 |
| 2026-03-23 | -15.93 |
| 2026-04-15 | -15.19 |
| 2026-05-07 | -15.24 |
| 2026-06-01 | -15.14 |
| 2026-06-24 | -14.52 |
| 2026-07-17 | -16.03 |
| 2026-08-10 | -18.00 |
If this were straightforward de-risking, profitable companies would have been the refuge. They were the funding source. Profitability fell -0.51% at z=-2.68, and the five-day reading at z=-2.56 says today was not a one-off. Money left levered balance sheets and profitable income statements in the same session and went to names carrying neither.
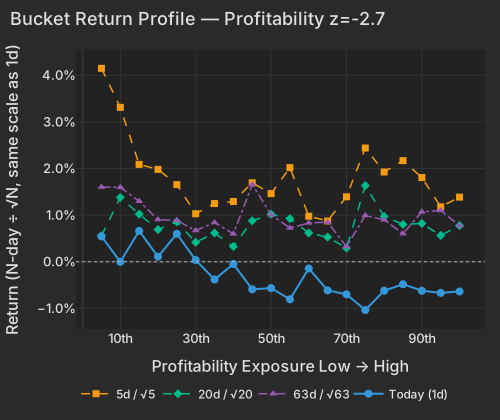
| Bucket | Ret 1D Pct | Ret 5D Norm Pct | Ret 20D Norm Pct | Ret 63D Norm Pct |
|---|---|---|---|---|
| 1 | 0.55 | 4.15 | 0.56 | 1.60 |
| 2 | -0.00 | 3.31 | 1.38 | 1.60 |
| 3 | 0.66 | 2.09 | 1.02 | 1.30 |
| 4 | 0.11 | 1.98 | 0.69 | 0.91 |
| 5 | 0.60 | 1.65 | 0.86 | 0.89 |
| 6 | 0.04 | 1.03 | 0.42 | 0.67 |
| 7 | -0.38 | 1.25 | 0.62 | 0.84 |
| 8 | -0.05 | 1.29 | 0.33 | 0.60 |
| 9 | -0.59 | 1.69 | 0.88 | 1.66 |
| 10 | -0.57 | 1.46 | 1.02 | 1.01 |
| 11 | -0.81 | 2.02 | 0.93 | 0.72 |
| 12 | -0.14 | 0.98 | 0.62 | 0.83 |
| 13 | -0.61 | 0.88 | 0.53 | 0.85 |
| 14 | -0.70 | 1.39 | 0.29 | 0.32 |
| 15 | -1.04 | 2.44 | 1.63 | 0.99 |
| 16 | -0.62 | 1.93 | 0.97 | 0.90 |
| 17 | -0.48 | 2.17 | 0.80 | 0.60 |
| 18 | -0.62 | 1.81 | 0.82 | 1.07 |
| 19 | -0.67 | 1.18 | 0.56 | 1.10 |
| 20 | -0.64 | 1.39 | 0.77 | 0.77 |
Who was buying, at least by habit, is the day's most extreme print. Morning Activity rose +0.39% at z=+3.11, the 99.6th percentile since 2020, and it accounted for a larger share of cross-sectional variance than in any session of its trailing year. That exposure is a standing tilt fixed before the open: the names that habitually run volume-heavy mornings — a group skewing retail and international — beat the names whose volume spreads evenly through the day. Archer Aviation, which sits near the bottom of the profitability ranking, rose +12.08% after Boeing agreed to transfer Wisk Aero, SkyGrid and Insitu in exchange for a 19.75% stake CNBC; it reports after tonight's close, so none of that is a reaction to results.
Beta's -1.07% is two unrelated trades wearing one number. Its lowest-exposure end rose +2.64% as a group, lifted by exploration and production names, while its highest-exposure end fell -3.32% on the AI and data-center names — NNE, POET and Wolfspeed among them. None of it reached the index: the market factor explained less than a tenth of a percent of today's cross-sectional variance against a one-year average near 10%, and realized 20-day correlation remains pinned near the lows it has held for weeks at 7.7%, the 2.4th percentile since 2020. The options market is positioned for precisely that — implied one-month single-stock correlation (Cboe COR1M) is in the bottom 1.4% of its 20-year history while implied single-stock volatility (Cboe VIXEQ) sits in its 85th percentile.
Intel announced a $15B common stock offering to fund AI capacity, and the sector priced the dilution rather than the ambition: SMH fell -2.19% and the memory-chip ETF DRAM -1.83% Bloomberg. Coherent fell -14.19% in the session, erasing roughly $12B of market value, on profit-taking and de-risking ahead of its August 12 report Bloomberg — almost all of it the stock's own move, among its largest such sessions of the past year. Software went the other way, IGV +2.37% with Datadog +11.70% on a move today's coverage does not yet explain.
July CPI bls.gov prints Wednesday at 8:30 a.m. ET with consensus at 3.4% year-over-year BLS; CNBC reported that traders on Kalshi are pricing only a 15% chance the headline figure comes in above that. Both of today's moves point at that number — crude feeds the headline, and the levered names sold for five straight sessions are the ones sitting on the wrong side of any further move up in yields. The oil leg is the fragile one: Iran said Monday that a deal with Oman to reopen the strait is very close even while ruling out talks with Washington Bloomberg, and a reopening takes today's war premium straight back out.
Variance decomposition: live intraday — 20260810 session, bracketed against its trailing-year range. Factor returns are trailing through last close. Total cross-sectional dispersion: 51%ile of the past year.
Variance mix — % of total, today vs 1d ago vs 1-yr avg
market 7.2%ile style 67%ile thematic 90.4%ile idiosyncratic 49%ile
Variance explained — today vs. factor's trailing-year range
Marker = the factor's share of today's total variance, placed in its own trailing-year range (box 25–75%ile, ticks 90%ile and max). Amber marker = unusually load-bearing today (≥90%ile of its own year). Factor name green = up today / red = down.
Correlation & dispersion — realized vs implied
Pairwise realized correlation (20d): 7.70% 2.4%ile since 2020 · 32%ile 3m
Top-500 pairwise: 10.20% 7.8%ile since 2020 · 48%ile 3m · implied (Cboe COR1M): 7.89 1.4%ile of its own history (gap +2.3pp)
Realized 20d vol (ann. pts): all stocks 51 vs VIXEQ 40 · index 12 vs VIX 15 · style factors 29 96.4%ile
20-day window (19 completed days + today); percentiles vs model history since 2020; '3m' tokens rank vs the trailing 63 trading days; definitions in Terms below. Implied prints (Cboe) are delayed ~15 min. as of 15:58 ET
Top 50 high-beta momentum names (eq-wt, since-2020 rank): -2.5% 15%ile · rest of market -0.2%
| Factor | Today | 1d | 5d | 20d | 60d |
|---|---|---|---|---|---|
| Style-Risk | |||||
| Beta | -1.07% z-1.1 | +1.03% | +1.26% | -0.70% | -3.85% |
| Residual Volatility | +0.37% z+0.7 | +0.63% | +1.19% | +0.92% | -0.30% |
| International | +0.16% z+0.5 | -0.05% | -0.02% | -0.00% | -1.47% |
| Style | |||||
| Leverage | -0.48% z-2.8 | -0.29% | -1.32% | -2.07% | -2.90% |
| Profitability | -0.51% z-2.7 | -0.47% | -1.09% | -1.11% | -1.25% |
| Growth | +0.31% z+1.3 | -0.02% | +0.58% | +1.08% | +3.34% |
| Liquidity | -0.26% z-0.9 | +0.17% | -0.32% | -0.17% | -1.82% |
| Dividend Yield | -0.17% z-0.9 | +0.09% | -0.02% | -0.40% | -1.20% |
| Size | +0.32% z+0.9 | -0.51% | -0.11% | -0.54% | -2.00% |
| Value | +0.04% z+0.2 | -0.23% | -0.77% | +0.21% | -0.56% |
| Style-Momentum | |||||
| Medium-Term Momentum | +0.44% z+1.5 | +0.02% | +0.44% | +0.60% | +2.06% |
| Long-Term Momentum | +0.33% z+0.5 | -0.74% | -0.91% | -4.19% | -6.84% |
| One-Day Momentum | -0.04% z-0.1 | -0.06% | -0.93% | +0.58% | +3.58% |
| Short-Term Momentum | -0.04% z-0.1 | +0.34% | -0.65% | -5.21% | -8.29% |
| Style-Positioning | |||||
| Short Interest | +0.13% z+0.8 | +0.13% | +0.19% | -0.48% | +1.44% |
| Hedge-Fund Ownership | -0.04% z-0.4 | -0.06% | -0.14% | -0.23% | -0.30% |
| Style-Flow | |||||
| Morning Activity | +0.39% z+3.1 | +0.20% | +0.72% | +1.12% | +0.07% |
| Short-Sale Activity | -0.09% z-0.8 | -0.07% | +0.05% | +0.04% | -0.04% |
| Thematic | |||||
| Oil | +1.13% z+2.4 | -0.17% | +0.75% | +0.72% | -2.11% |
| Gold | +0.62% z+1.9 | +0.69% | +2.40% | +2.13% | -3.21% |
| Bitcoin / Crypto | +0.11% z+0.4 | -0.09% | -0.04% | -0.46% | -1.06% |
| Treasury (Duration) | +0.10% z+0.3 | +0.01% | +0.01% | +0.95% | +0.82% |
| Semiconductors | -0.14% z-0.2 | -0.62% | -0.50% | -3.98% | -7.58% |
| China | +0.01% z+0.0 | +0.35% | +0.44% | +1.20% | -3.19% |
5/20/60d windows include today's session; 1d is the previous session.
Market variance share. The fraction of cross-sectional variance explained by the market factor — the attribution companion to pairwise correlation, not a substitute for it.
Factor z-score. Today's factor return divided by its daily-return standard deviation over ~1,600 trading days.
Stock-specific (idiosyncratic) return. The part of a stock's move not explained by market, style, or thematic factors in our decomposition.
VIXEQ / DSPX / COR1M. Cboe implied indices: single-stock volatility, dispersion, and 1-month implied correlation (top-50 S&P names). Quotes delayed ~15 minutes.
Data compiled by FactorPulse AI; edited and verified by Jeff Klein. For informational purposes only. Does not constitute financial advice, an investment recommendation, or an offer to buy or sell any securities. Always consult a qualified financial professional before making investment decisions.
For more on factor construction methodology, see www.factorpulse.com/glossary.