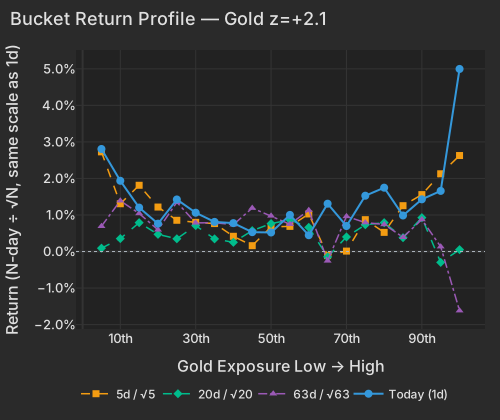
The July payrolls contraction did not create today's gold move — it fed one that has been working for a month: the Gold factor ran z=+2.1 on top of z=+2.1 over the past week, with GDX up +10.74% across twenty sessions. Beneath the metals, two quieter stories. Single stocks — not the market — set the size of the day's biggest moves. And the month-long run of short-term reversion finally paused.
U.S. employers shed 23,000 jobs in July against forecasts near 80,000 of growth, with unemployment at 4.1%Economic Times. The front of the curve did the repricing: the 1-Year yield fell 5.5 bps to 4.00% and the 2-Year 4.6 bps to 4.20%, against 2.1 bps at the 10-Year and 1.0 bp at the 30-YearCNBC — the short end moved, duration barely did. The dollar index eased -0.33% to 99.60CNBC, and bullion added more than 5% on the weekEconomic Times. In the factor model, all of it landed in one place: the gold-exposed group gained +5.00%, the miners within it +7.58%.
| Factor | Return | Z-Score | 5d Z | 20d Z | 63d Z | Category | Direction |
|---|---|---|---|---|---|---|---|
| Profitability | -0.44% | z=-2.3 | -2.0 | -0.8 | -0.9 | Style | Least-profitable names led |
| Gold | +0.68% | z=+2.1 | +2.1 | +1.3 | -0.9 | Thematic | Gold-exposed names led |
| Morning Activity | +0.22% | z=+1.8 | +1.9 | +1.5 | 0.0 | Style-Flow | Habitually early-trading names led |
| Size | -0.51% | z=-1.4 | -0.8 | -0.6 | -0.3 | Style | Smaller caps over larger |
| Long-Term Momentum | -0.75% | z=-1.2 | -1.6 | -1.7 | -0.7 | Style-Momentum | 1-year laggards over 1-year winners |
| Beta | +1.04% | z=+1.1 | +1.8 | -0.5 | -0.2 | Style-Risk | Most market-sensitive names led |
| Short-Term Momentum | +0.28% | z=+0.9 | -0.7 | -3.6 | -2.9 | Style-Momentum | Recent leaders modestly ahead |
The most extreme line in that table is not gold. Profitability closed -0.44% at z=-2.3 — the bottom 1% of its days since 2020 — because the day's rate relief was spent at the speculative end of the market: the least-profitable names, unprofitable biotech such as Insmed, Nuvation Bio and Rhythm Pharmaceuticals, gained +2.49% as a group, and the highest-beta names +5.22%. Wolfspeed rose +18.79%, roughly 6.9 points of it the day's beta rally rather than anything specific to the company. One session does not make a rotation — over twenty days the ranking still runs the other way — but it shows where an easier rate path lands first.
Today is the latest leg of a trade with a month of history behind it: GDX added +7.30% today, stands +9.30% over five sessions and +10.74% over twenty, and traded at nearly 3× its typical session pace. What none of it has done is repair the quarter — the same fund is -9.22% across 63 sessions, so this is a recovery inside a drawdown rather than a fresh trend. And the move is broad where it should be: Newmont closed +7.38%, Agnico Eagle +6.42% and B2Gold +23.20% after Thursday's results, putting Materials at the top of the day's sector table.
| ETF | Theme | Today | 1d Ago | 5d Ago | 20d Ago | 63d Ago |
|---|---|---|---|---|---|---|
| GDX | gold miners | +7.30% | +0.29% | +9.30% | +10.74% | -9.22% |
| SLV | silver | +2.97% | -0.39% | +4.39% | +3.16% | -20.36% |
| GLD | gold | +2.32% | +0.01% | +3.32% | +3.04% | -9.58% |
| Bucket | Ret 1D Pct | Ret 5D Norm Pct | Ret 20D Norm Pct | Ret 63D Norm Pct |
|---|---|---|---|---|
| 1 | 2.81 | 2.73 | 0.09 | 0.69 |
| 2 | 1.94 | 1.31 | 0.35 | 1.39 |
| 3 | 1.20 | 1.81 | 0.79 | 1.04 |
| 4 | 0.76 | 1.22 | 0.47 | 0.59 |
| 5 | 1.42 | 0.86 | 0.35 | 1.35 |
| 6 | 1.06 | 0.80 | 0.71 | 0.78 |
| 7 | 0.81 | 0.77 | 0.35 | 0.79 |
| 8 | 0.78 | 0.42 | 0.25 | 0.74 |
| 9 | 0.53 | 0.16 | 0.57 | 1.19 |
| 10 | 0.52 | 0.67 | 0.76 | 0.98 |
| 11 | 1.00 | 0.69 | 0.86 | 0.75 |
| 12 | 0.45 | 1.03 | 0.66 | 1.13 |
| 13 | 1.31 | -0.11 | -0.15 | -0.25 |
| 14 | 0.70 | 0.01 | 0.40 | 0.96 |
| 15 | 1.53 | 0.87 | 0.73 | 0.79 |
| 16 | 1.75 | 0.52 | 0.79 | 0.74 |
| 17 | 0.99 | 1.25 | 0.38 | 0.39 |
| 18 | 1.43 | 1.56 | 0.93 | 0.88 |
| 19 | 1.66 | 2.13 | -0.30 | 0.13 |
| 20 | 5.00 | 2.63 | 0.05 | -1.62 |
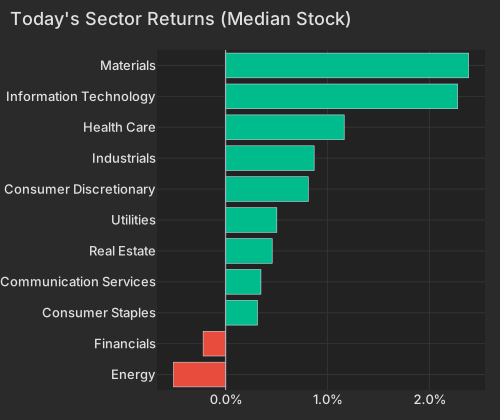
| Sector | Median Ret Pct |
|---|---|
| Energy | -0.51 |
| Financials | -0.22 |
| Consumer Staples | 0.31 |
| Communication Services | 0.35 |
| Real Estate | 0.46 |
| Utilities | 0.50 |
| Consumer Discretionary | 0.81 |
| Industrials | 0.87 |
| Health Care | 1.16 |
| Information Technology | 2.28 |
| Materials | 2.38 |
A payrolls miss moves everything by a little; it does not move Atlassian by 36%. The day's outsized moves were company stories — stock-specific returns drove 75.4% of cross-sectional variance against a 66.5% one-year average, the market factor just 9.3% — and eight names printed the largest stock-specific moves of their trailing year. Atlassian closed +35.78% as cloud revenue growth accelerated to 31%Bloomberg, Doximity +32.31%, Twilio +24.76% on a raised organic growth forecastBloomberg, Natera +21.32%, Halozyme +20.31% and Airbnb +17.38% — against The Trade Desk -21.68% on a third-quarter guidance cutBloomberg and Sezzle -33.69%. Microchip +13.78% and Onto Innovation +14.76% rounded out the list.
Reactions that size are keeping single-stock volatility elevated: the average stock is running 20-day realized volatility of 51 annualized points, above even the 40 that VIXEQ implies, while the index runs just 12 against a VIX of 15.
Doximity reported with short interest near 16.6% of its floatNasdaq, and still the squeeze stayed its own story: Short Interest returned +0.07% at z=+0.4, which is noise, and the Hedge-Fund Ownership lens was just as quiet at -0.05%. Heavily shorted names as a class were not moved today, and nothing in the cross-section attributes the buying to a positioning shift. The moves belong to earnings.
For a month the tape ran on reversion: whatever led over one week lagged the next. Short-Term Momentum — the spread between the past week's leaders and laggards — stands at -5.09% over the twenty days through the prior close, a stretch in the bottom 0.8% of overlapping 20-day windows since 2020 and a 20-day z-score of -3.6. Today the pattern did not repeat: the factor returned +0.28% (z=+0.9) after +0.28% in the prior session, the second day the spread has run the other way. The five-day pairwise-correlation gauge says the same thing from the side — at 16.83% it sits in the upper third of the past three months even as the 20-day measure scrapes its since-2020 floor at 7.77%, the 2.6th percentile. Single stocks are still doing nearly all the work; the short window has simply stopped falling. Whether that pause survives into next week is the cleanest read on whether the month's reversion regime is ending.
The Employment Situation, released at 8:30 AM ET, showed U.S. payrolls falling by 23,000 in July — the first contraction since February — with the unemployment rate at 4.1%, and traders cut the odds of further Fed tightening this yearEconomic Times; the CME FedWatch tool put the probability of a September hold at 56%Economic Times. The New York Fed's Survey of Consumer Expectations, released at 11:00 AM ET, said households sense the same thing the payroll tape showed: perceived job-loss risk rose to 14.2%, while one-year inflation expectations eased to 3.6% from 3.7%.
Variance decomposition: live intraday — 20260807 session, bracketed against its trailing-year range. Factor returns are trailing through last close. Total cross-sectional dispersion: 86%ile of the past year.
Variance mix — % of total, today vs 1d ago vs 1-yr avg
market 68%ile style 40%ile thematic 30%ile idiosyncratic 53%ile
Variance explained — today vs. factor's trailing-year range
Marker = the factor's share of today's total variance, placed in its own trailing-year range (box 25–75%ile, ticks 90%ile and max). Amber marker = unusually load-bearing today (≥90%ile of its own year). Factor name green = up today / red = down.
Correlation & dispersion — realized vs implied
Pairwise realized correlation (20d): 7.77% 2.6%ile since 2020 · 33%ile 3m
Top-500 pairwise: 10.38% 8.2%ile since 2020 · 49%ile 3m · implied (Cboe COR1M): 7.38 1.0%ile of its own history (gap +3.0pp)
Realized 20d vol (ann. pts): all stocks 51 vs VIXEQ 40 · index 12 vs VIX 15 · style factors 30 97.3%ile
20-day window (19 completed days + today); percentiles vs model history since 2020; '3m' tokens rank vs the trailing 63 trading days; definitions in Terms below. Implied prints (Cboe) are delayed ~15 min. as of 16:58 ET
High-beta momentum cohort (eq-wt, since-2020 rank): +2.2% 83%ile · rest of market +0.8%
| Factor | Today | 1d | 5d | 20d | 60d |
|---|---|---|---|---|---|
| Style-Risk | |||||
| Residual Volatility | +0.60% z+1.2 | -0.01% | +1.36% | +0.56% | -0.69% |
| Beta | +1.04% z+1.1 | -0.54% | +3.93% | -2.18% | -2.08% |
| International | -0.01% z-0.0 | +0.22% | -0.73% | -0.04% | -1.43% |
| Style | |||||
| Profitability | -0.44% z-2.3 | -0.21% | -0.84% | -0.69% | -0.98% |
| Leverage | -0.27% z-1.6 | -0.09% | -0.94% | -1.76% | -2.27% |
| Size | -0.51% z-1.4 | +0.17% | -0.64% | -0.92% | -1.63% |
| Value | -0.25% z-1.1 | -0.19% | -0.59% | +0.28% | -0.84% |
| Dividend Yield | +0.15% z+0.8 | +0.00% | +0.17% | -0.29% | -1.02% |
| Liquidity | +0.20% z+0.7 | -0.13% | +0.23% | +0.15% | -1.72% |
| Growth | -0.03% z-0.1 | -0.11% | +0.39% | +0.67% | +2.76% |
| Style-Momentum | |||||
| Long-Term Momentum | -0.75% z-1.2 | -0.01% | -2.31% | -4.84% | -6.22% |
| Short-Term Momentum | +0.28% z+0.9 | +0.28% | -0.52% | -5.09% | -7.77% |
| One-Day Momentum | -0.07% z-0.2 | -0.27% | -0.36% | +0.62% | +3.71% |
| Medium-Term Momentum | -0.05% z-0.1 | -0.25% | -0.26% | -0.07% | +1.94% |
| Style-Positioning | |||||
| Short Interest | +0.07% z+0.4 | -0.31% | -0.05% | -0.73% | +1.38% |
| Hedge-Fund Ownership | -0.05% z-0.4 | -0.03% | +0.06% | -0.18% | -0.30% |
| Style-Flow | |||||
| Morning Activity | +0.22% z+1.8 | -0.09% | +0.54% | +0.86% | -0.15% |
| Short-Sale Activity | -0.09% z-0.8 | -0.01% | +0.17% | +0.19% | -0.16% |
| Thematic | |||||
| Gold | +0.68% z+2.1 | +0.18% | +1.52% | +1.88% | -3.59% |
| Semiconductors | -0.55% z-0.9 | +0.57% | -1.35% | -4.12% | -6.29% |
| China | +0.32% z+0.8 | +0.26% | +0.23% | +1.36% | -2.75% |
| Bitcoin / Crypto | -0.09% z-0.3 | +0.10% | -0.48% | -0.66% | -1.41% |
| Oil | -0.11% z-0.2 | +0.50% | -0.56% | +0.23% | -2.88% |
| Treasury (Duration) | +0.01% z+0.0 | -0.19% | -0.26% | +1.08% | +0.27% |
5/20/60d windows include today's session; 1d is the previous session.
Pairwise realized correlation. Index variance net of the weighted idiosyncratic diagonal, over the cross terms — the estimator used for implied-correlation indices. 20-day window unless noted; history since 2020.
Market variance share. The fraction of cross-sectional variance explained by the market factor — the attribution companion to pairwise correlation, not a substitute for it.
Factor z-score. Today's factor return divided by its daily-return standard deviation over ~1,600 trading days.
Stock-specific (idiosyncratic) return. The part of a stock's move not explained by market, style, or thematic factors in our decomposition.
Data compiled by FactorPulse AI; edited and verified by Jeff Klein. For informational purposes only. Does not constitute financial advice, an investment recommendation, or an offer to buy or sell any securities. Always consult a qualified financial professional before making investment decisions.
For more on factor construction methodology, see www.factorpulse.com/glossary.